

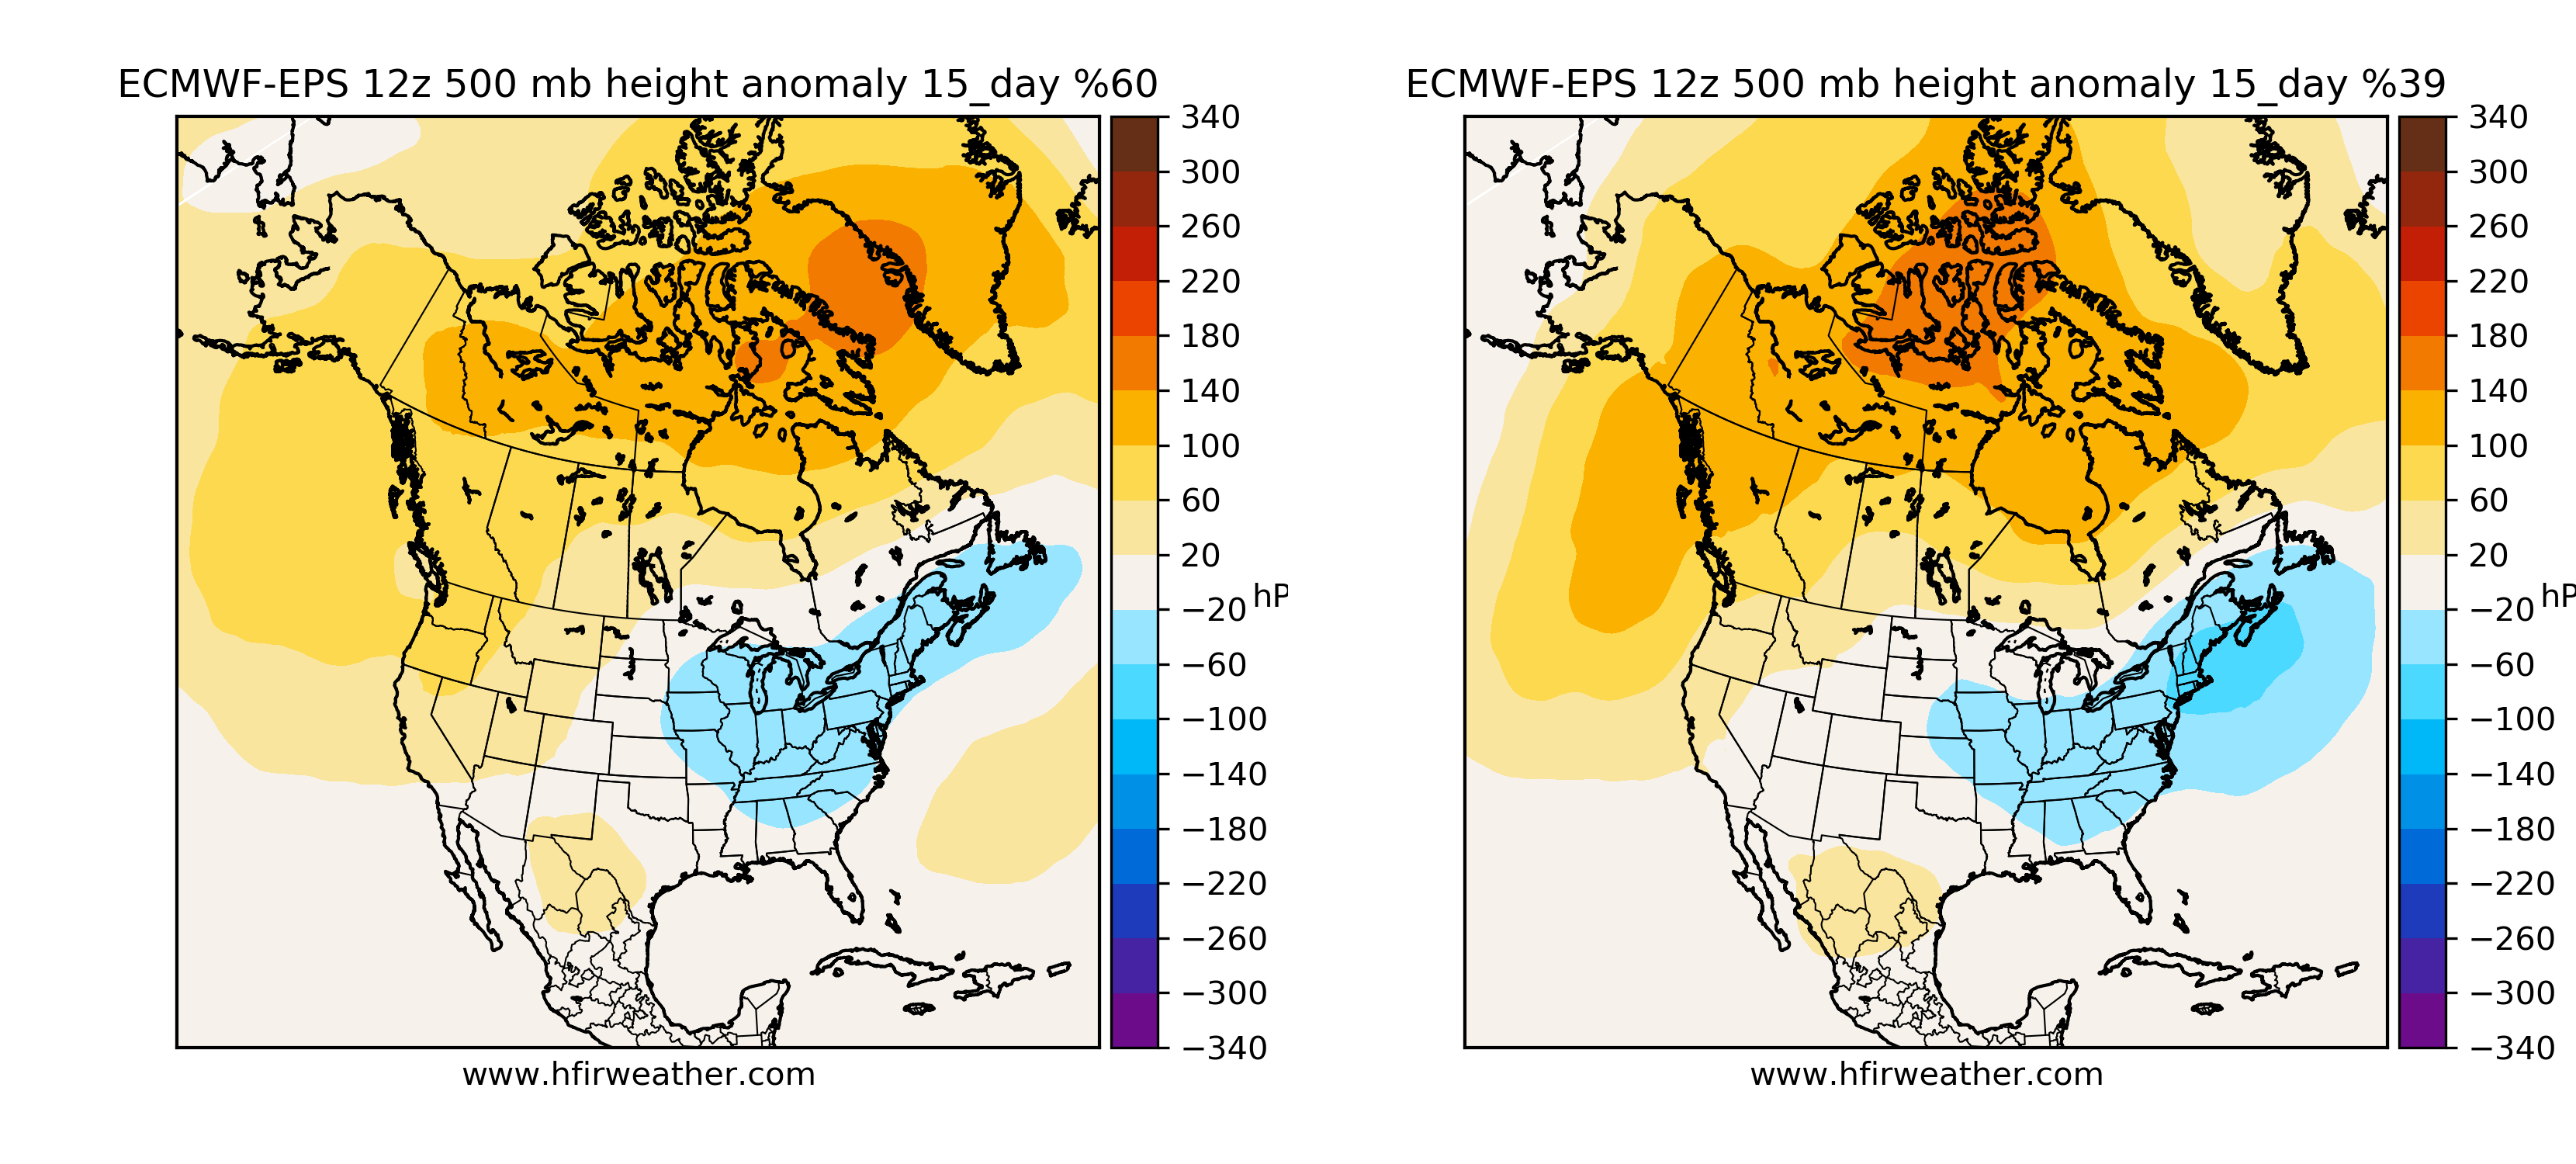
We see a very interesting and bullish setup coming for natural gas by early January. The signal that’s leading us to make this conclusion is the latest 15-day cluster chart:
Readers must keep in mind that there’s a lot of volatility in the weather models, but this pattern sets up an attractive risk/reward for those contemplating a long position here.
In Winter natural gas trading, the classic “bull” pattern is when there’s widespread ridging (yellow to red) across Alaska to Greenland. You can see this develop in the chart above. Such a pattern usually foreshadows much colder-than-normal weather in the Lower 48.
Weather forecasters on X like Commodity Wx Group are seeing historical analogs that would send heating demand through the roof.

Source: Commodity Wx Group
Again, this is not our base case view. The above pattern would equate to back-to-back weeks of 350+ Bcf gas withdrawals. Such a scenario is so bullish that you shouldn’t think about it in fear of reverse-jinxing yourself.
Nonetheless, what we are referring to is the attractive asymmetry that’s in the market today. The natural gas market sold off both February contracts and March contracts to a price point that suggests most of the bullish heating demand calculus is off the table. So for the long trade to pay off, you don’t need an extreme cold event, you just need a weather outlook that resembles that of a normal winter heating demand season.
Why aren’t prices higher if what we are saying is available to all traders?
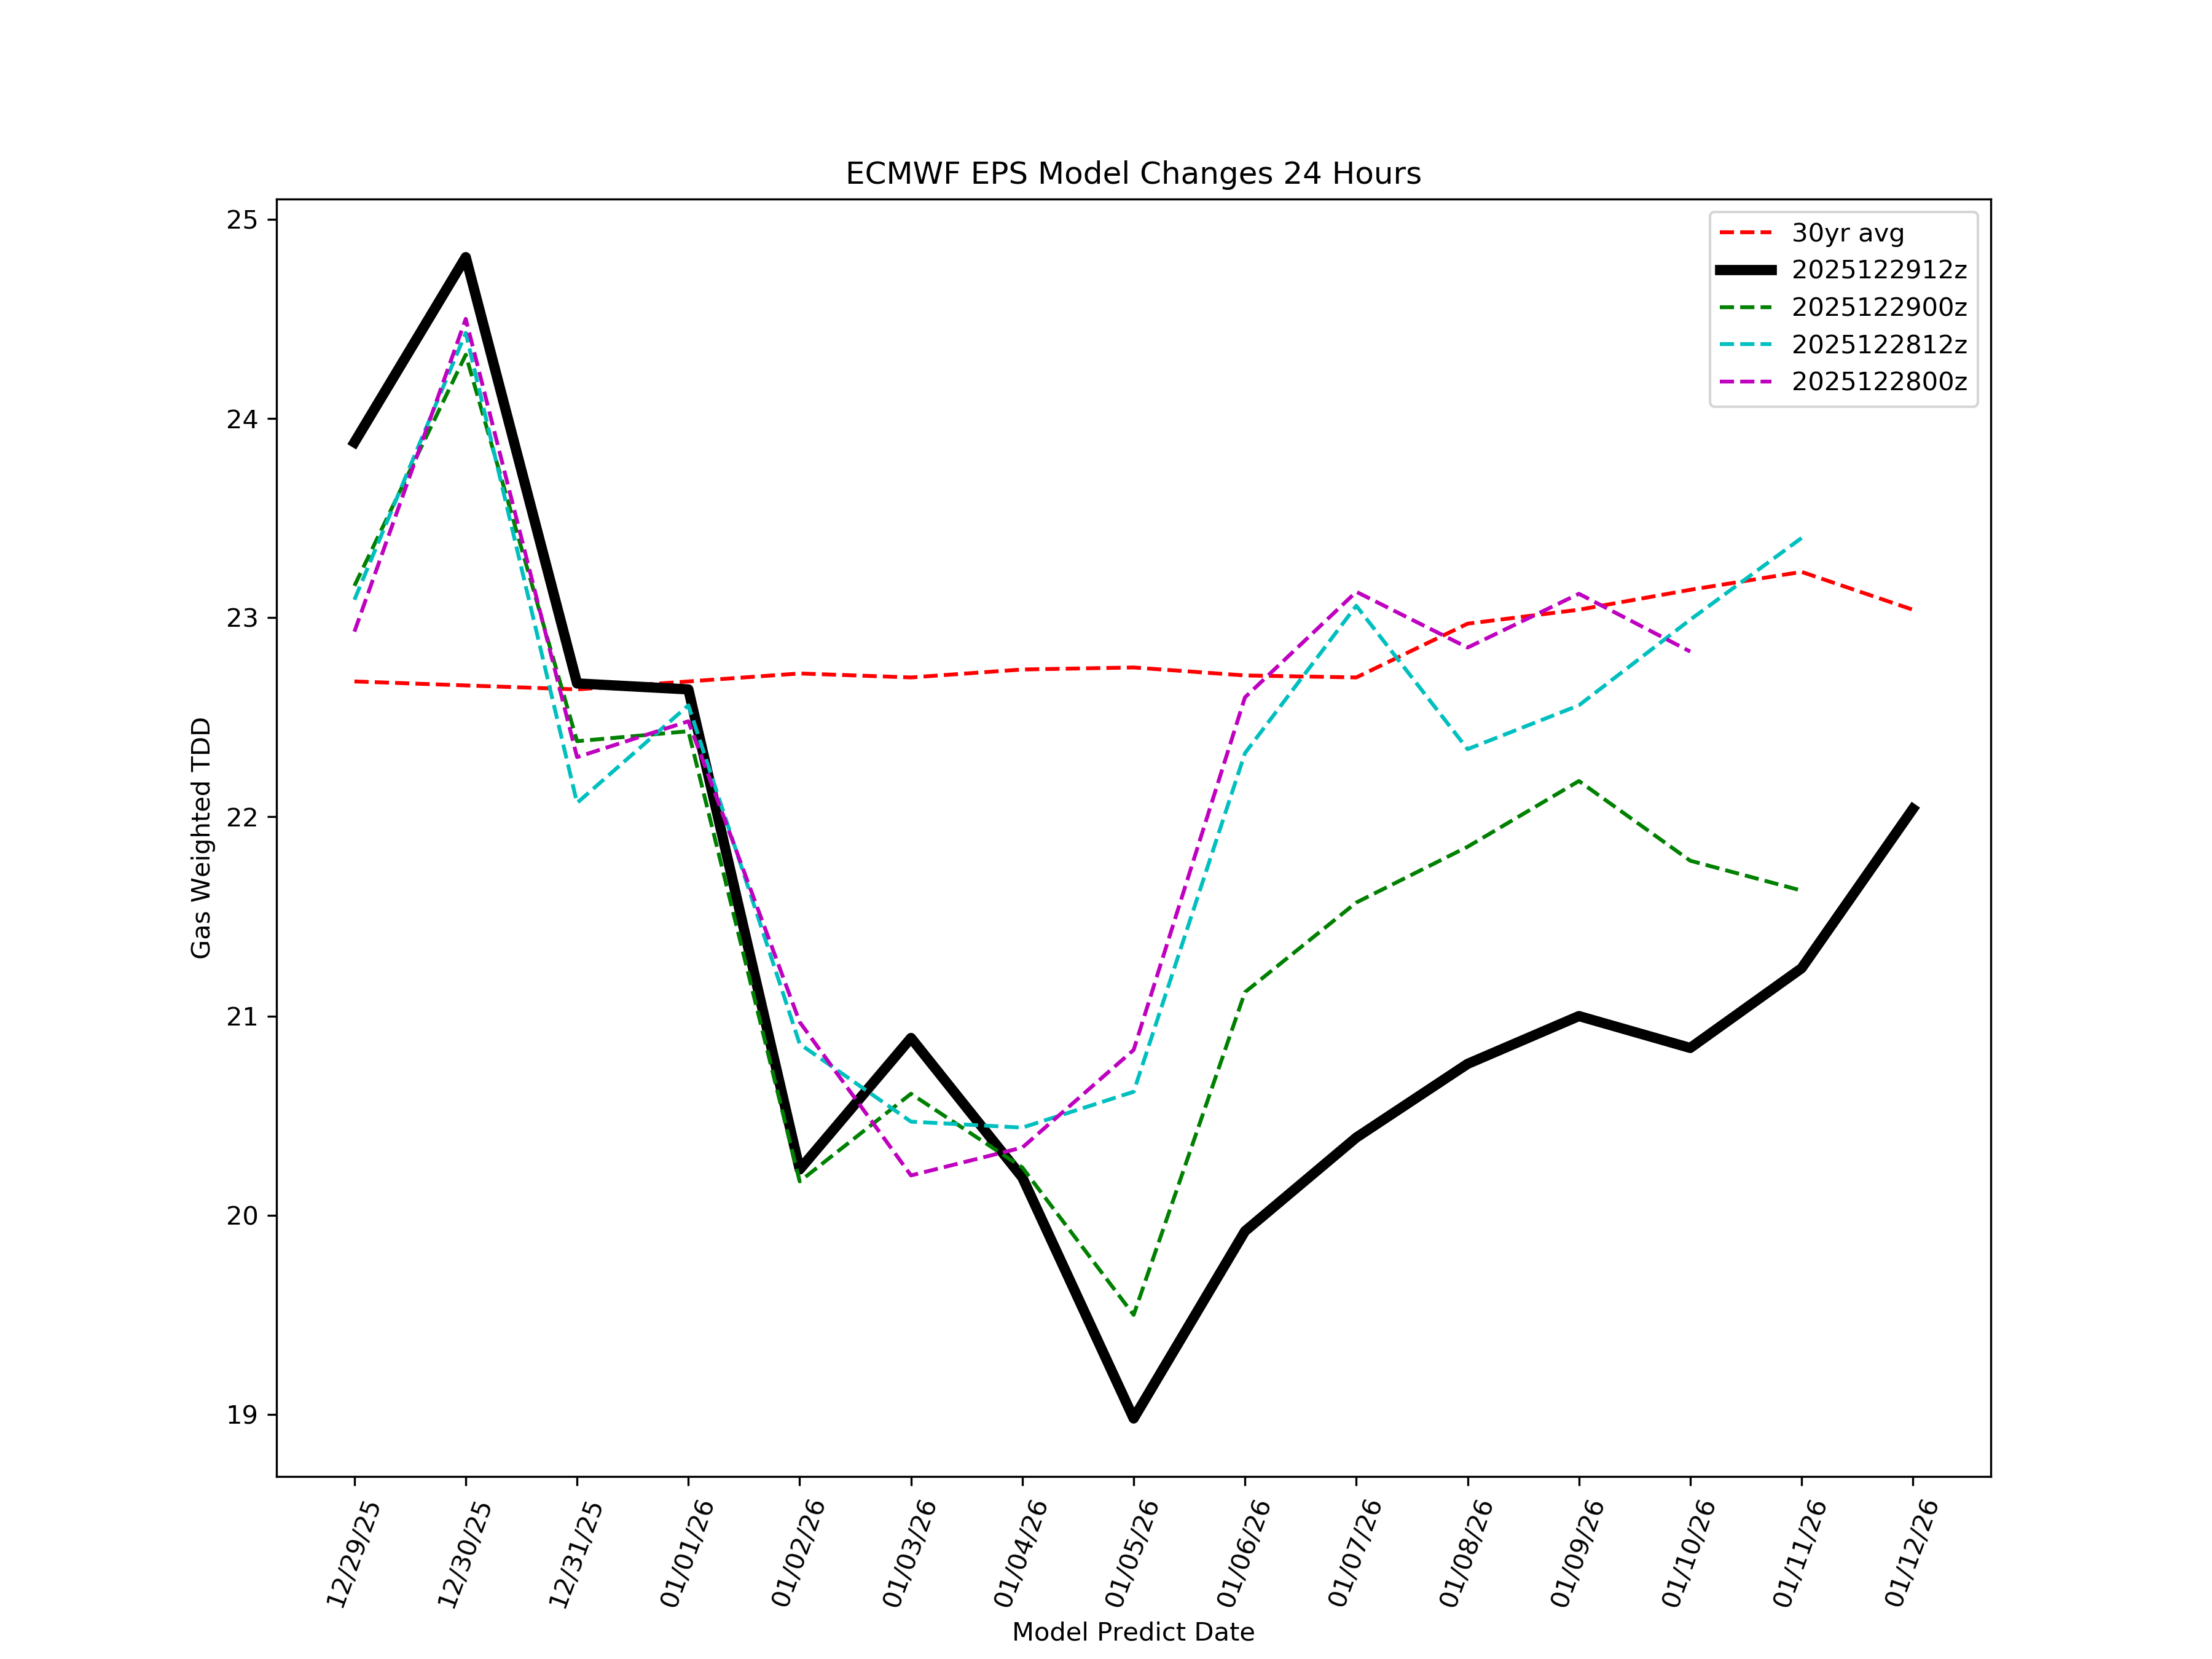
That’s because in the latest weather forecast, heating degree day forecasts remain below the 30-year norm. None of the heating demand projections is “obvious,” and this is especially true during winter gas trading.
But there comes a time when the disconnect between what we are seeing and what the market is seeing is a bit “obvious,” and this is one of those times.
Given everything we’ve said, we think it makes sense to initiate a long natural gas position today.