
E&P Valuation Sheet Updated
We've updated all of the E&Ps in our coverage using $70 and $75/bbl WTI.

By: Jon Costello
This week, I updated our cash flow and free cash flow estimates for our E&P coverage spreadsheet. (The link could be found below.)
The new cash flow estimates are based on WTI prices of $70 and $75 per barrel, a Henry Hub natural gas price of $2.50 per mcf, and a WTI-WCS differential of $12.50. Canadian AECO natural gas is priced at a 25% discount from the U.S. Henry Hub benchmark. Production estimates incorporate the most recent management guidance. Free cash flow estimates reflect each company's total capex when maintenance capex isn’t disclosed.
Charts depicting free cash flow yields at current stock prices are shown below.

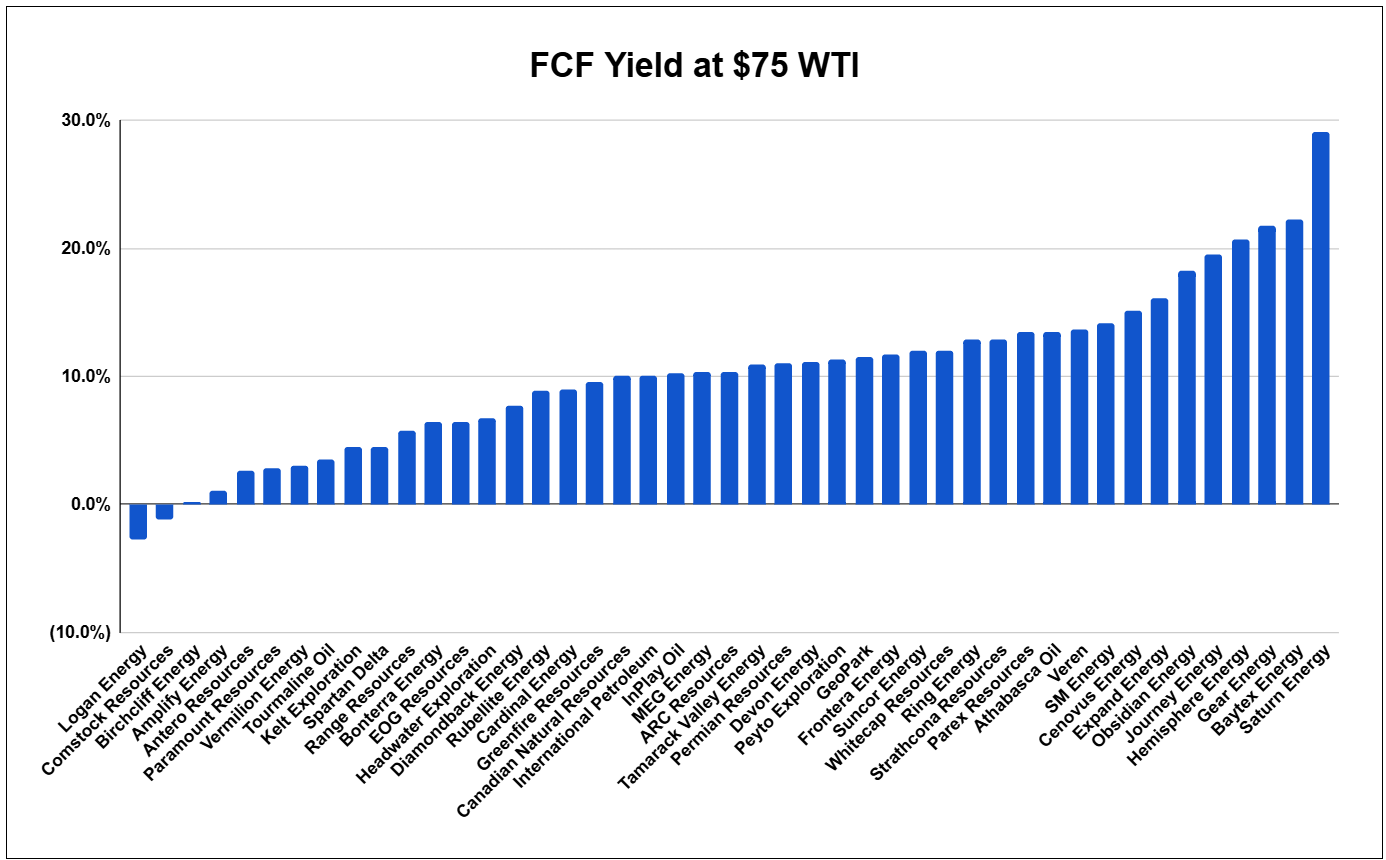
As a group, these E&Ps have an average 6.8% free cash flow yield at $70 per barrel WTI. The free cash flow yield increases to 10.4% at $75 per barrel WTI. If we assume that a 10% to 12% free cash flow yield approximates fair value, E&P stocks currently discount WTI of $75-$80 per barrel, which is not unreasonable given the pervasive negative sentiment and bearish consensus 2025 outlook.
Looking at the list, the E&Ps in our coverage universe can be grouped into six buckets based on their unique characteristics and outlooks. I discuss each one below.