


By: Jon Costello
This is the first part of a four-part review of the energy's current state, portfolio positioning in light of near-term hazards, the sector's outlook, and.
Oil prices have been on a wild ride so far this year. In February, WTI touched $80 per barrel and proceeded to plunge as low as $55.12 in early April.

Source: Yahoo! Finance, April 24, 2025.
The volatility was spawned by a cocktail of macro events, such as OPEC+’s recent decision to return barrels to the market, as well as a widening disconnect between prices and fundamentals and, of course, the economic fallout from U.S. tariffs.
The oil market’s macro picture hasn’t been this chaotic since the Covid plunge back in 2020. I took a moment to digest the current picture in what follows.
Oil Prices Weaken Amid Strong Fundamentals
While oil futures prices have plunged, the physical oil market has shown no such weakness. In fact, supply has undershot the oil market’s consensus expectations and demand has exceeded them so far this year.
The futures market selling has widened the disconnect between oil prices and oil supply/demand fundamentals. Prices have declined even though supply is stable and demand is healthy.
This disconnect rears its head during times of market stress. When fear is in the air, the correlation between oil prices and movements in the stock market increases, as oil becomes the favored vehicle by which hedge funds express a bearish view of the economy. The oil market is convenient for these traders because it’s large, economically sensitive, and can remain out of sync with physical commodity market conditions for prolonged periods. It’s no wonder why funds rush to sell oil short when the economic outlook deteriorates.
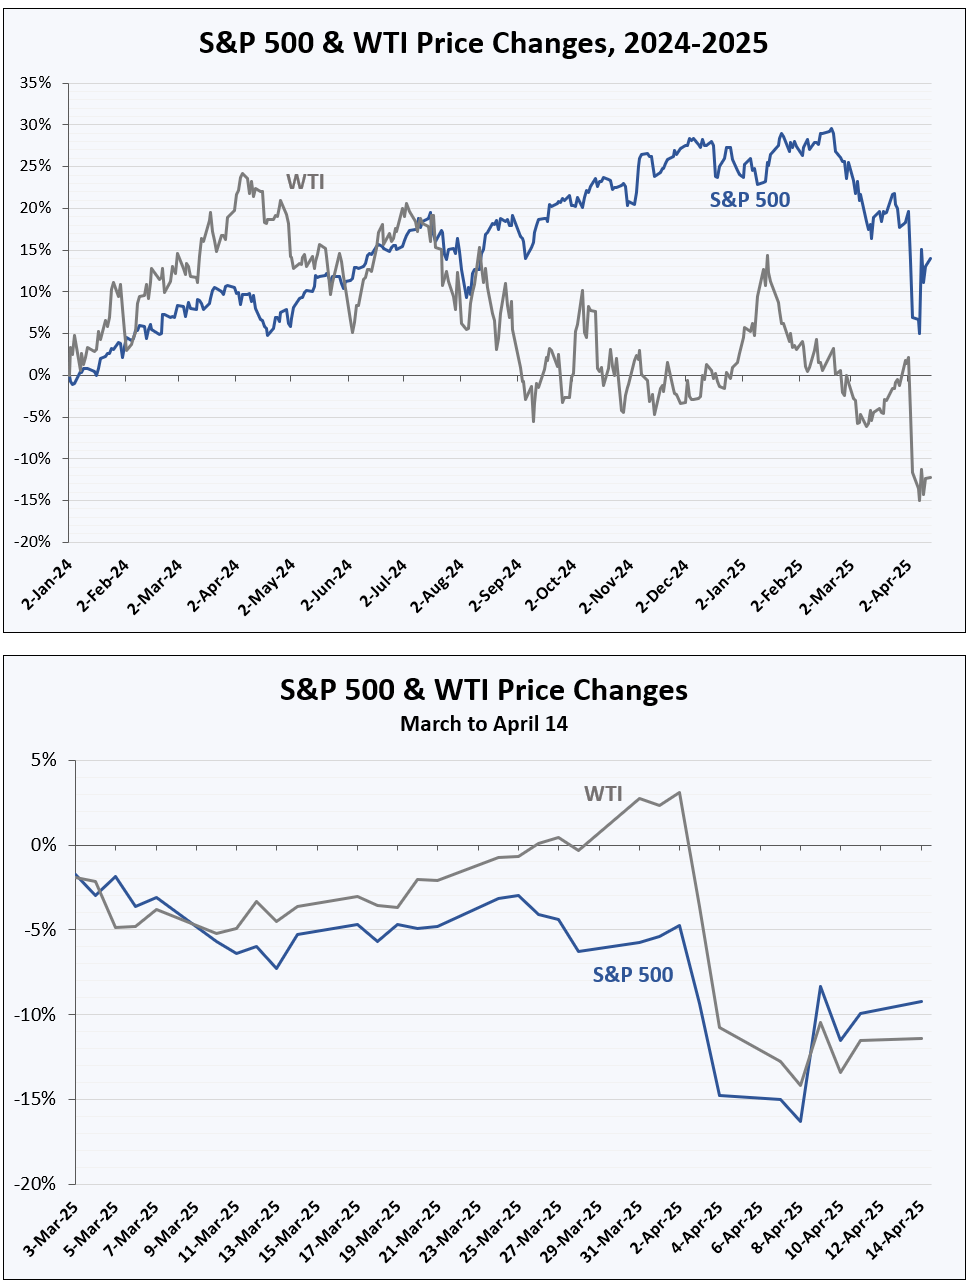
The correlation between oil prices and stocks—two variables that typically do not share a significant pricing relationship—is captured in the following charts, which compare the prices of WTI with those of the S&P 500.
The first chart depicts price changes from January 1, 2024, to April 14, 2025. A quick glance shows no correlation between oil prices and stocks. This is the normal relationship between the two variables. However, the bottom chart is different. It shows price changes from March 1 through April 14 of this year. Notice the much tighter correlation.
When oil prices respond to the stock market instead of fundamentals, they become increasingly divorced from the actual state of supply and demand. These price moments can turn up outstanding long-term investment opportunities in energy stocks as shares get buffeted by the double whammy of falling oil prices and stock prices. After the panic subsides, oil prices recover back to levels justified by supply and demand. Energy stocks follow along, trading higher independently of the S&P 500.
The Oil Market is Not Oversupplied
At the moment, the physical market shows no trace of an oversupply. In fact, various metrics point to an oil undersupply. Of course, undersupplied markets are typically positive for a commodity’s price.
The oil undersupply is evident in the weekly inventory draws that have occurred this year. Inventories can only be drawn down when demand exceeds supply, as oil gets pulled out of storage to meet demand.
The typical seasonal pattern in the oil market is for inventories to build in anticipation of the summer driving season, where demand rises and inventories seasonally draw lower.
So far this year, we’ve seen the opposite phenomenon. U.S. inventories, which capture the trend of global inventories, have declined instead of increased, as shown below.

Source: Data sourced from EIA.
The chart shows today’s textbook undersupplied conditions.