
Everything You Need To Know About This Massive Natural Gas Price Drop And What To Expect Next

Winter gas natural gas trading isn’t for everyone. The insane volatility we’ve observed over the past 2 weeks will become a regular phenomenon in the years ahead as we underbuilt natural gas storage capacity despite a structural increase in export demand.
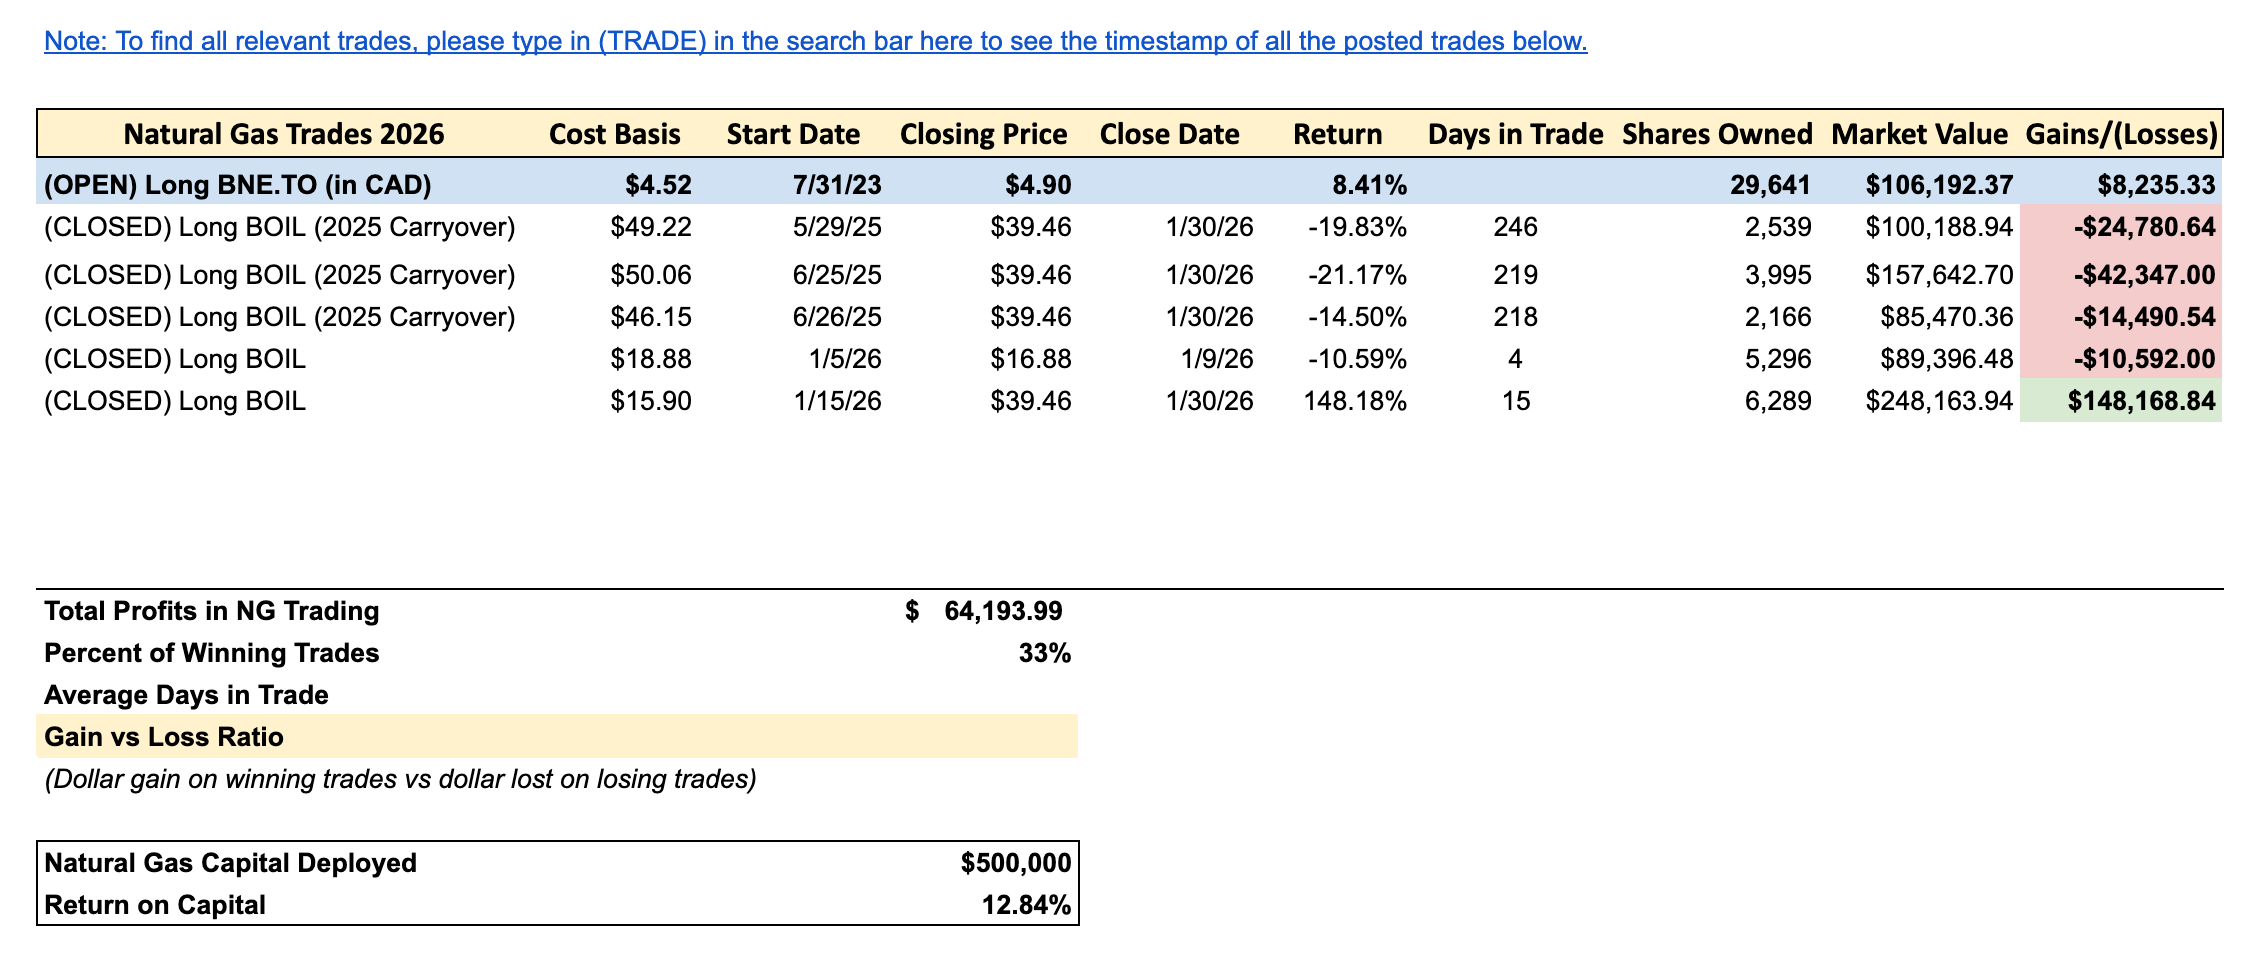
And as with anything in winter gas trading, you have to get lucky time to time, and we were fortunate to have exited our BOIL long position on Friday. Talk about dodging a bullet on that one.
X post.


In this article, I will explain everything that unfolded over the weekend, why natural gas prices are down, and where we are headed.
Fundamental Development
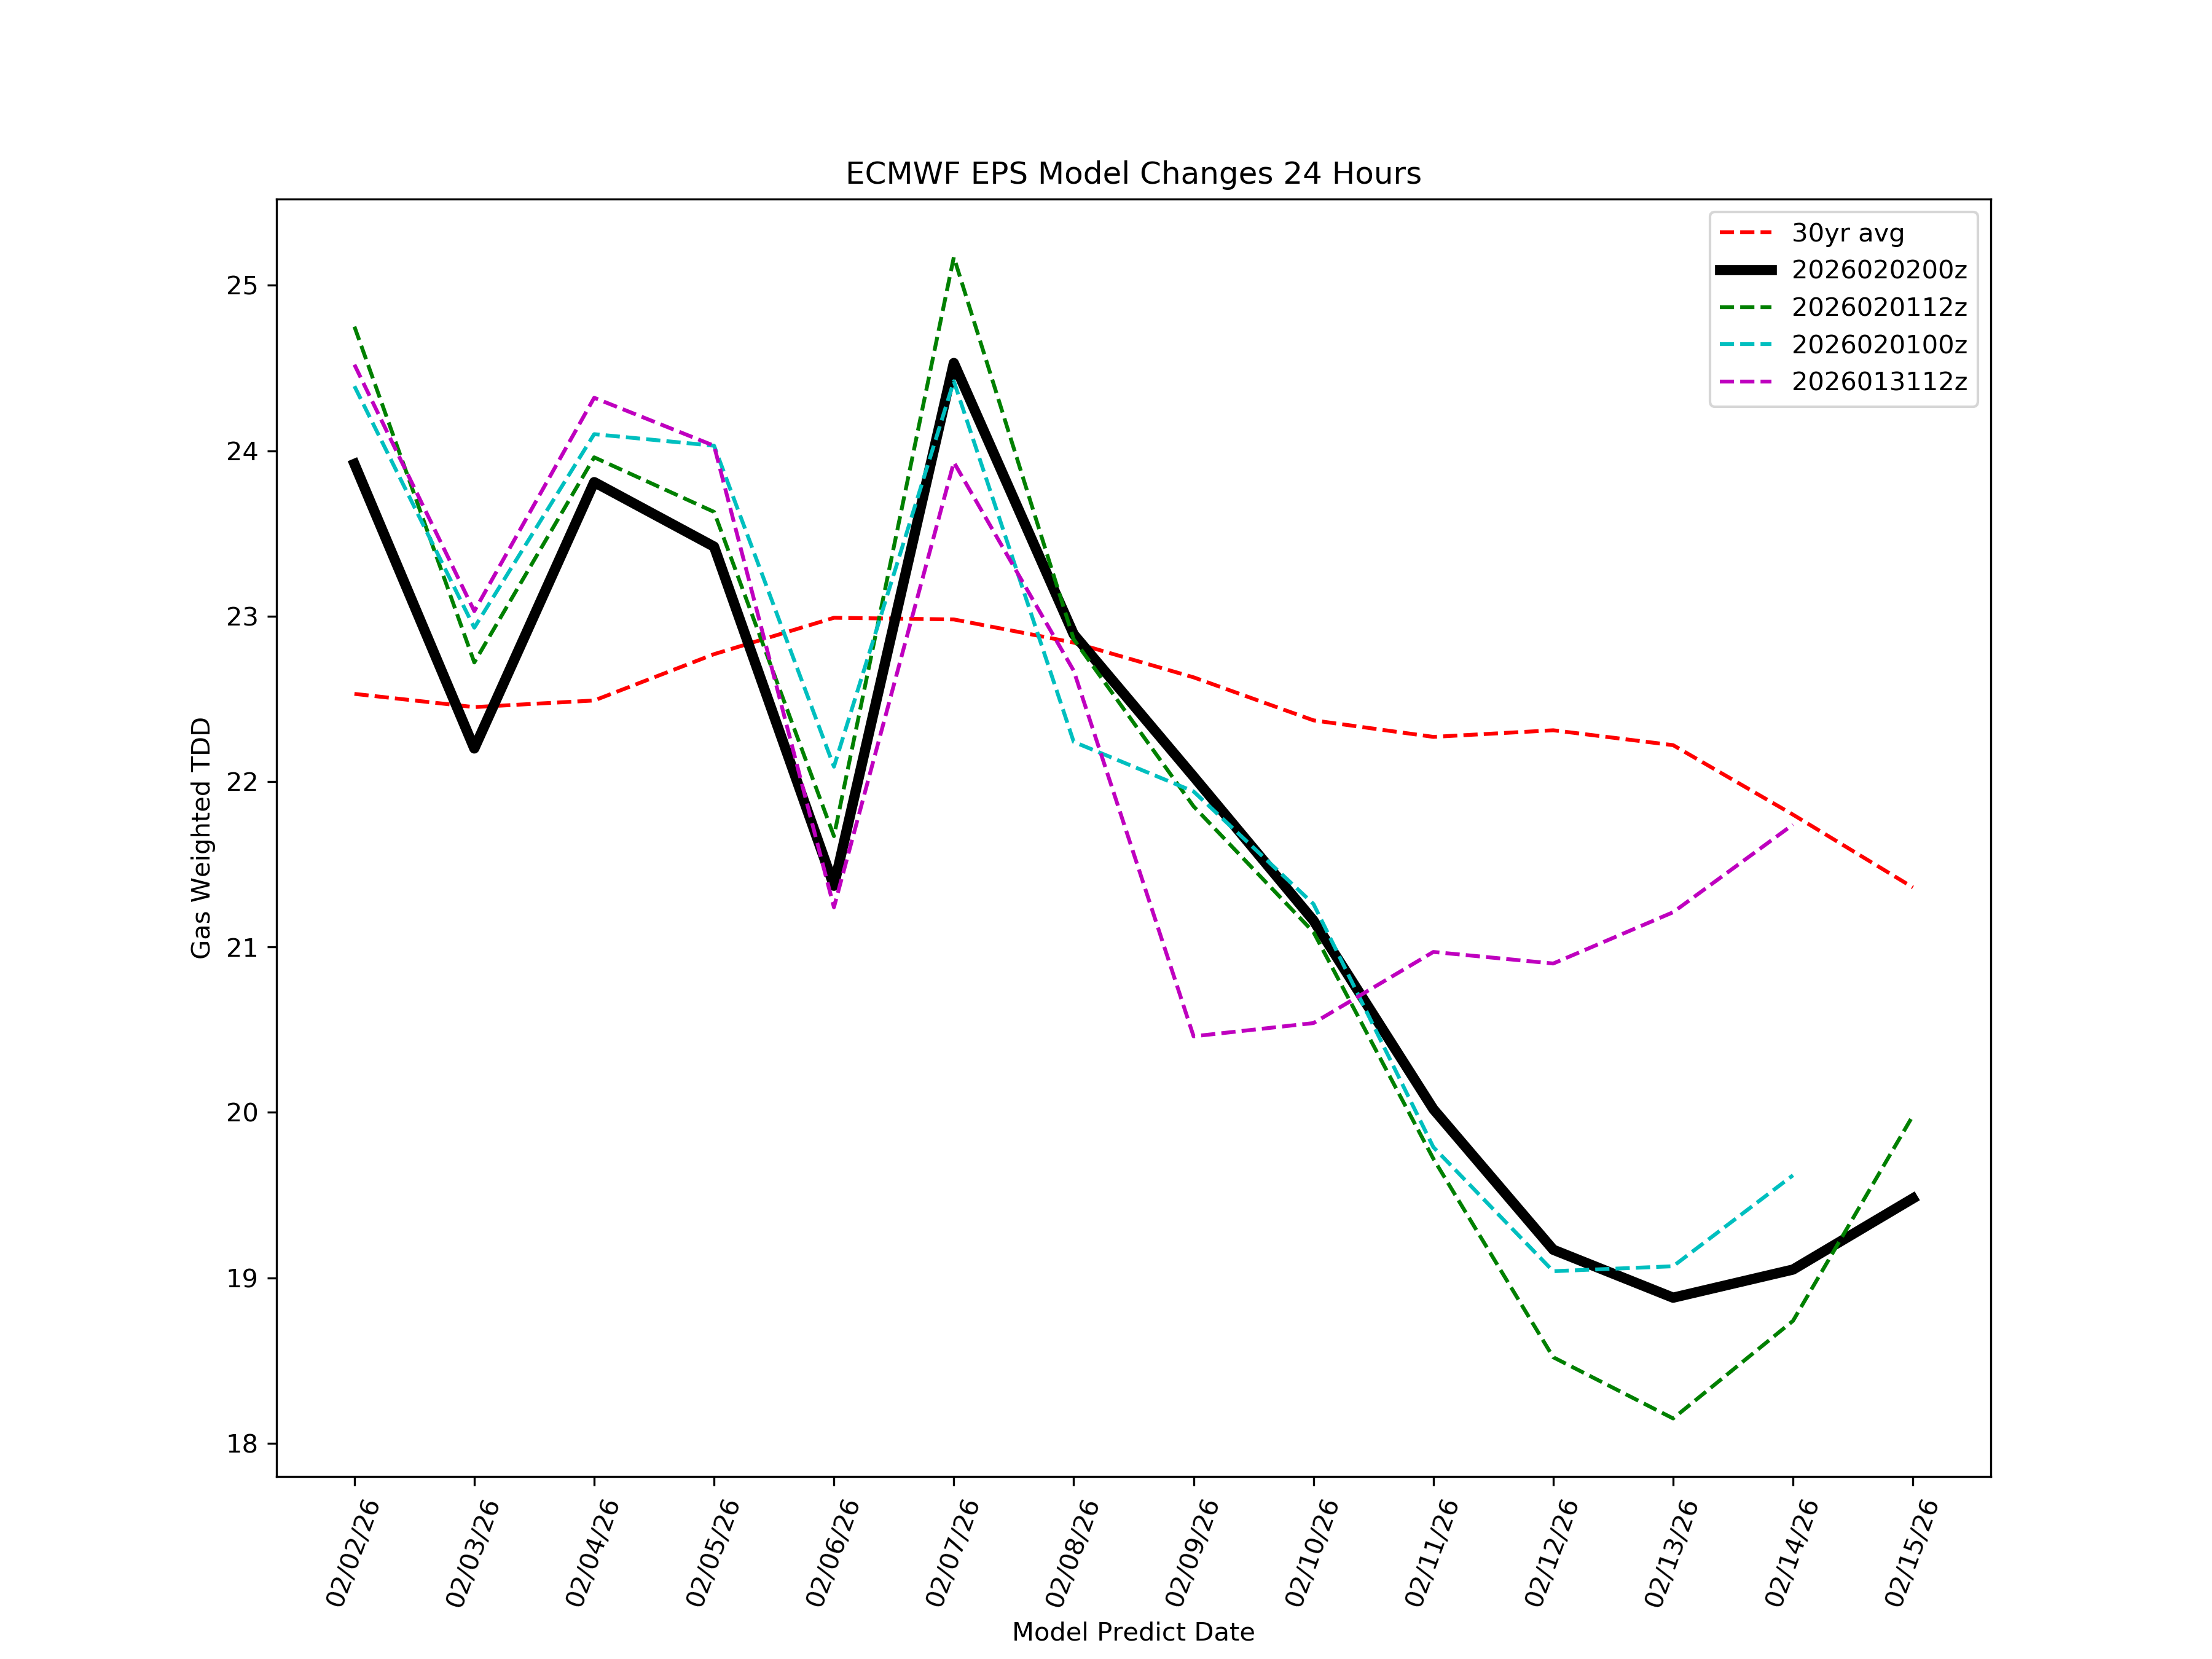
Cumulatively, ECMWF-EPS lost ~33 gas-weighted heating degree days over the weekend. On an implied storage basis, this reduced heating demand by ~200 Bcf.
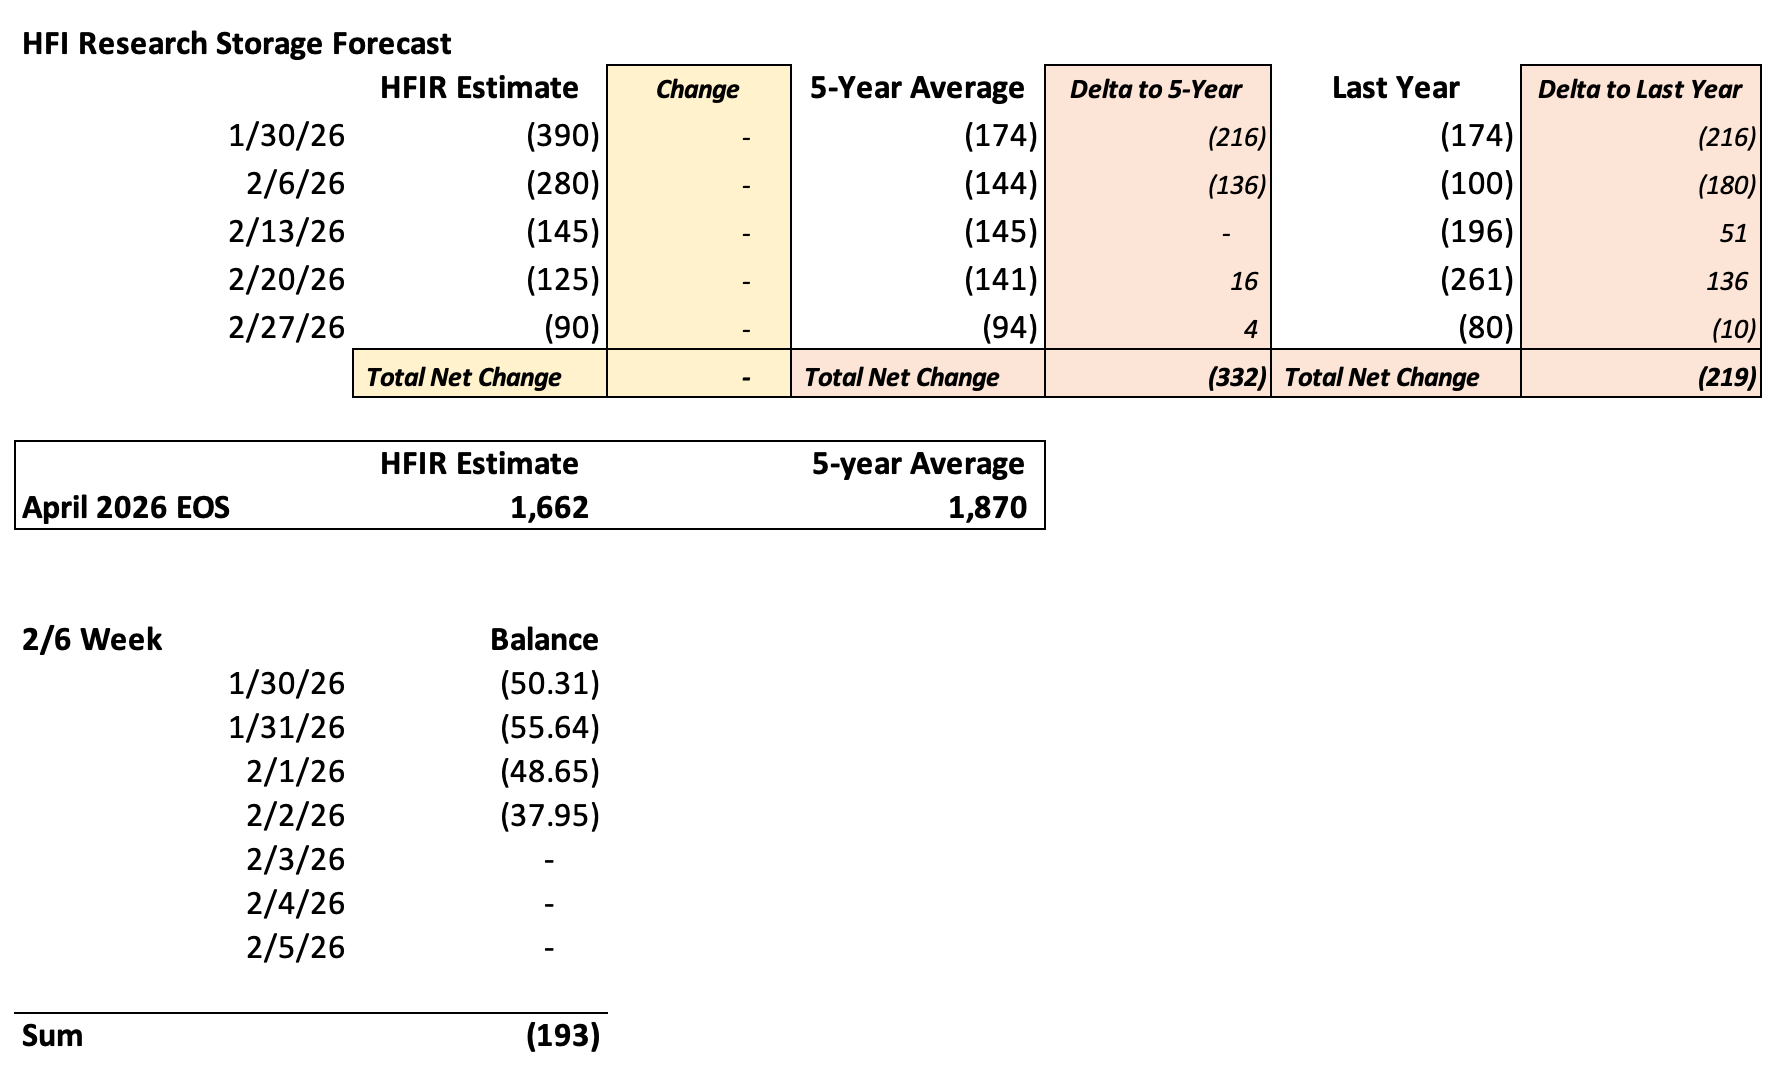
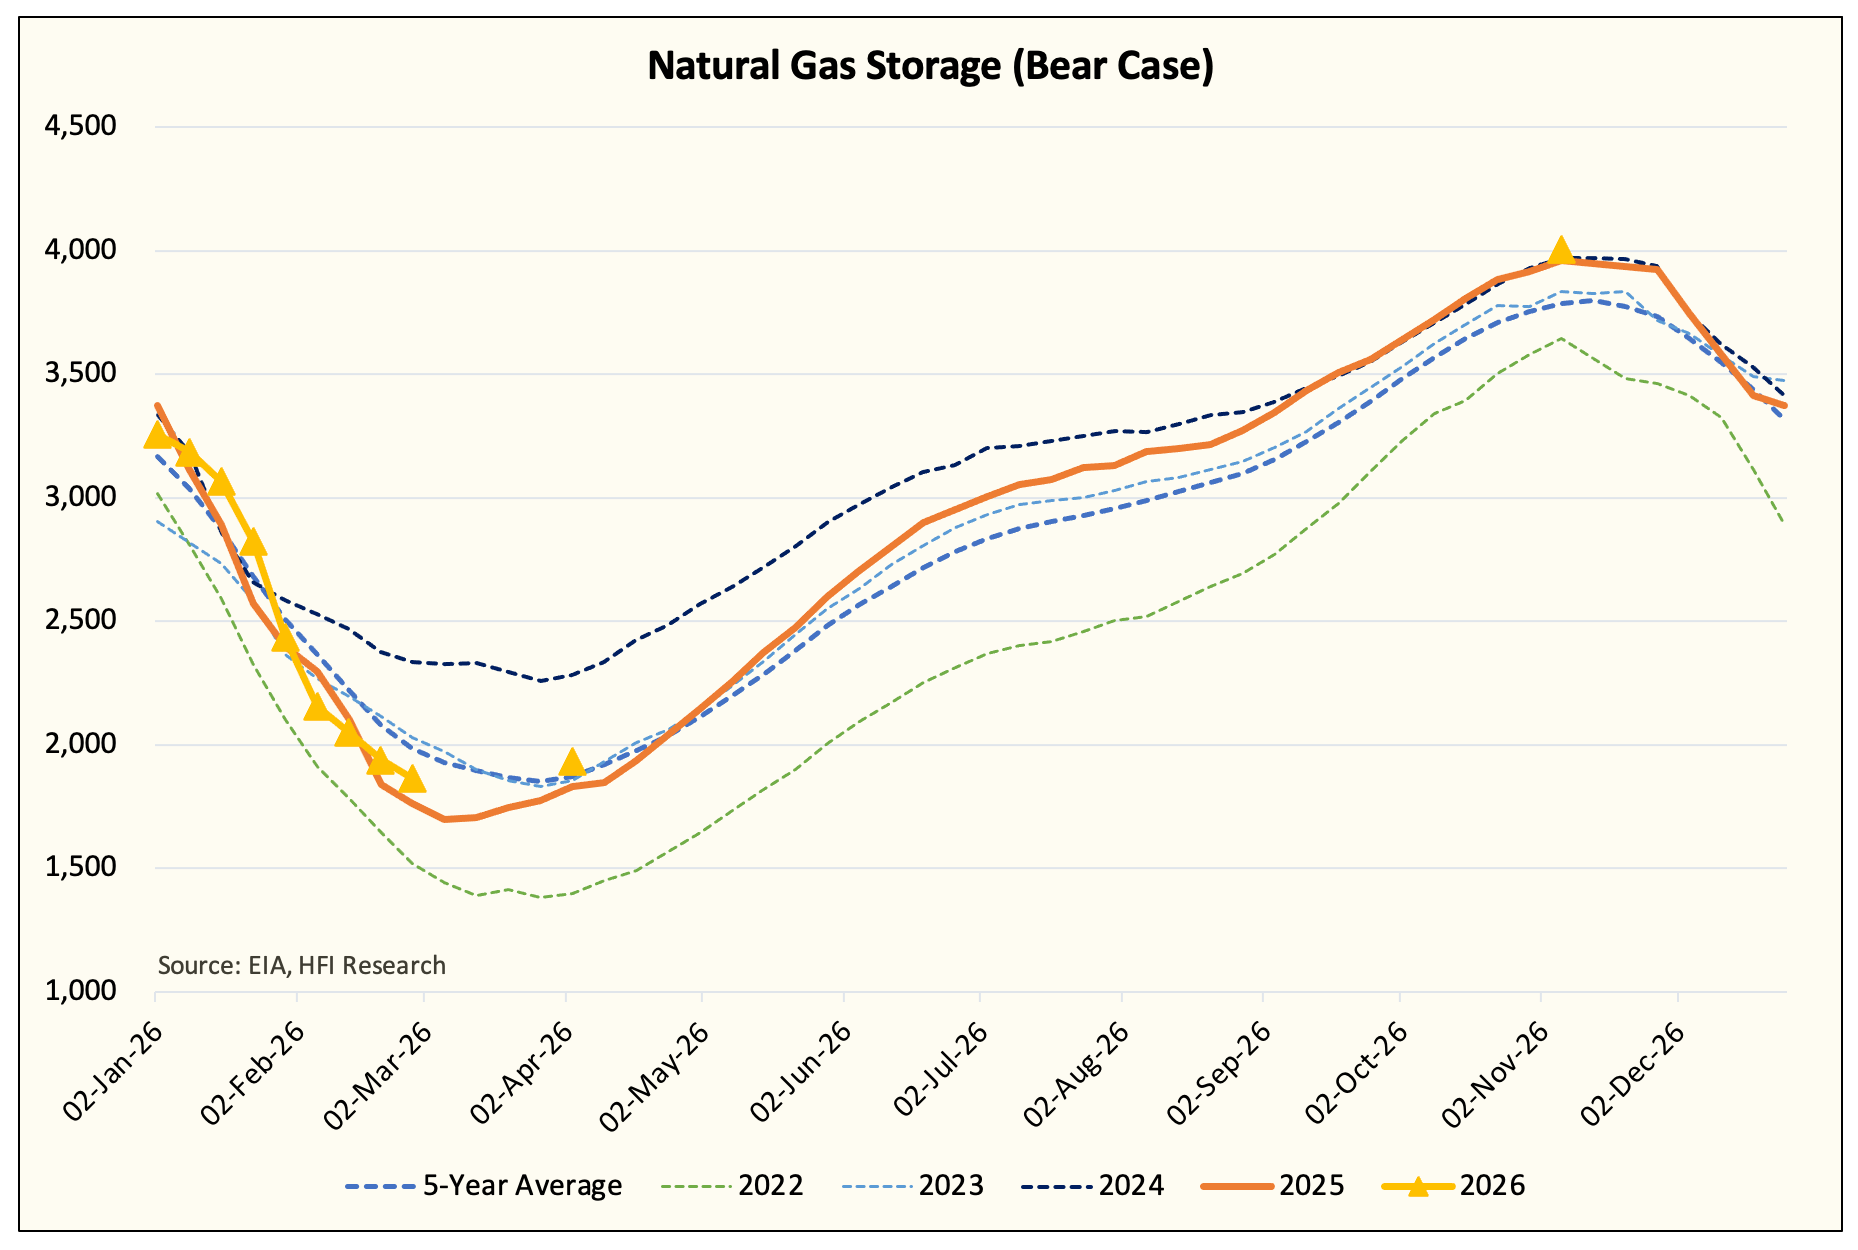
April natural gas storage has been revised up to 1.662 Tcf.
So why are March Henry Hub contracts down ~25% today?
The natural gas market is extremely sensitive to the changes in storage projections by April. The difference between ~1.9 Tcf and ~1.66 Tcf is the difference between $3/MMBtu and $4.5/MMBtu.
In our base case storage analysis, we have 1.662 Tcf, but that assumes normalized weather after the 2/20 week.
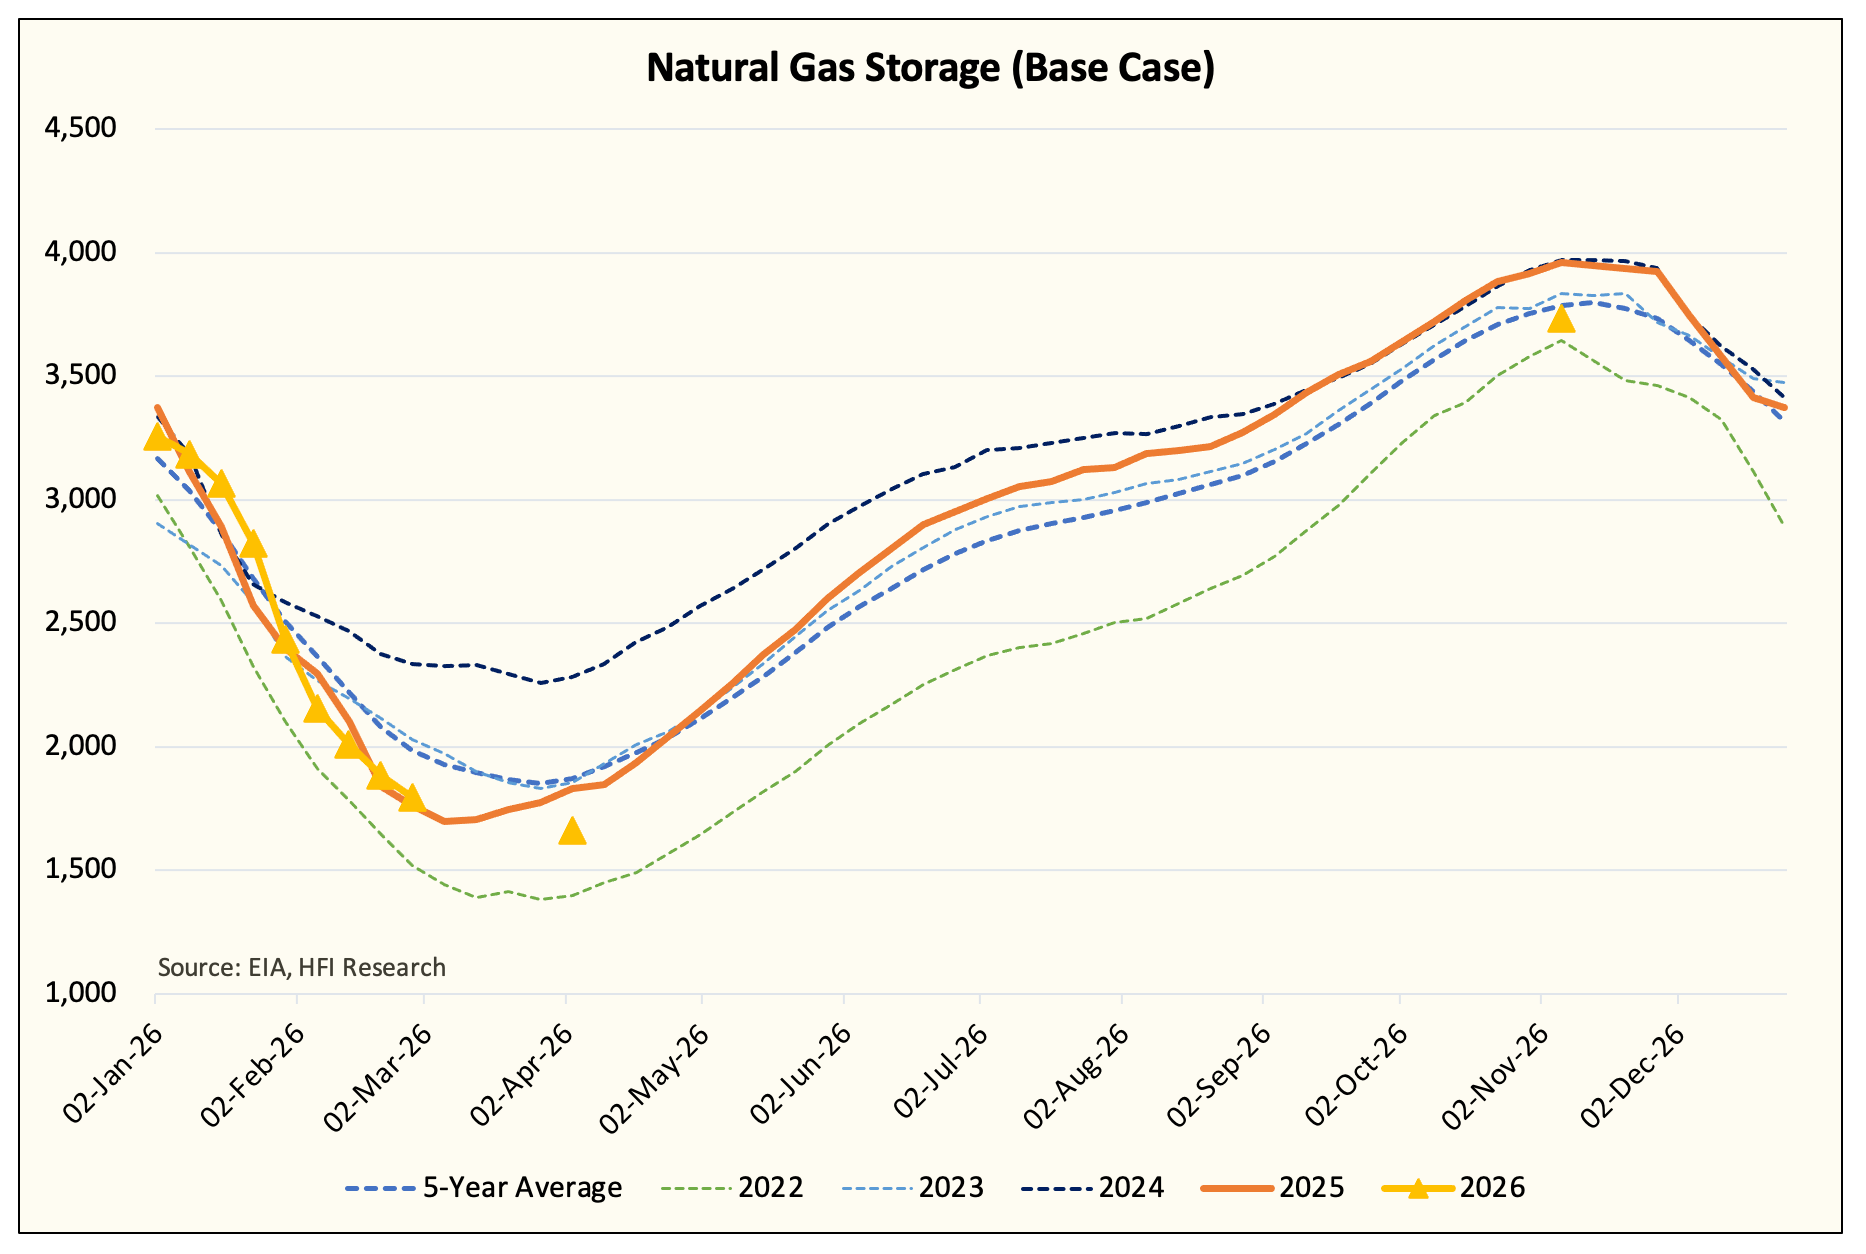
If the weather remains warmer than normal for the rest of the withdrawal season, EOS increases to ~1.9 Tcf.
This is the dynamic we are entering now. The weather developments over the next 6-8 weeks can still meaningfully impact where we are headed.
What about the weather?
As we wrote last week, bearish signals were developing in the backend of the forecast. The Pacific North Oscillation (or PNA) started to trend negative, which usually signals the Southeast ridge, a very bearish weather pattern during the winter.
Thankfully, I’ve made past mistakes where I thought the PNA signal was not enough to overwhelm both the Arctic Oscillation (Arctic air) and Eastern Pacific Oscillation (Alaska pattern). The Southeast ridge ended up winning and this time appears to be no different.
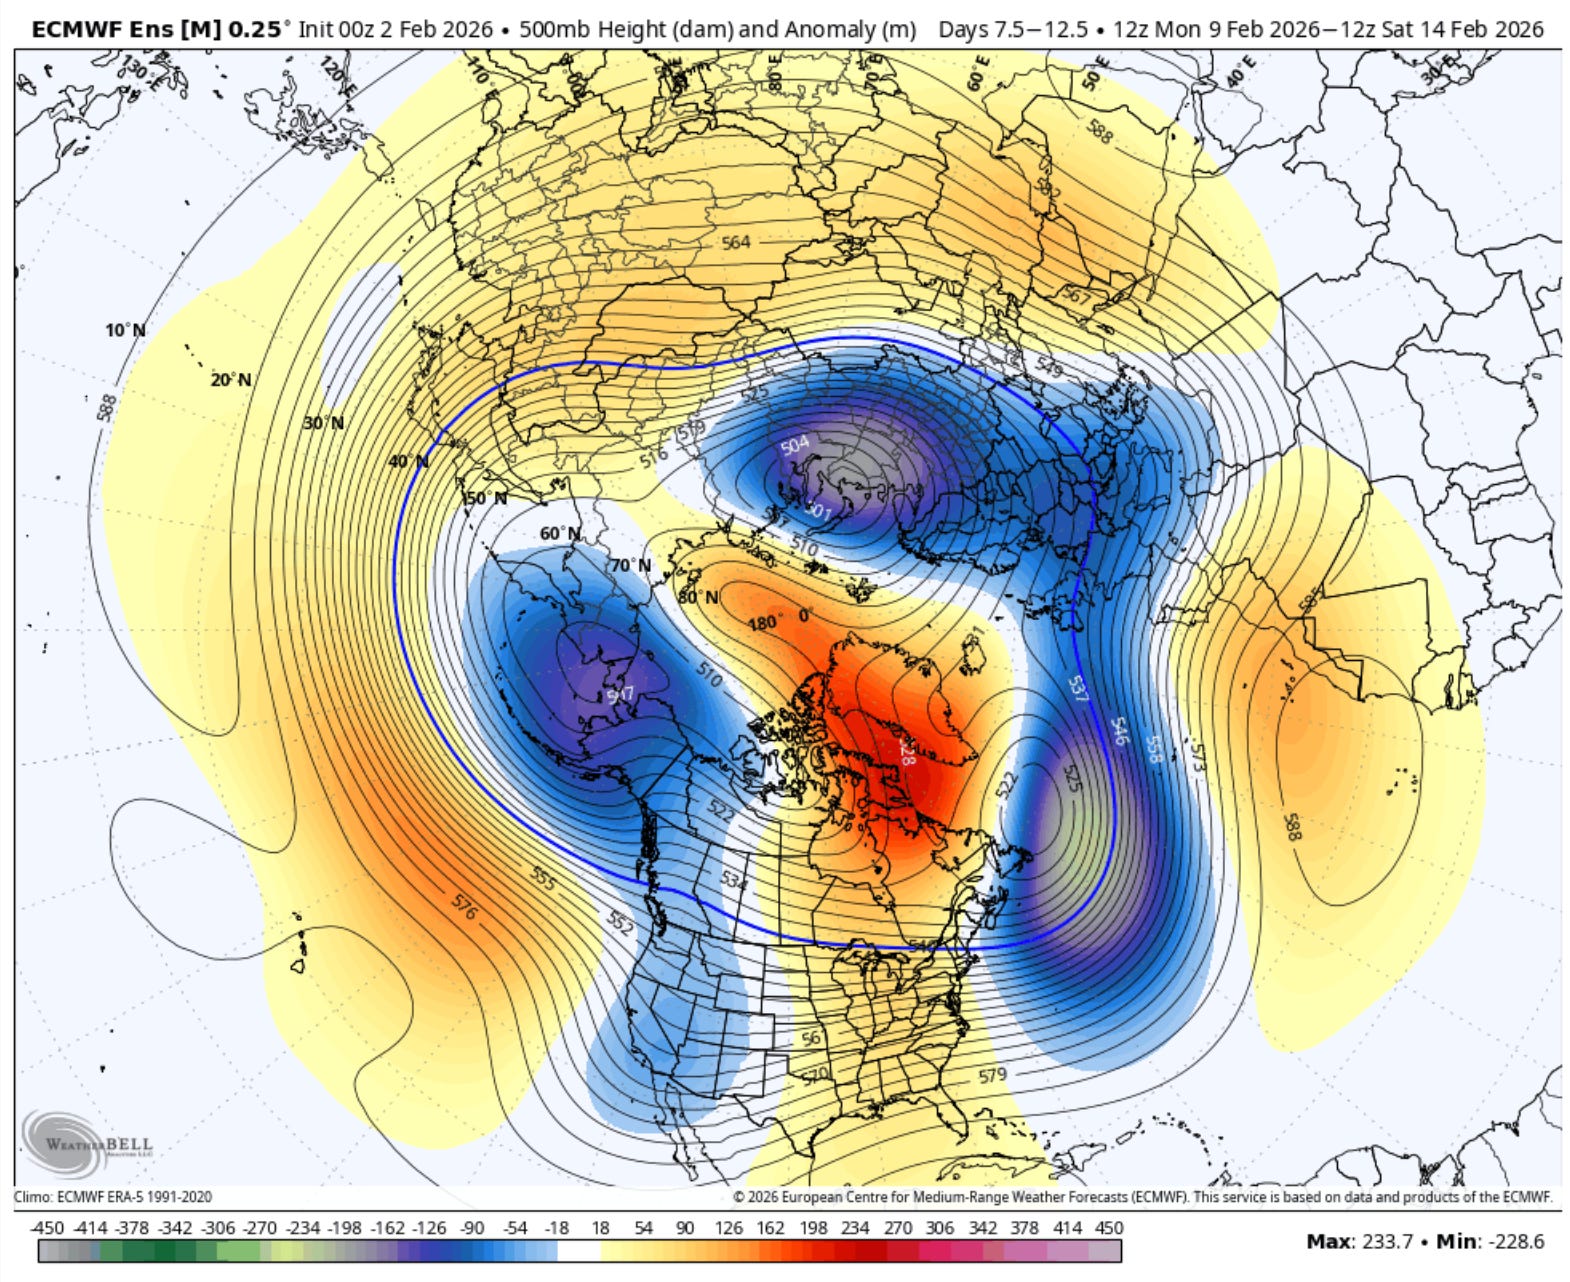
Source: Weatherbell.com
To further add to the bear signals, the Alaska pattern also appears to be shifting to a trough, which usually signals a warmer-than-normal outlook.
In essence, the teleconnection signals, with the exception of the North Atlantic Oscillation, are all pointing to the bear side.