


At HFIR, our approach is to develop a thesis, test it, set post-mortem signals, and then pivot if needed.
In April, when I wrote the breaking point article on the oil market, I said that it was impossible to know where oil prices peak because 1) we are not certain about the sensitivity of demand to rising prices and 2) how long the conflict would last.
Now that we are nearly 8 months into this Iran war, we have a glimpse of just how well US oil demand is holding up:
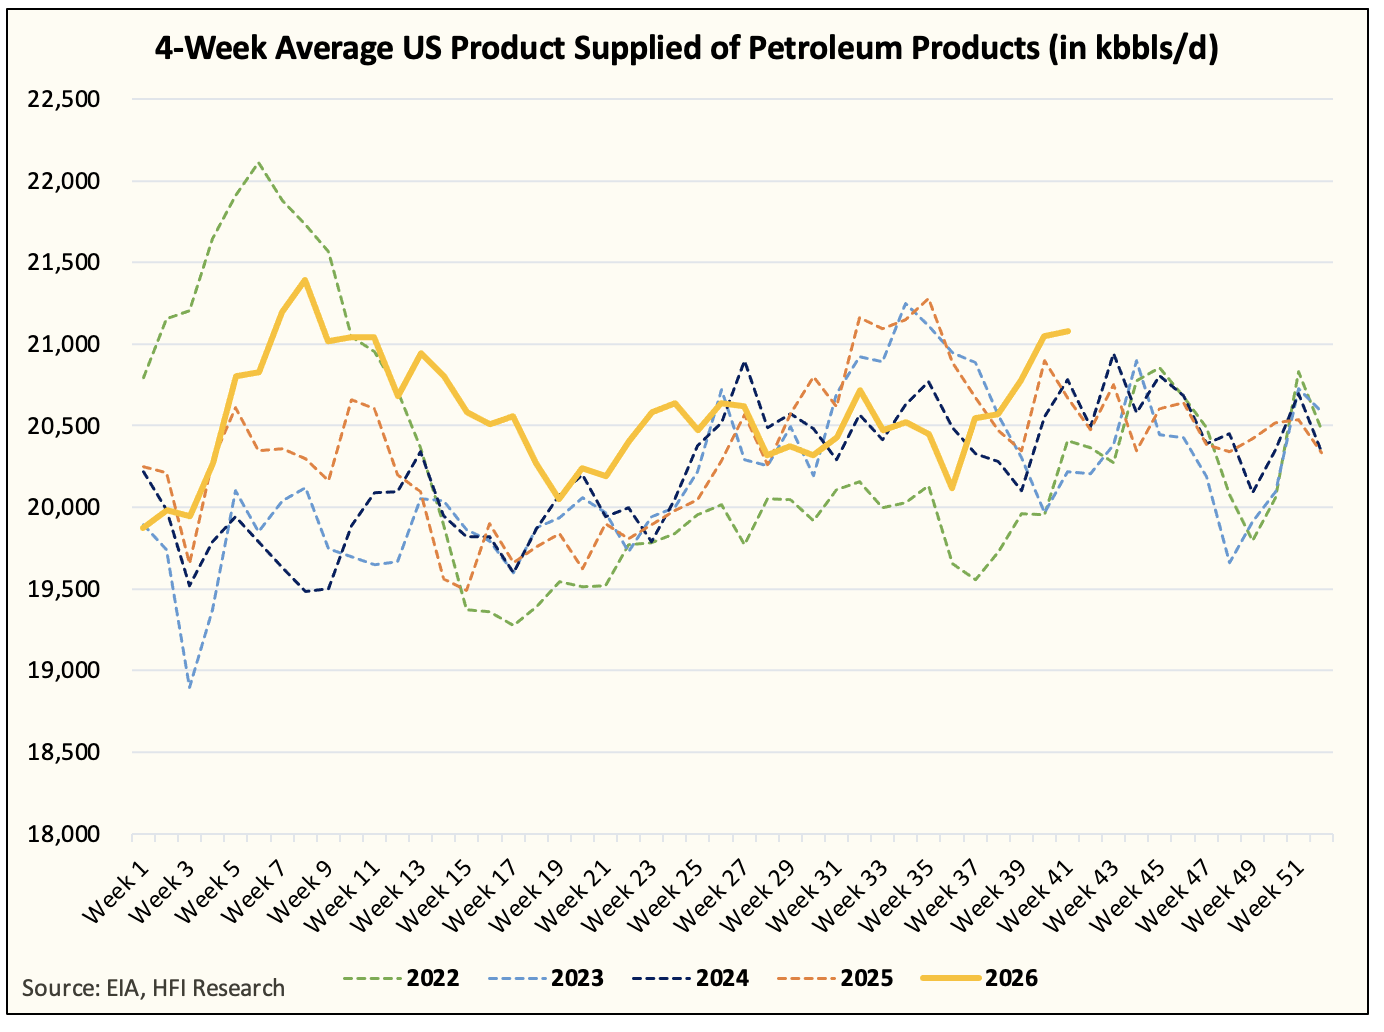
There is something quite remarkable about this implied US oil demand figure. For those of you not attuned to the data, product supplied is used as a proxy for demand, but it reflects not just US oil demand, but the rest of the world.
Given the petroleum product shortage we are seeing across the globe, US refineries have been operating as close to max as they can. As a result, anything that’s not being used domestically is being exported. And as I’ve said before, there has to be demand for there to be exports.
Looking solely at this metric, which is better at capturing implied US oil demand better than anything else in the market, it’s hard to come to the “demand destruction” is here thesis.
In fact, I would urge you to look at this 2008 implied US oil demand chart to see the stark difference:
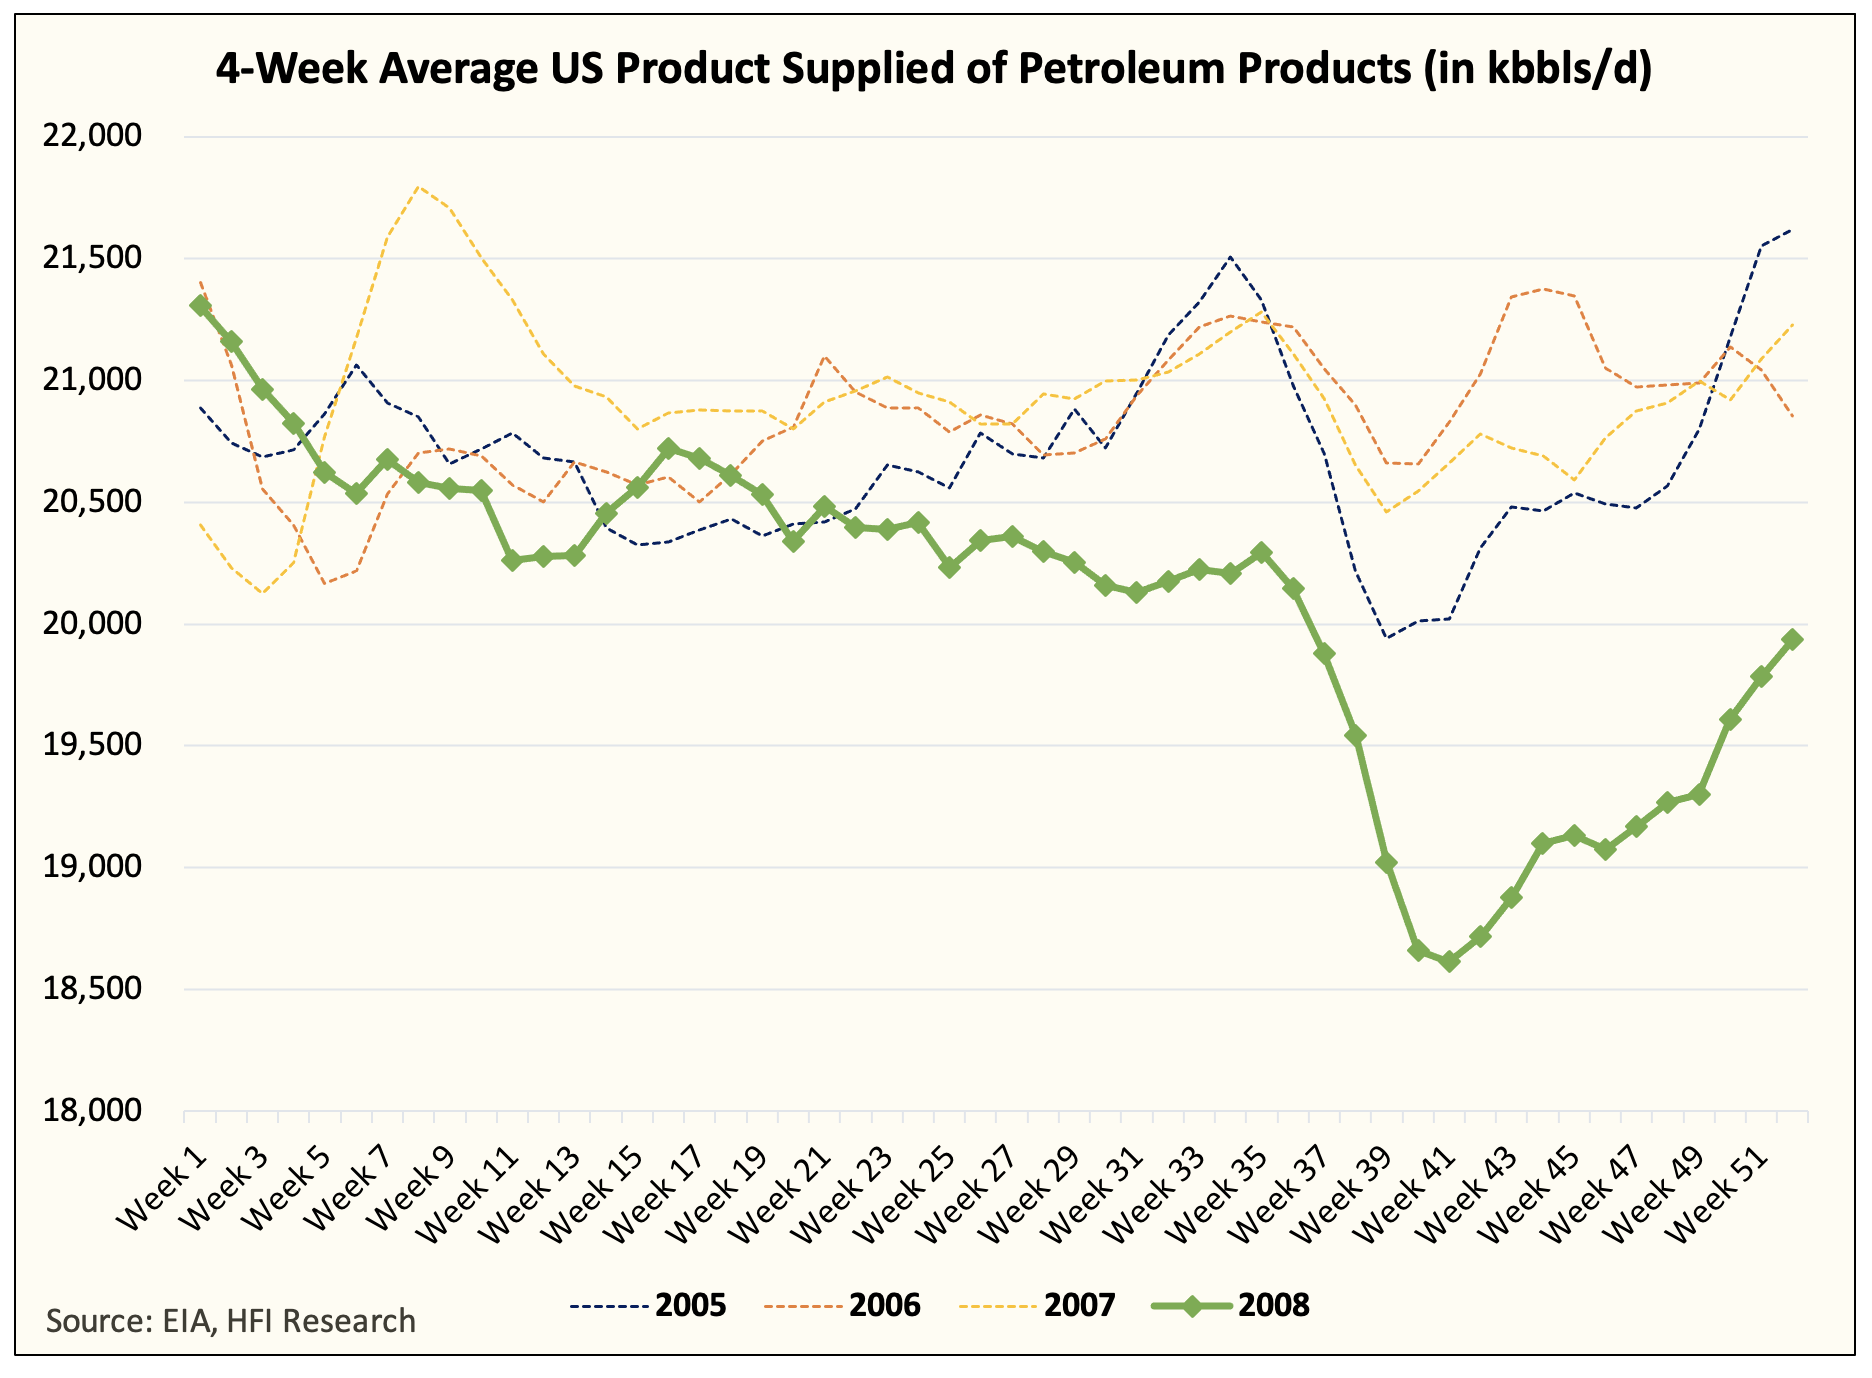
For all of the complaints people have about the EIA, it is truly the only energy agency in the world that provides these transparent datasets to the investment community.
Based purely on historical analogs, we are nowhere near any “demand destruction” levels, at least for the developed economies. IEA seems to think that the world has already lost 2.5 million b/d, and China is 0.73 million b/d of that.
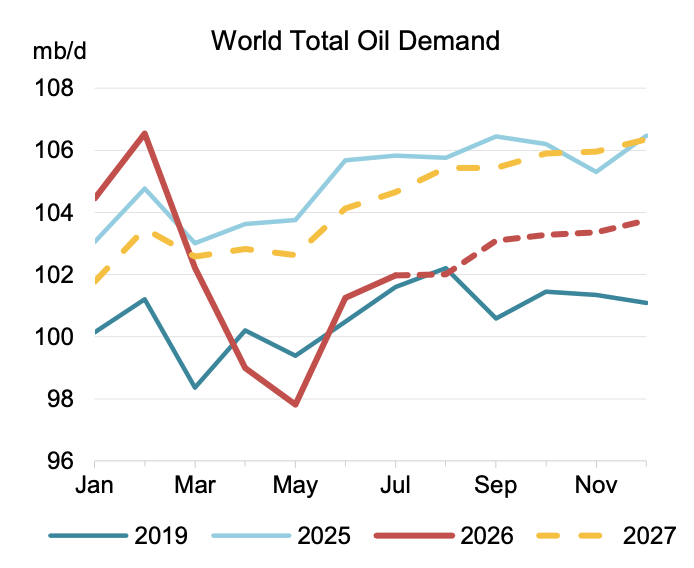
Source: IEA
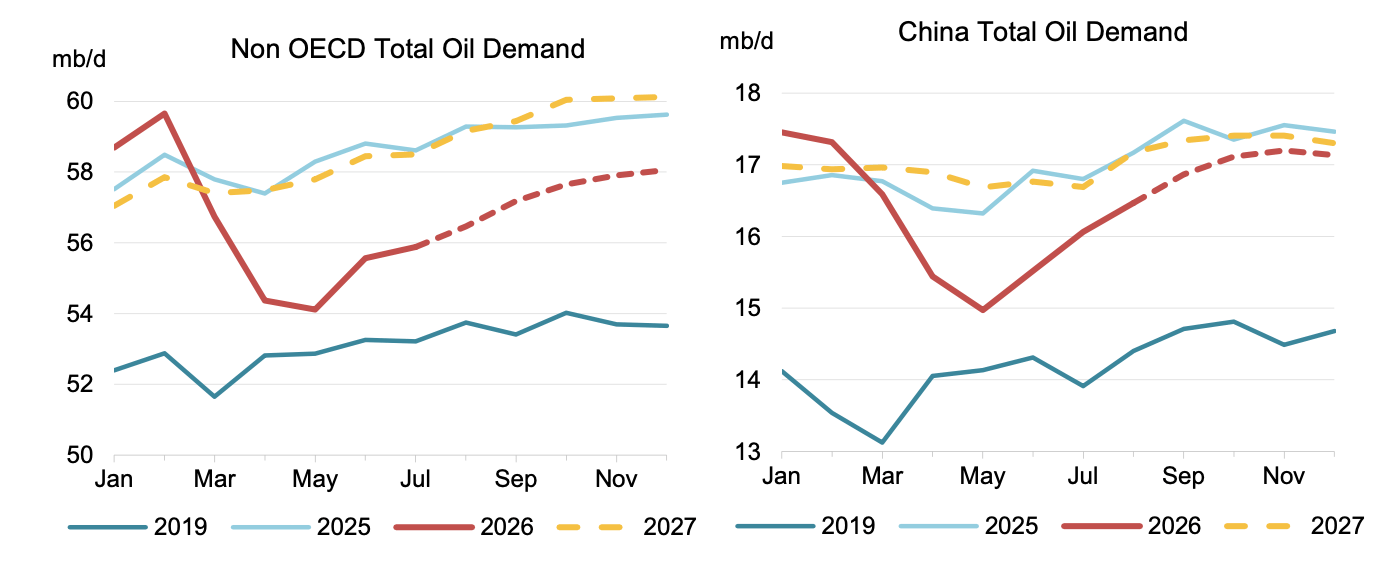
Source: IEA
I would partially agree with the IEA’s assessment here given that we know ~0.75 million b/d of 2025 demand came from China’s SPR buying. But to say that the rest of the world lost the same amount of demand as we did during the 2008 to 2009 great financial crisis is a bit of a stretch.