
(Important) Our New E&P Valuation Sheet

Today, we’re revamping the spreadsheet that details the cash flow and relative valuations of the E&P stocks in our coverage universe. The link can be found at the bottom of the page. A screenshot is shown below:
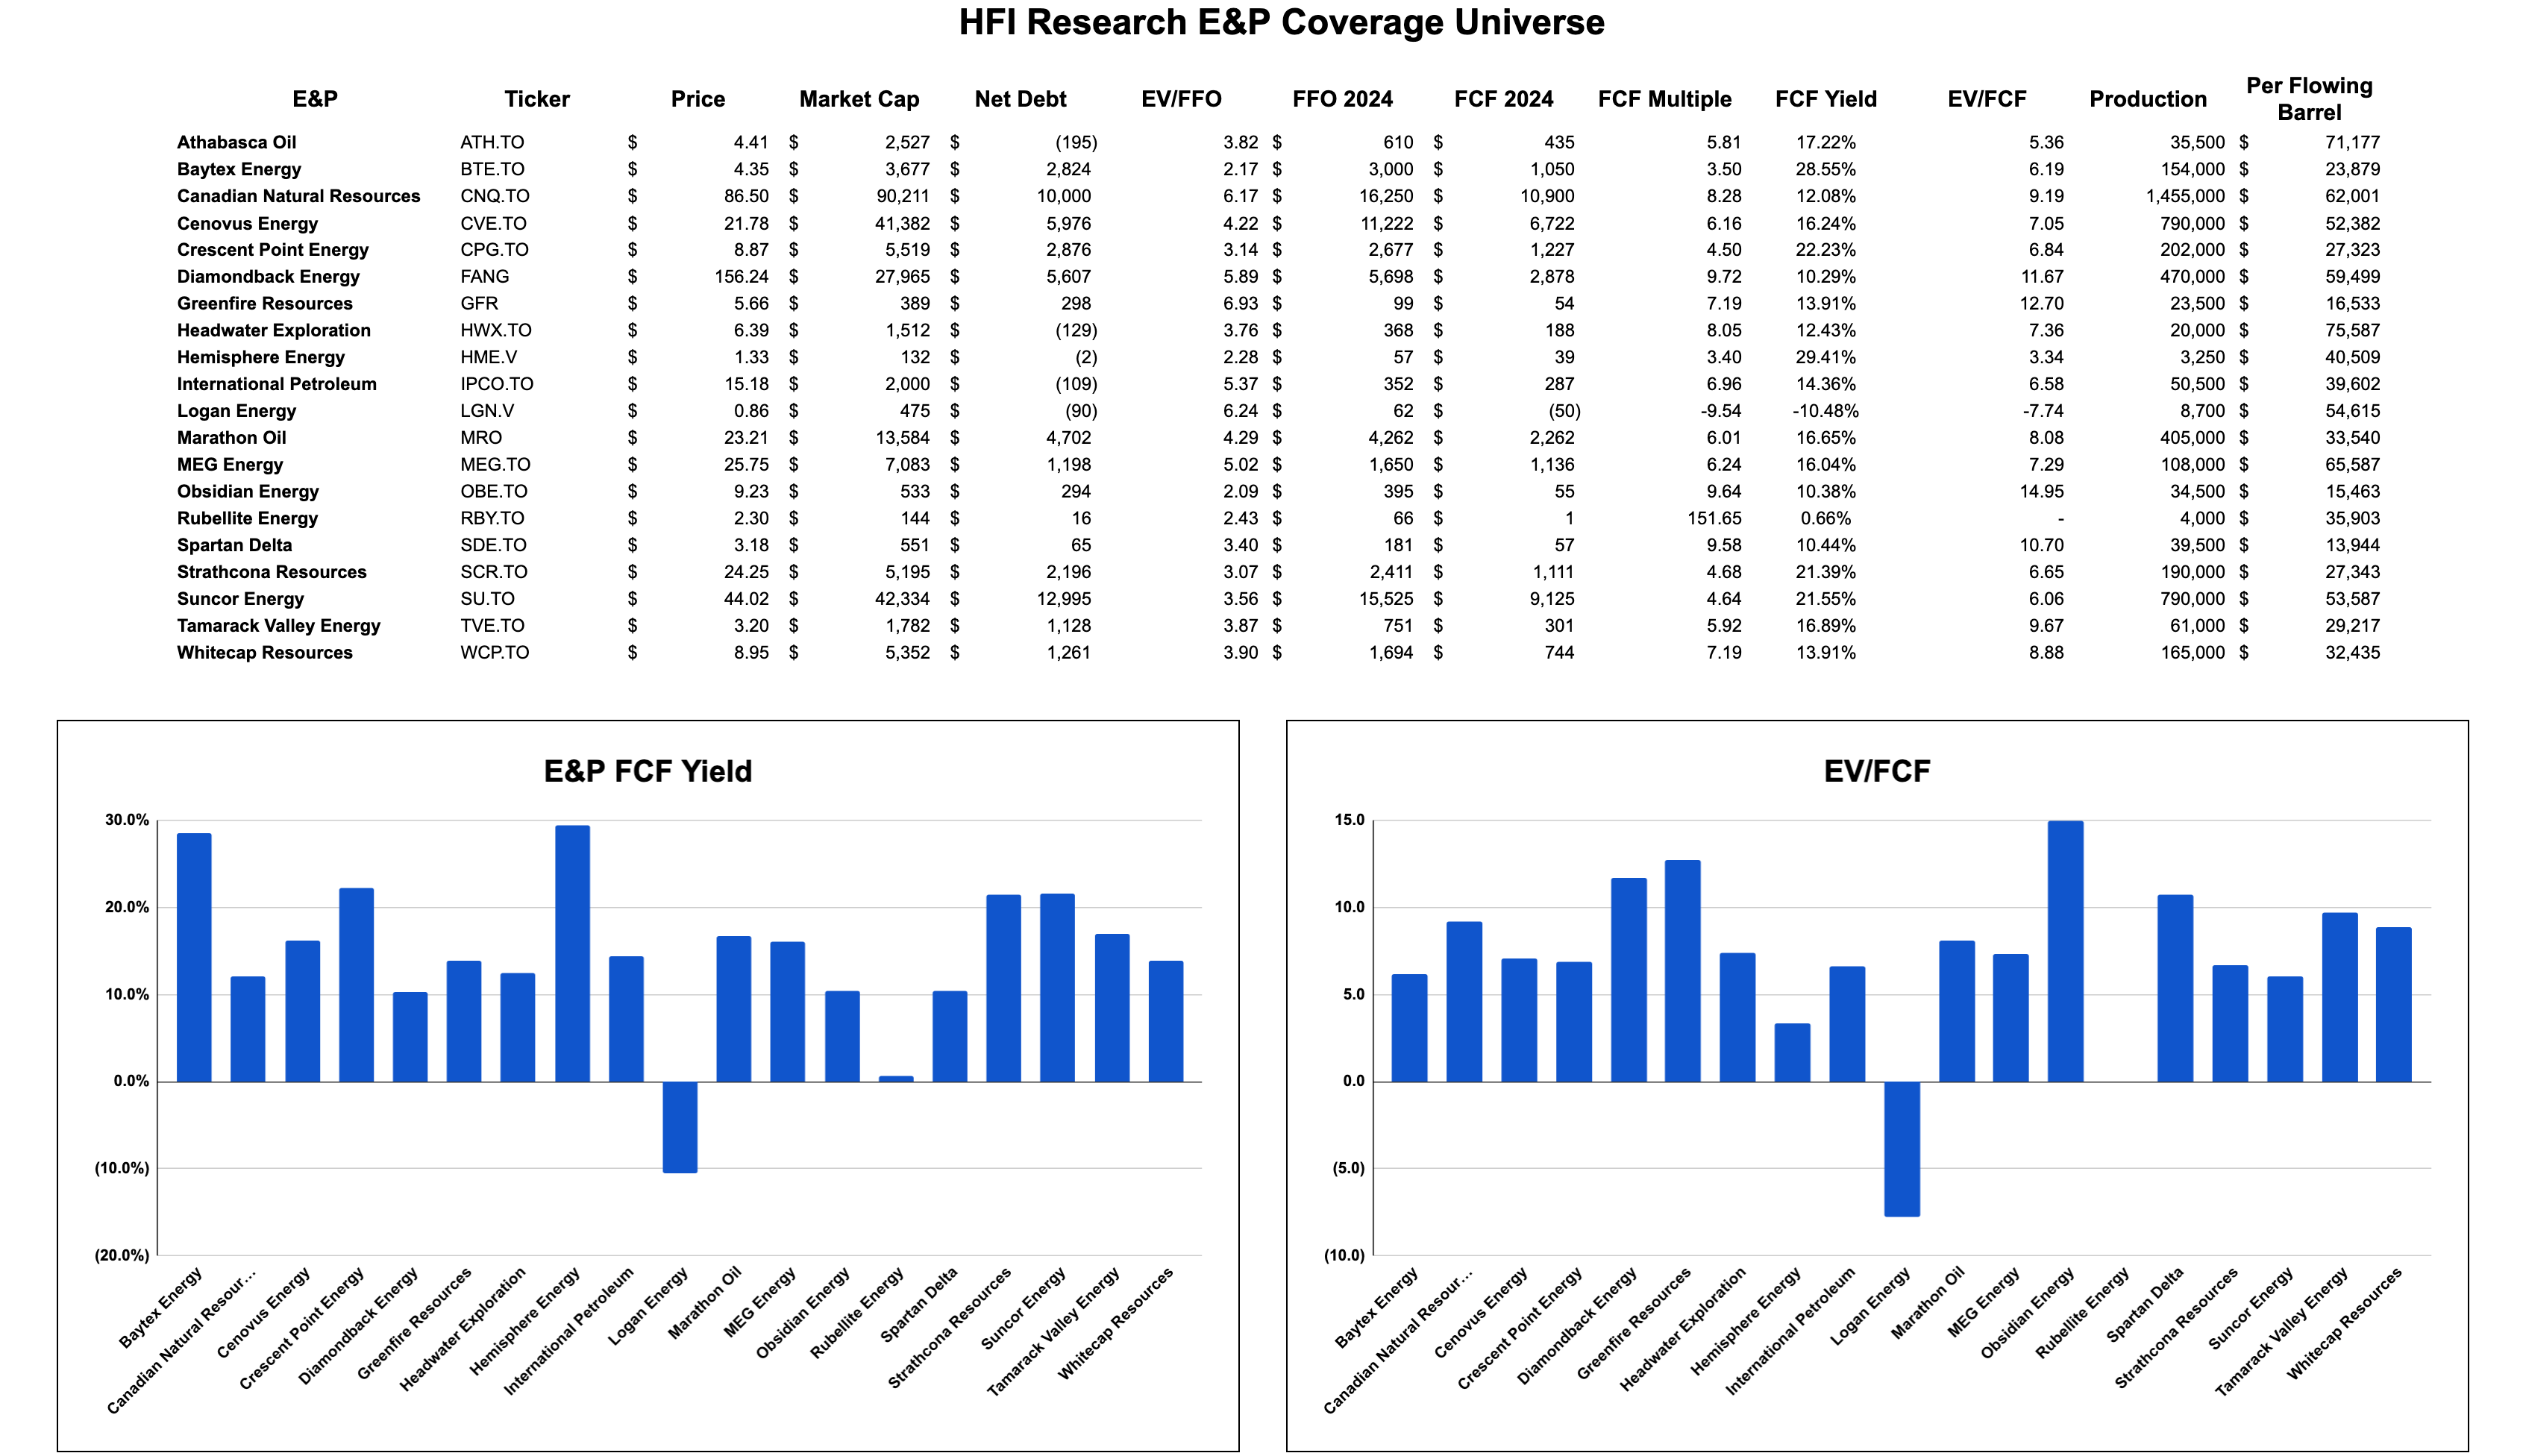
This sheet offers subscribers a quick glance at relative valuations. Stock prices update automatically, so valuations based on expected 2024 cash flow will adjust immediately. Only the financial statement data remains static, but we’ll update it as results are released.
The data show that E&Ps are currently trading at an average 14% free cash flow yield. Yields range from negative 10% for Logan Energy (LGN:CA) to 29% for Hemisphere Energy (HME:CA). EV/FCF ratios average 7.6-times and range from negative 7.7-times for Logan Energy to 14.9-times for Obsidian Energy (OBE:CA).
Investors should be aware of the limitations of the spreadsheet’s data. They capture a quantitative profile of each company but neglect the all-important qualitative factors that should be a part of any security selection. We refer subscribers to our company write-ups for qualitative detail.
