

Winter weather trading in natural gas is not for everyone. For anyone reading our articles, please be sure to check the chat for real-time updates on the ECMWF-EPS weather model. This is the European ensemble model that’s nicknamed “King Euro,” and it’s the only model that meaningfully moves natural gas prices in either direction.
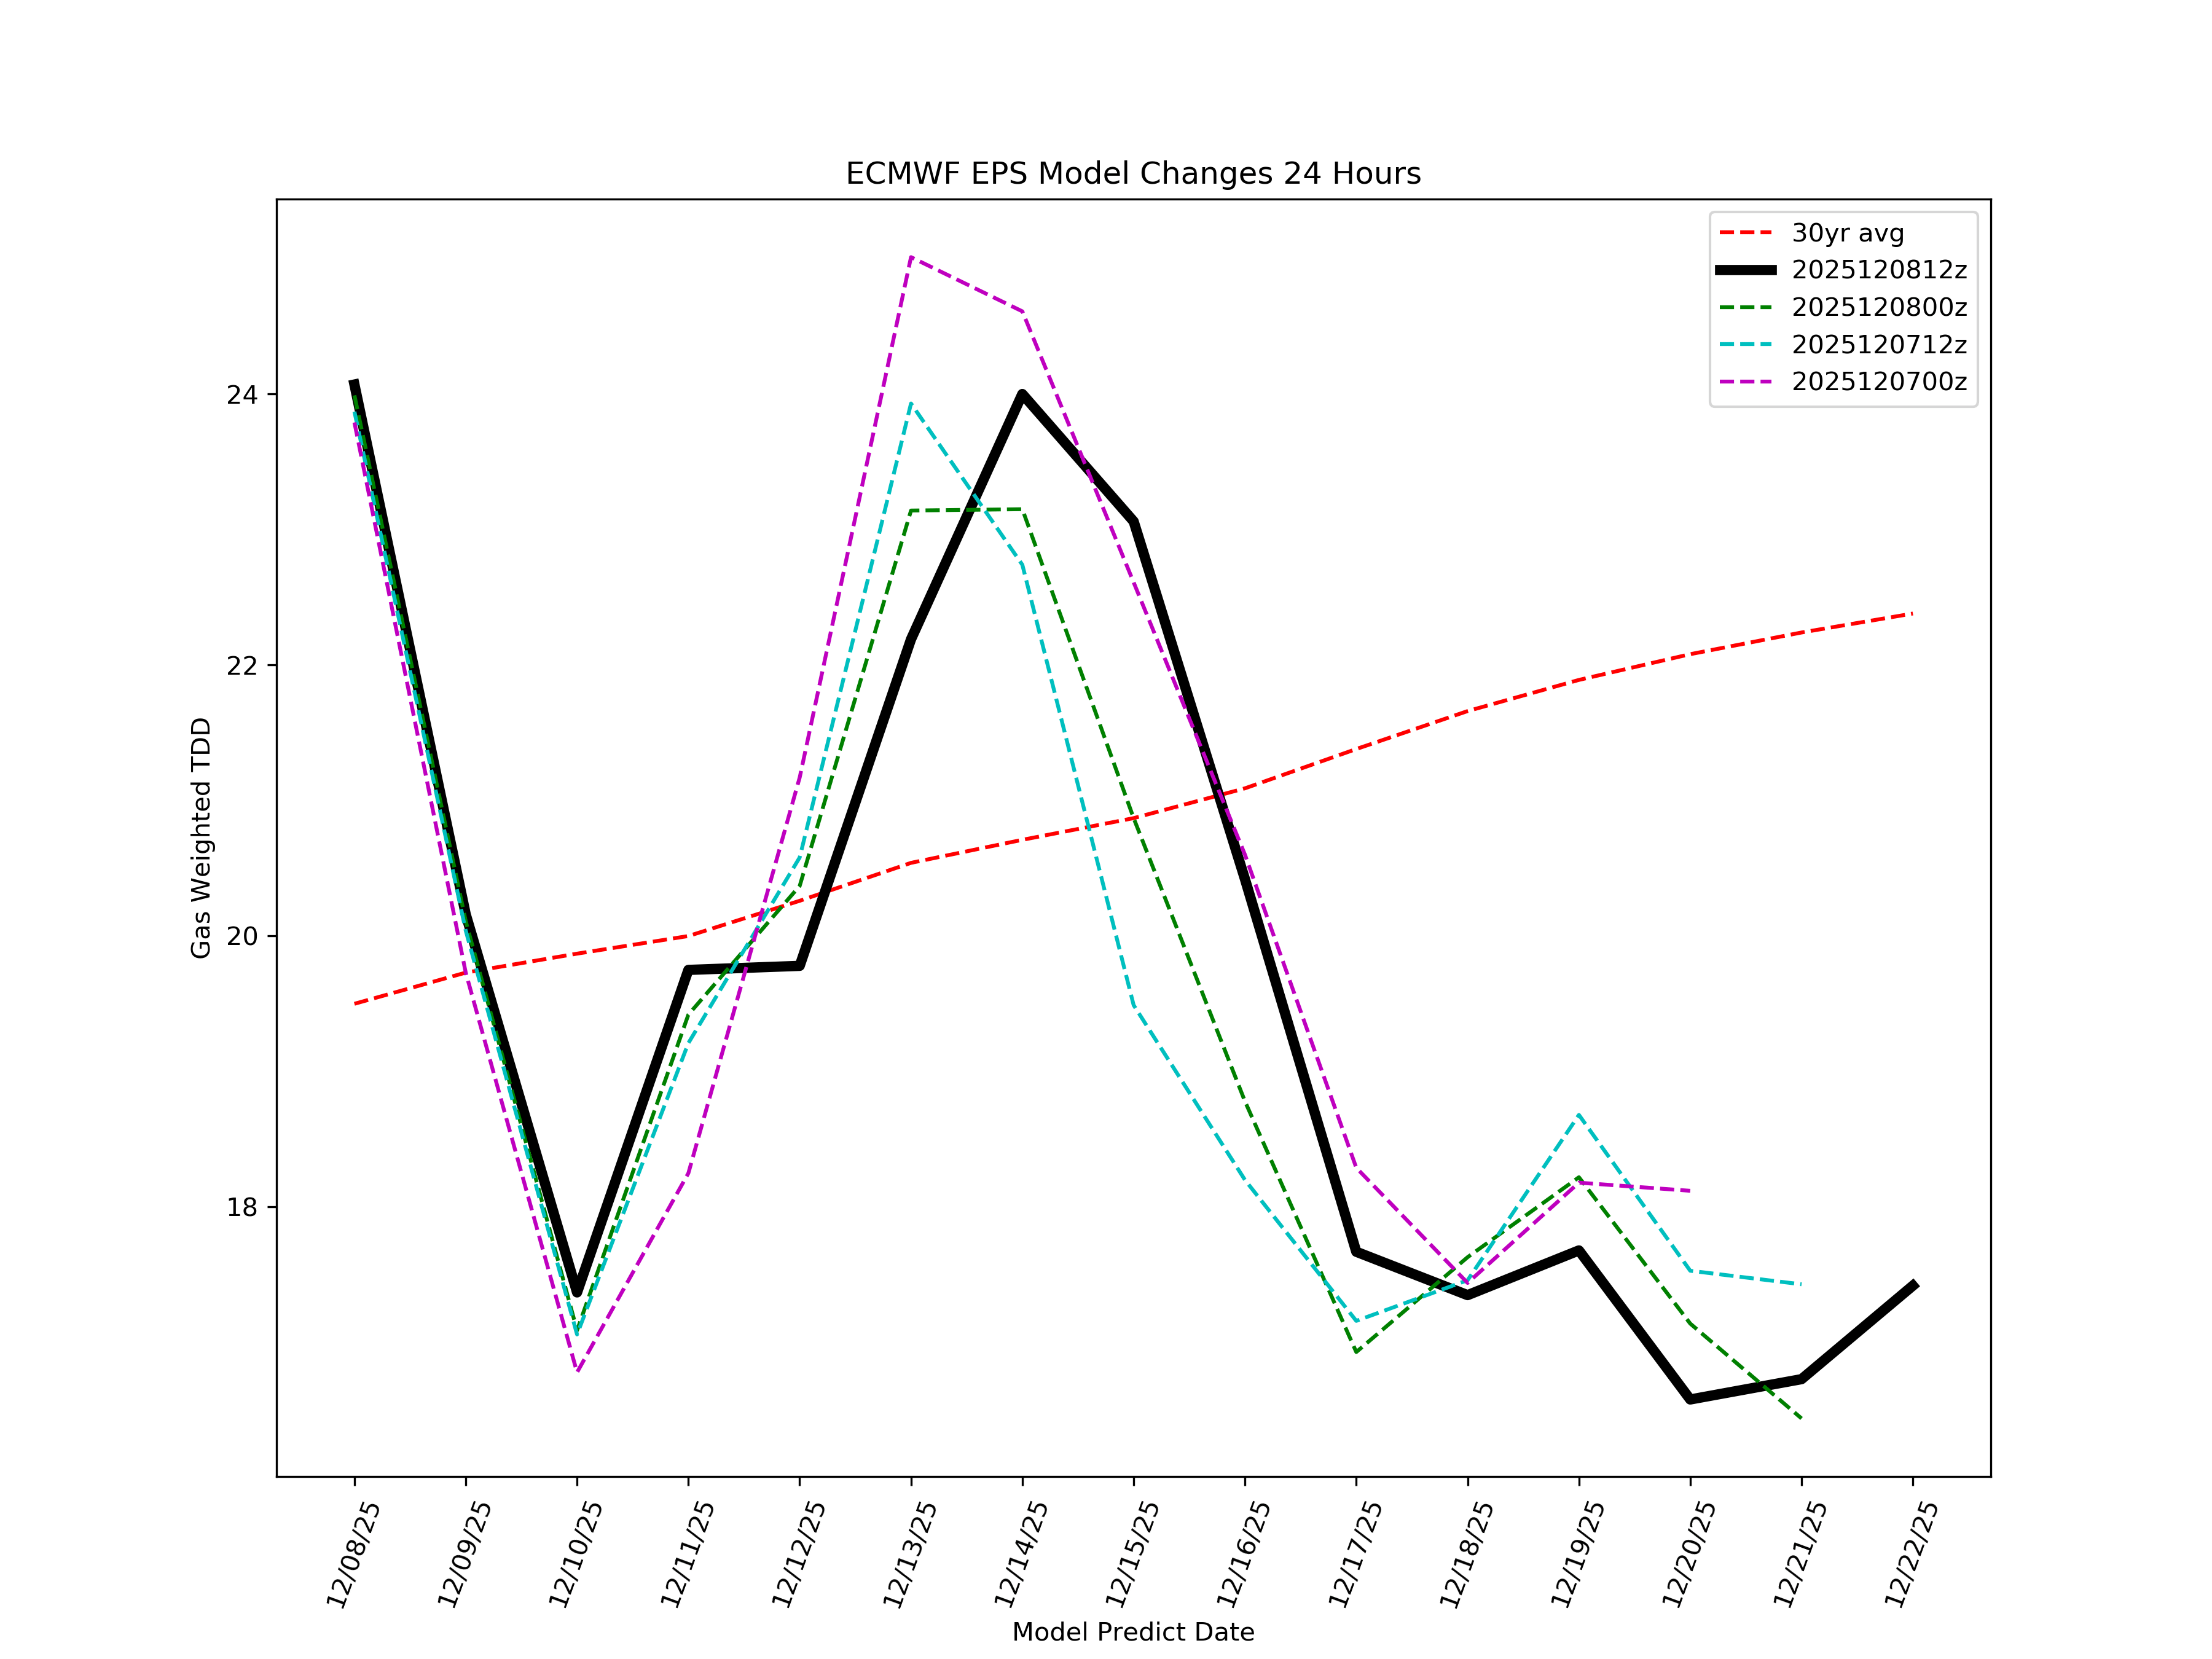
Over the weekend, ECMWF-EPS started off with an insanely bullish update showing TDD changes upwards of +16. It was then followed up with multiple bearish revisions with the 10-15 day now projected to be warmer-than-normal.
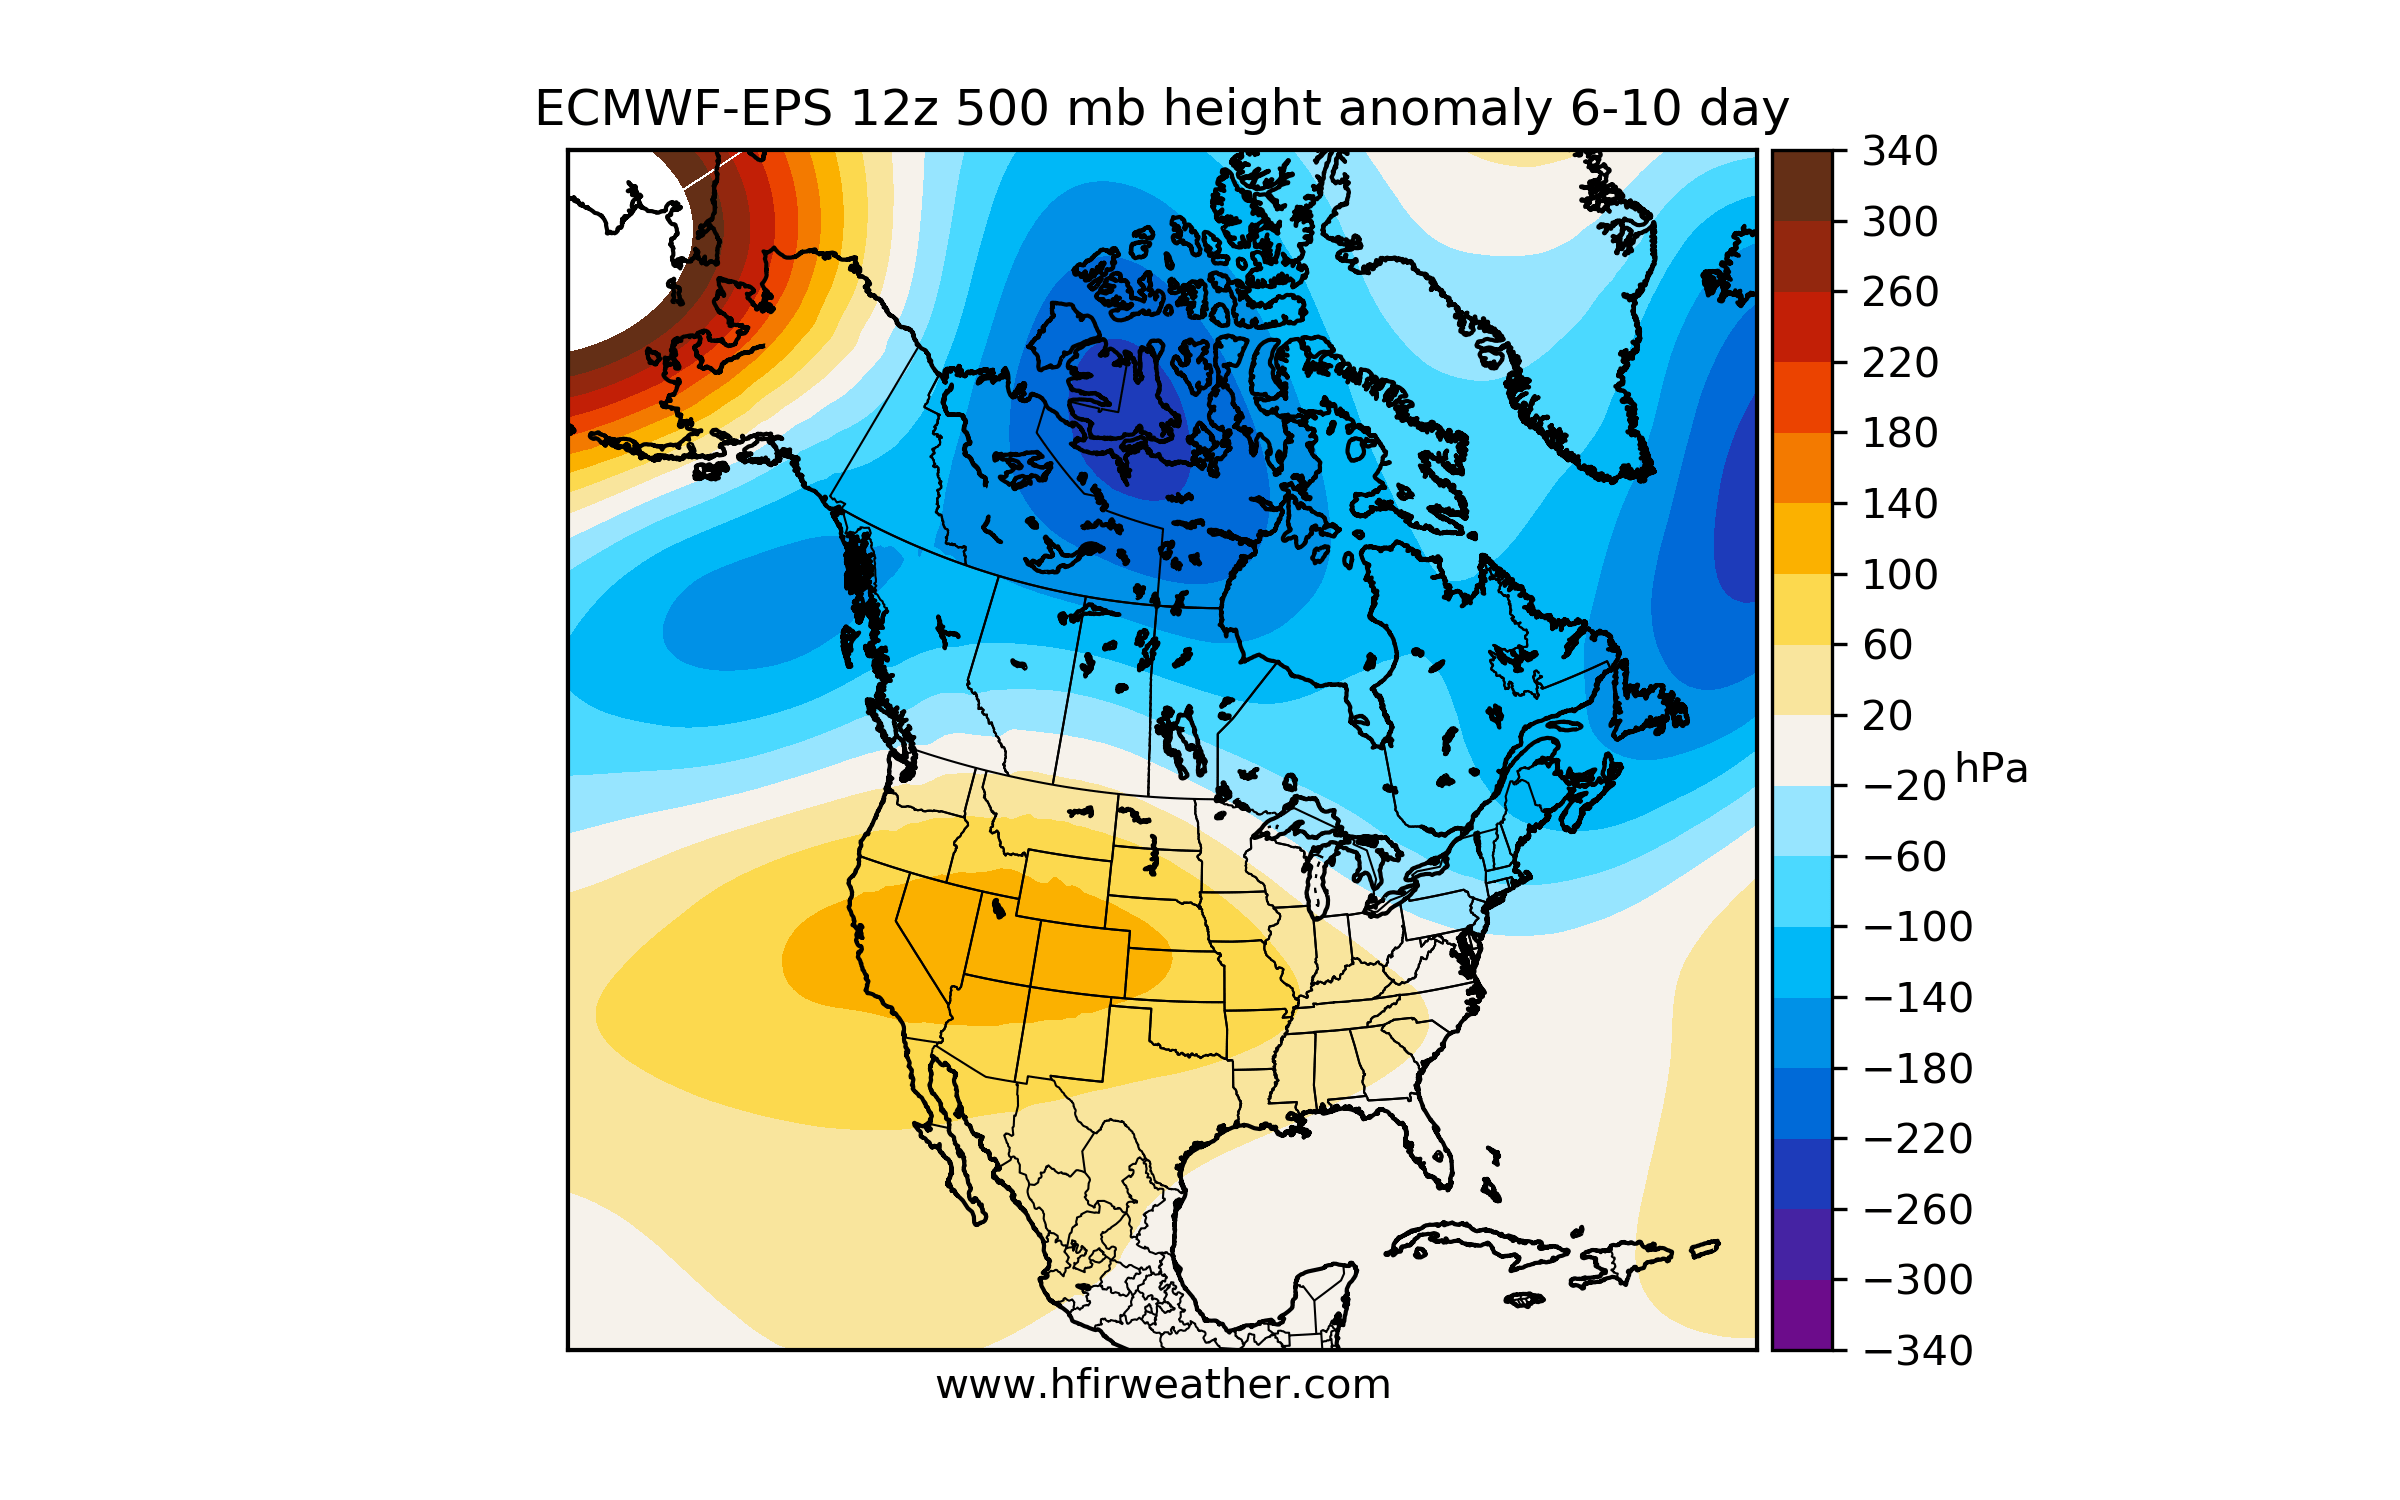
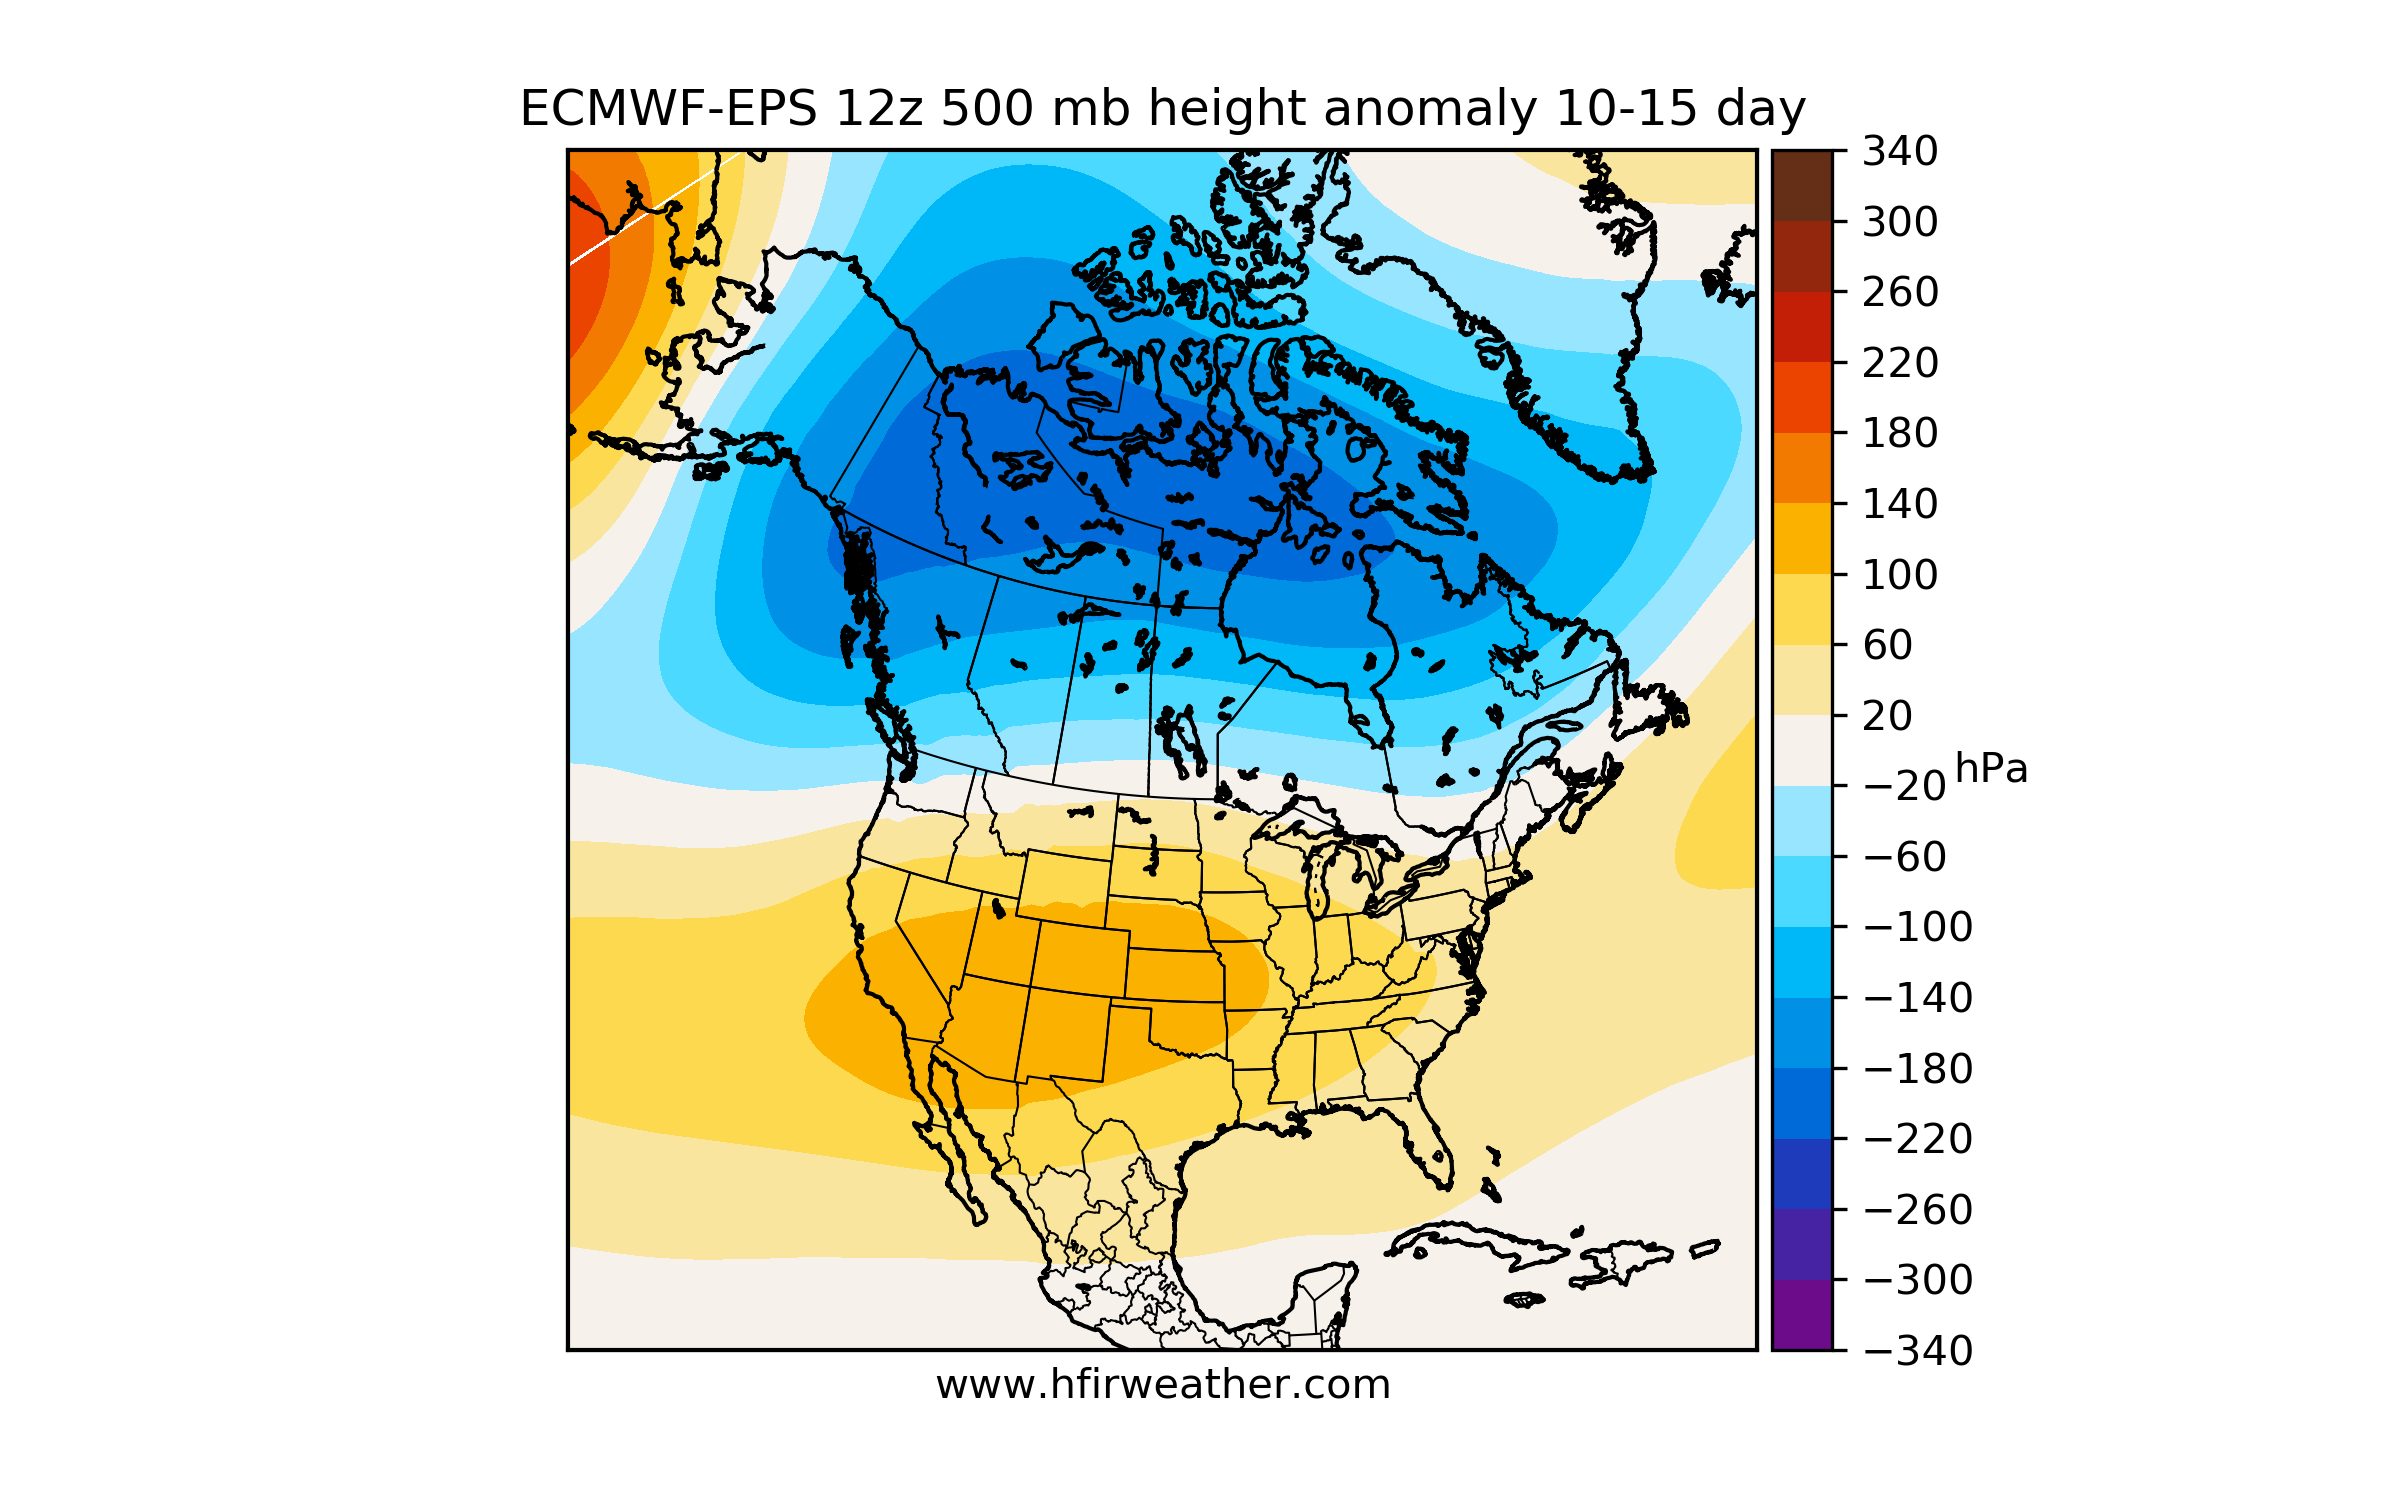
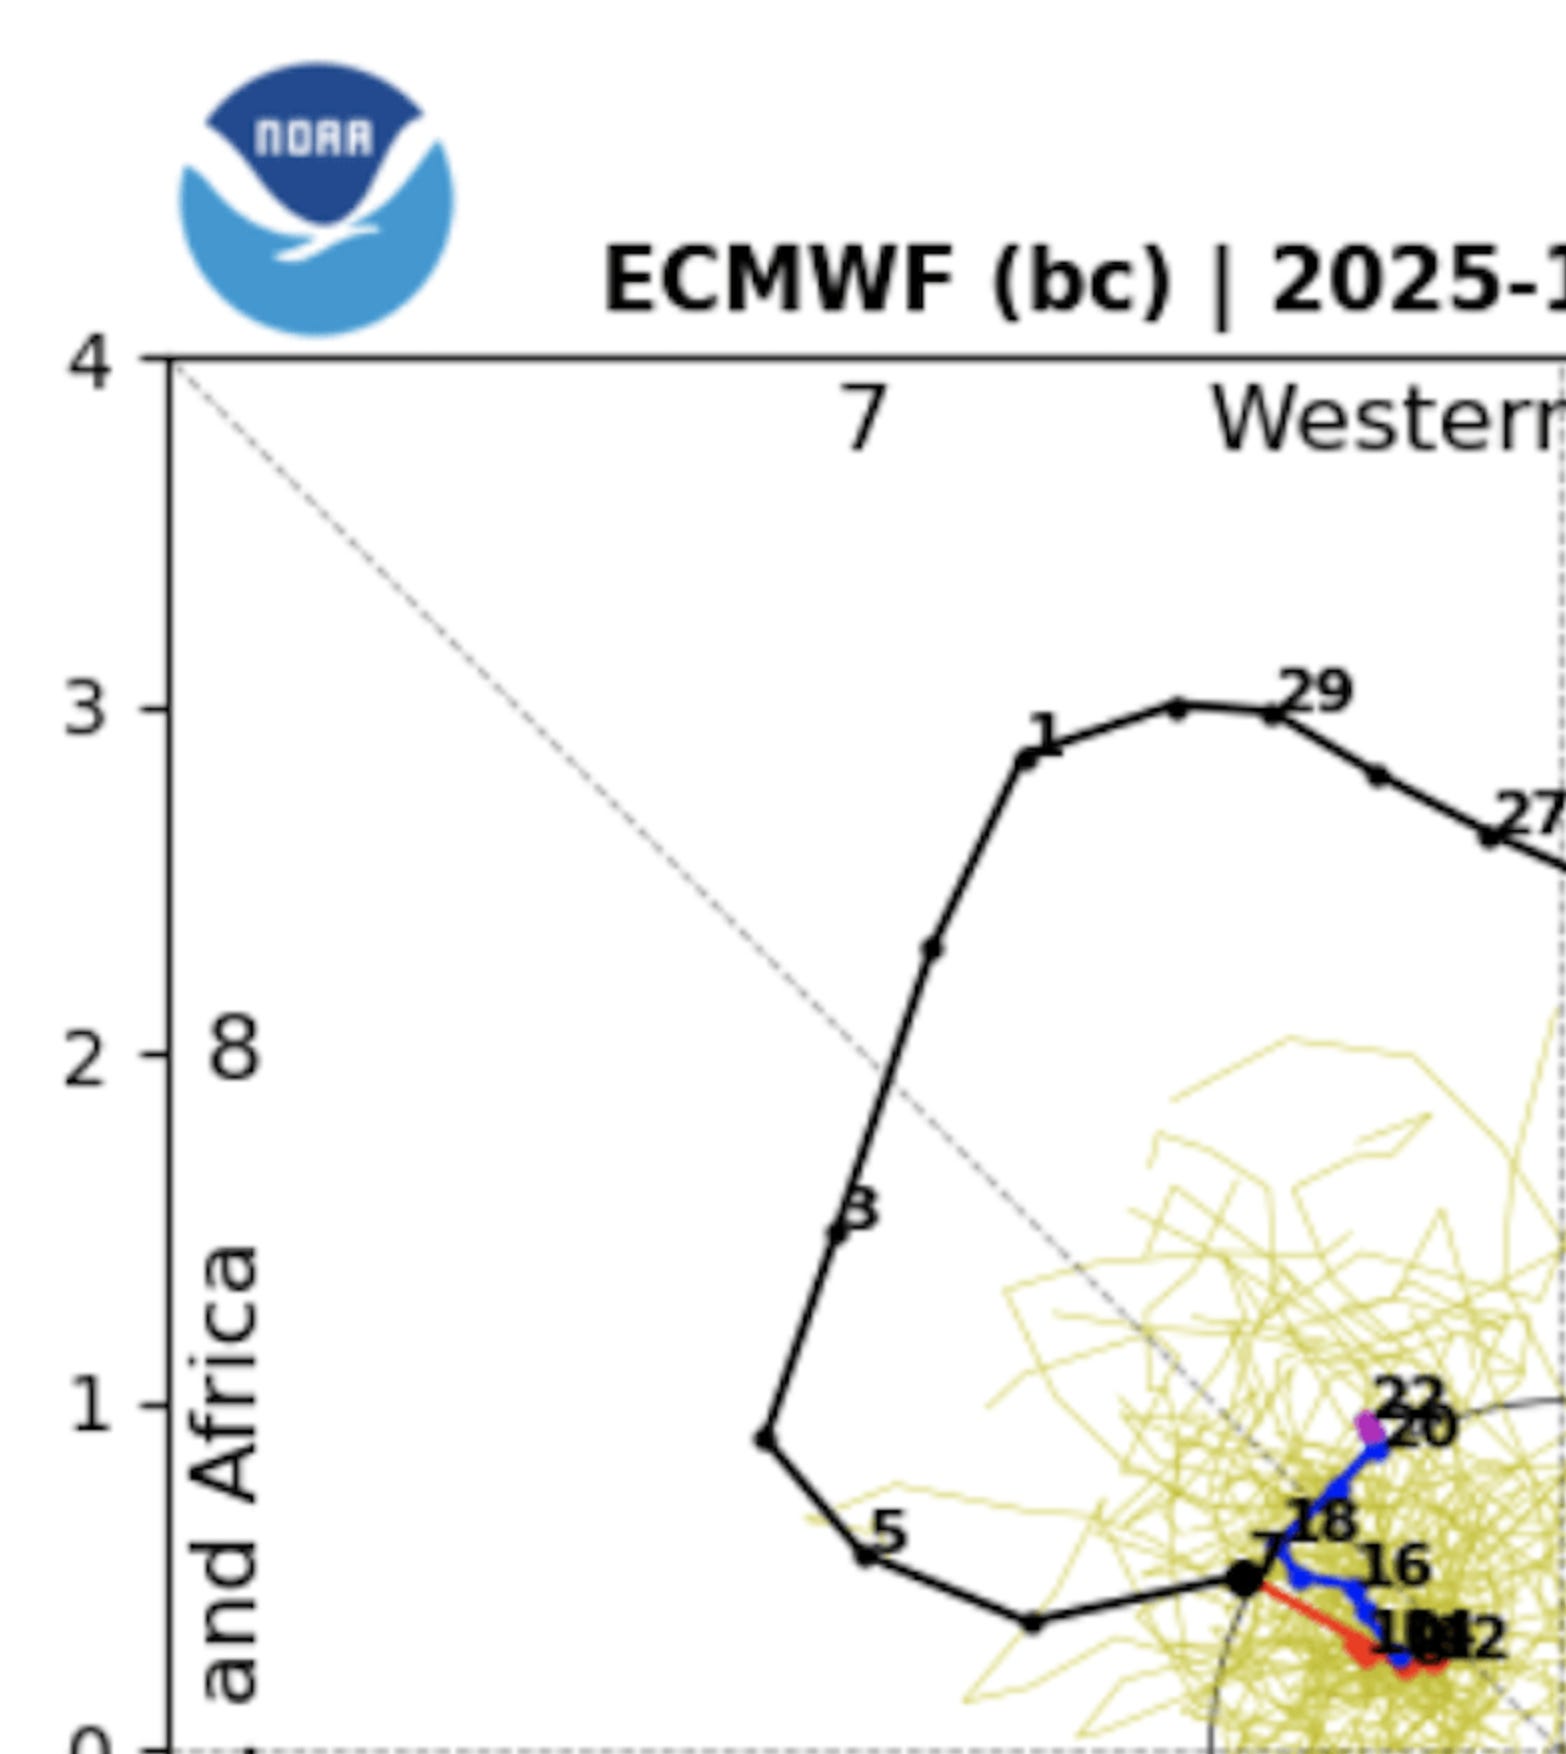
Here’s the latest ECMWF-EPS update:
6-10 Day
10-15 Day
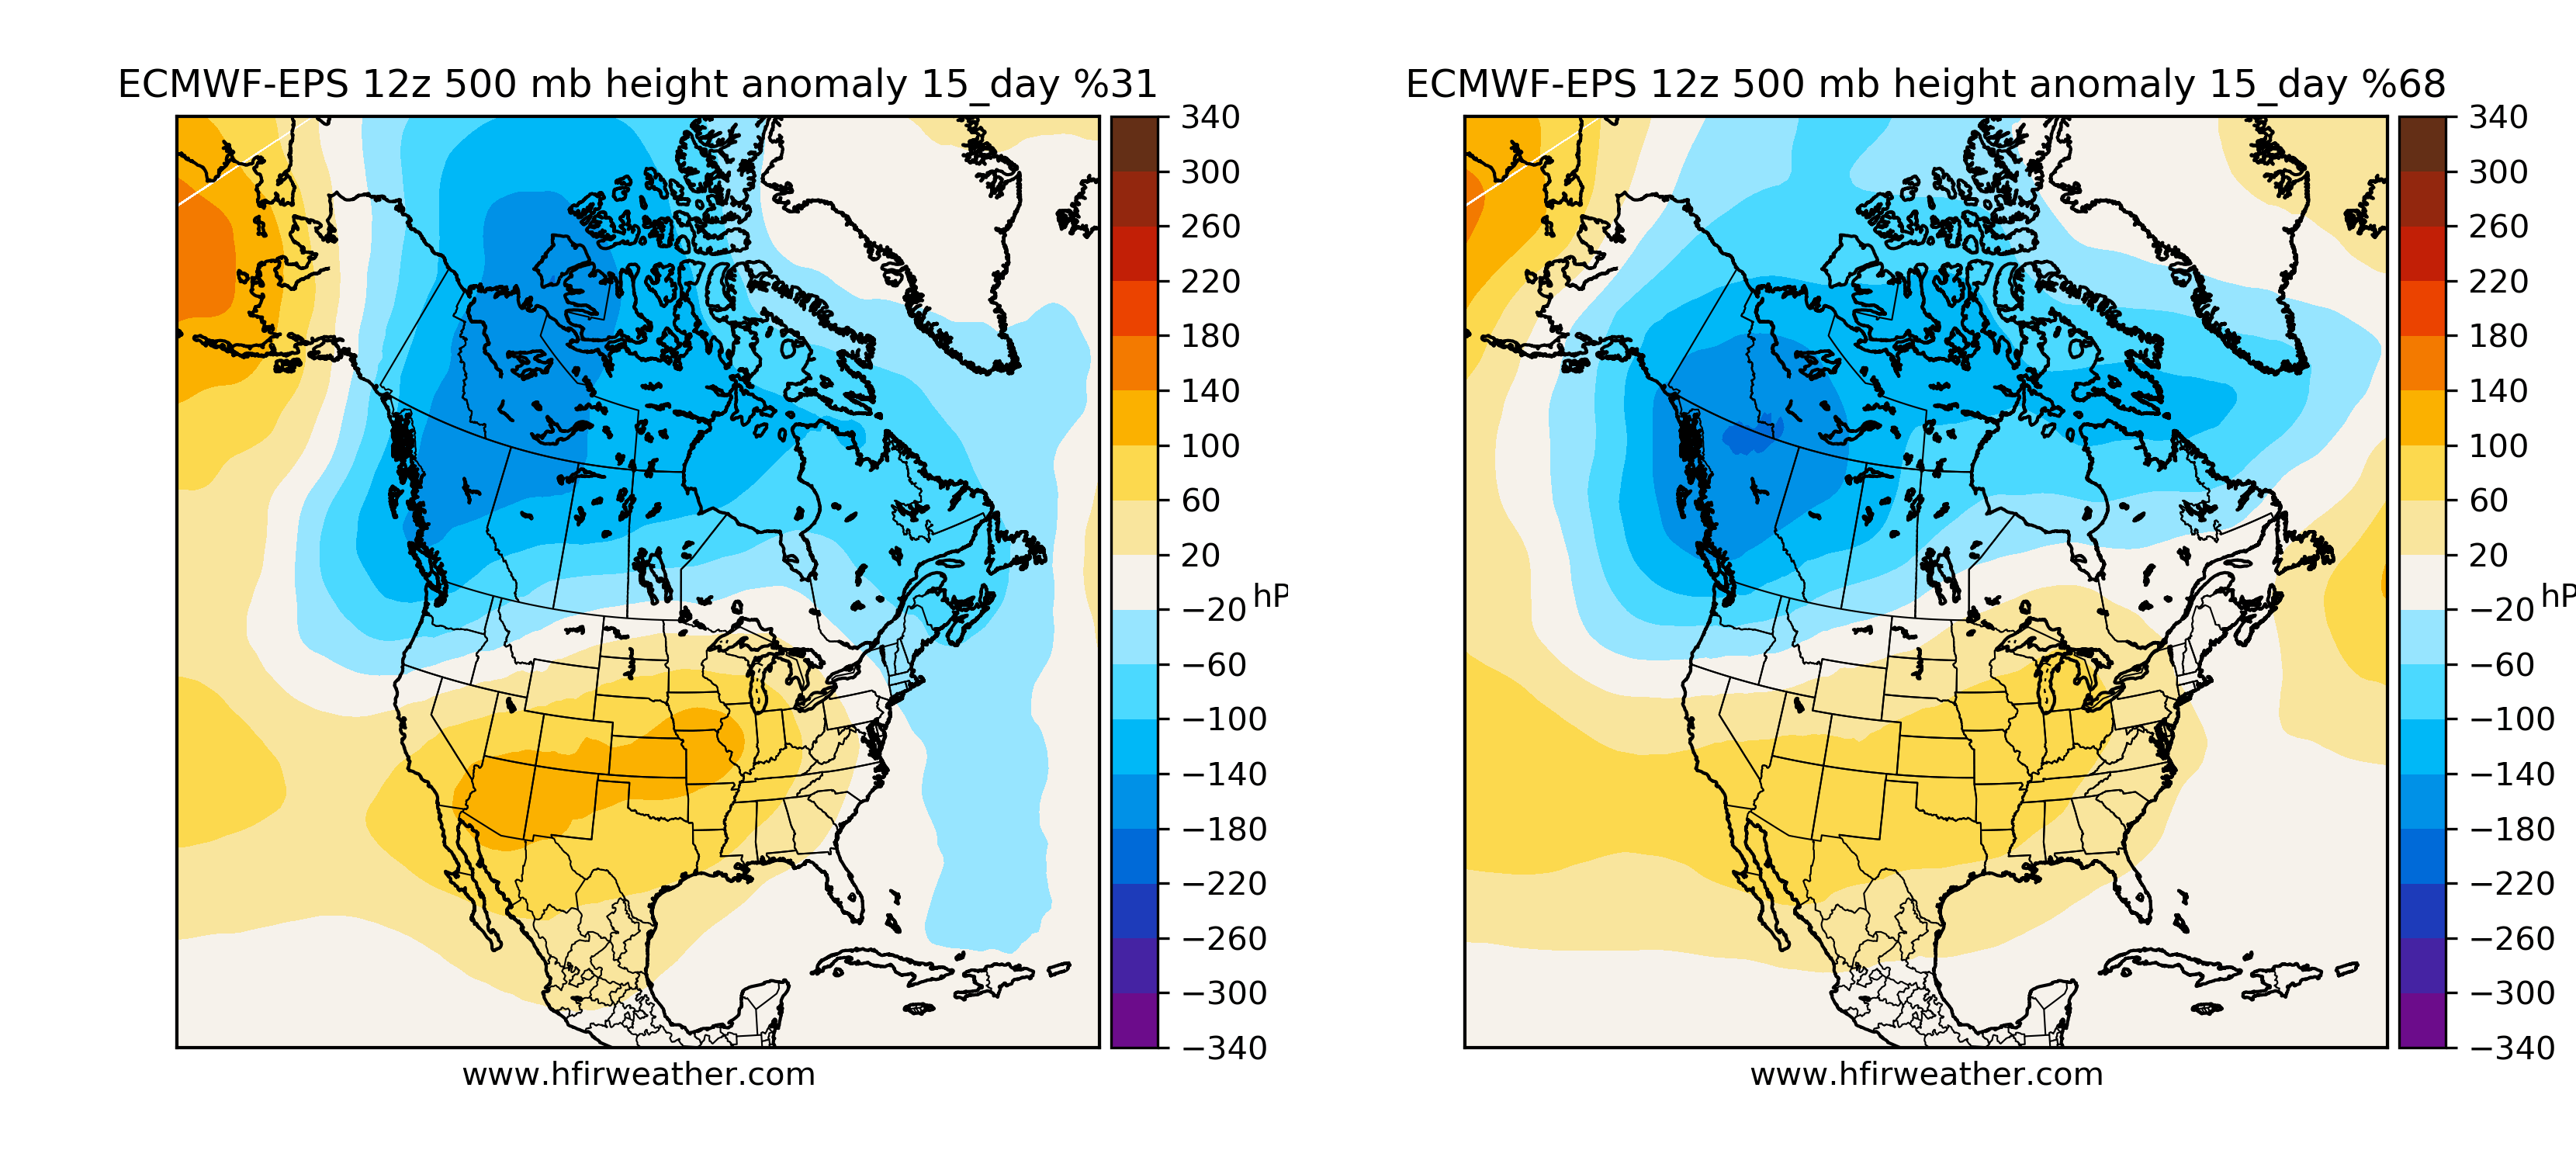
15-Day Cluster
As you can see in the weather charts above, the 10-15 day range shows the disappearance of the “Alaska Ridge”. The technical term for this is called the Eastern Pacific Oscillation (or EPO). This is one of the few teleconnection charts the natural gas traders pay attention to. When EPO turns negative, it means that the Alaska ridge is here and the weather is likely to lean bullish. When EPO turns positive, it means that the Alaska trough (blue pattern in Alaska) is here and the weather is likely to lean bearish.
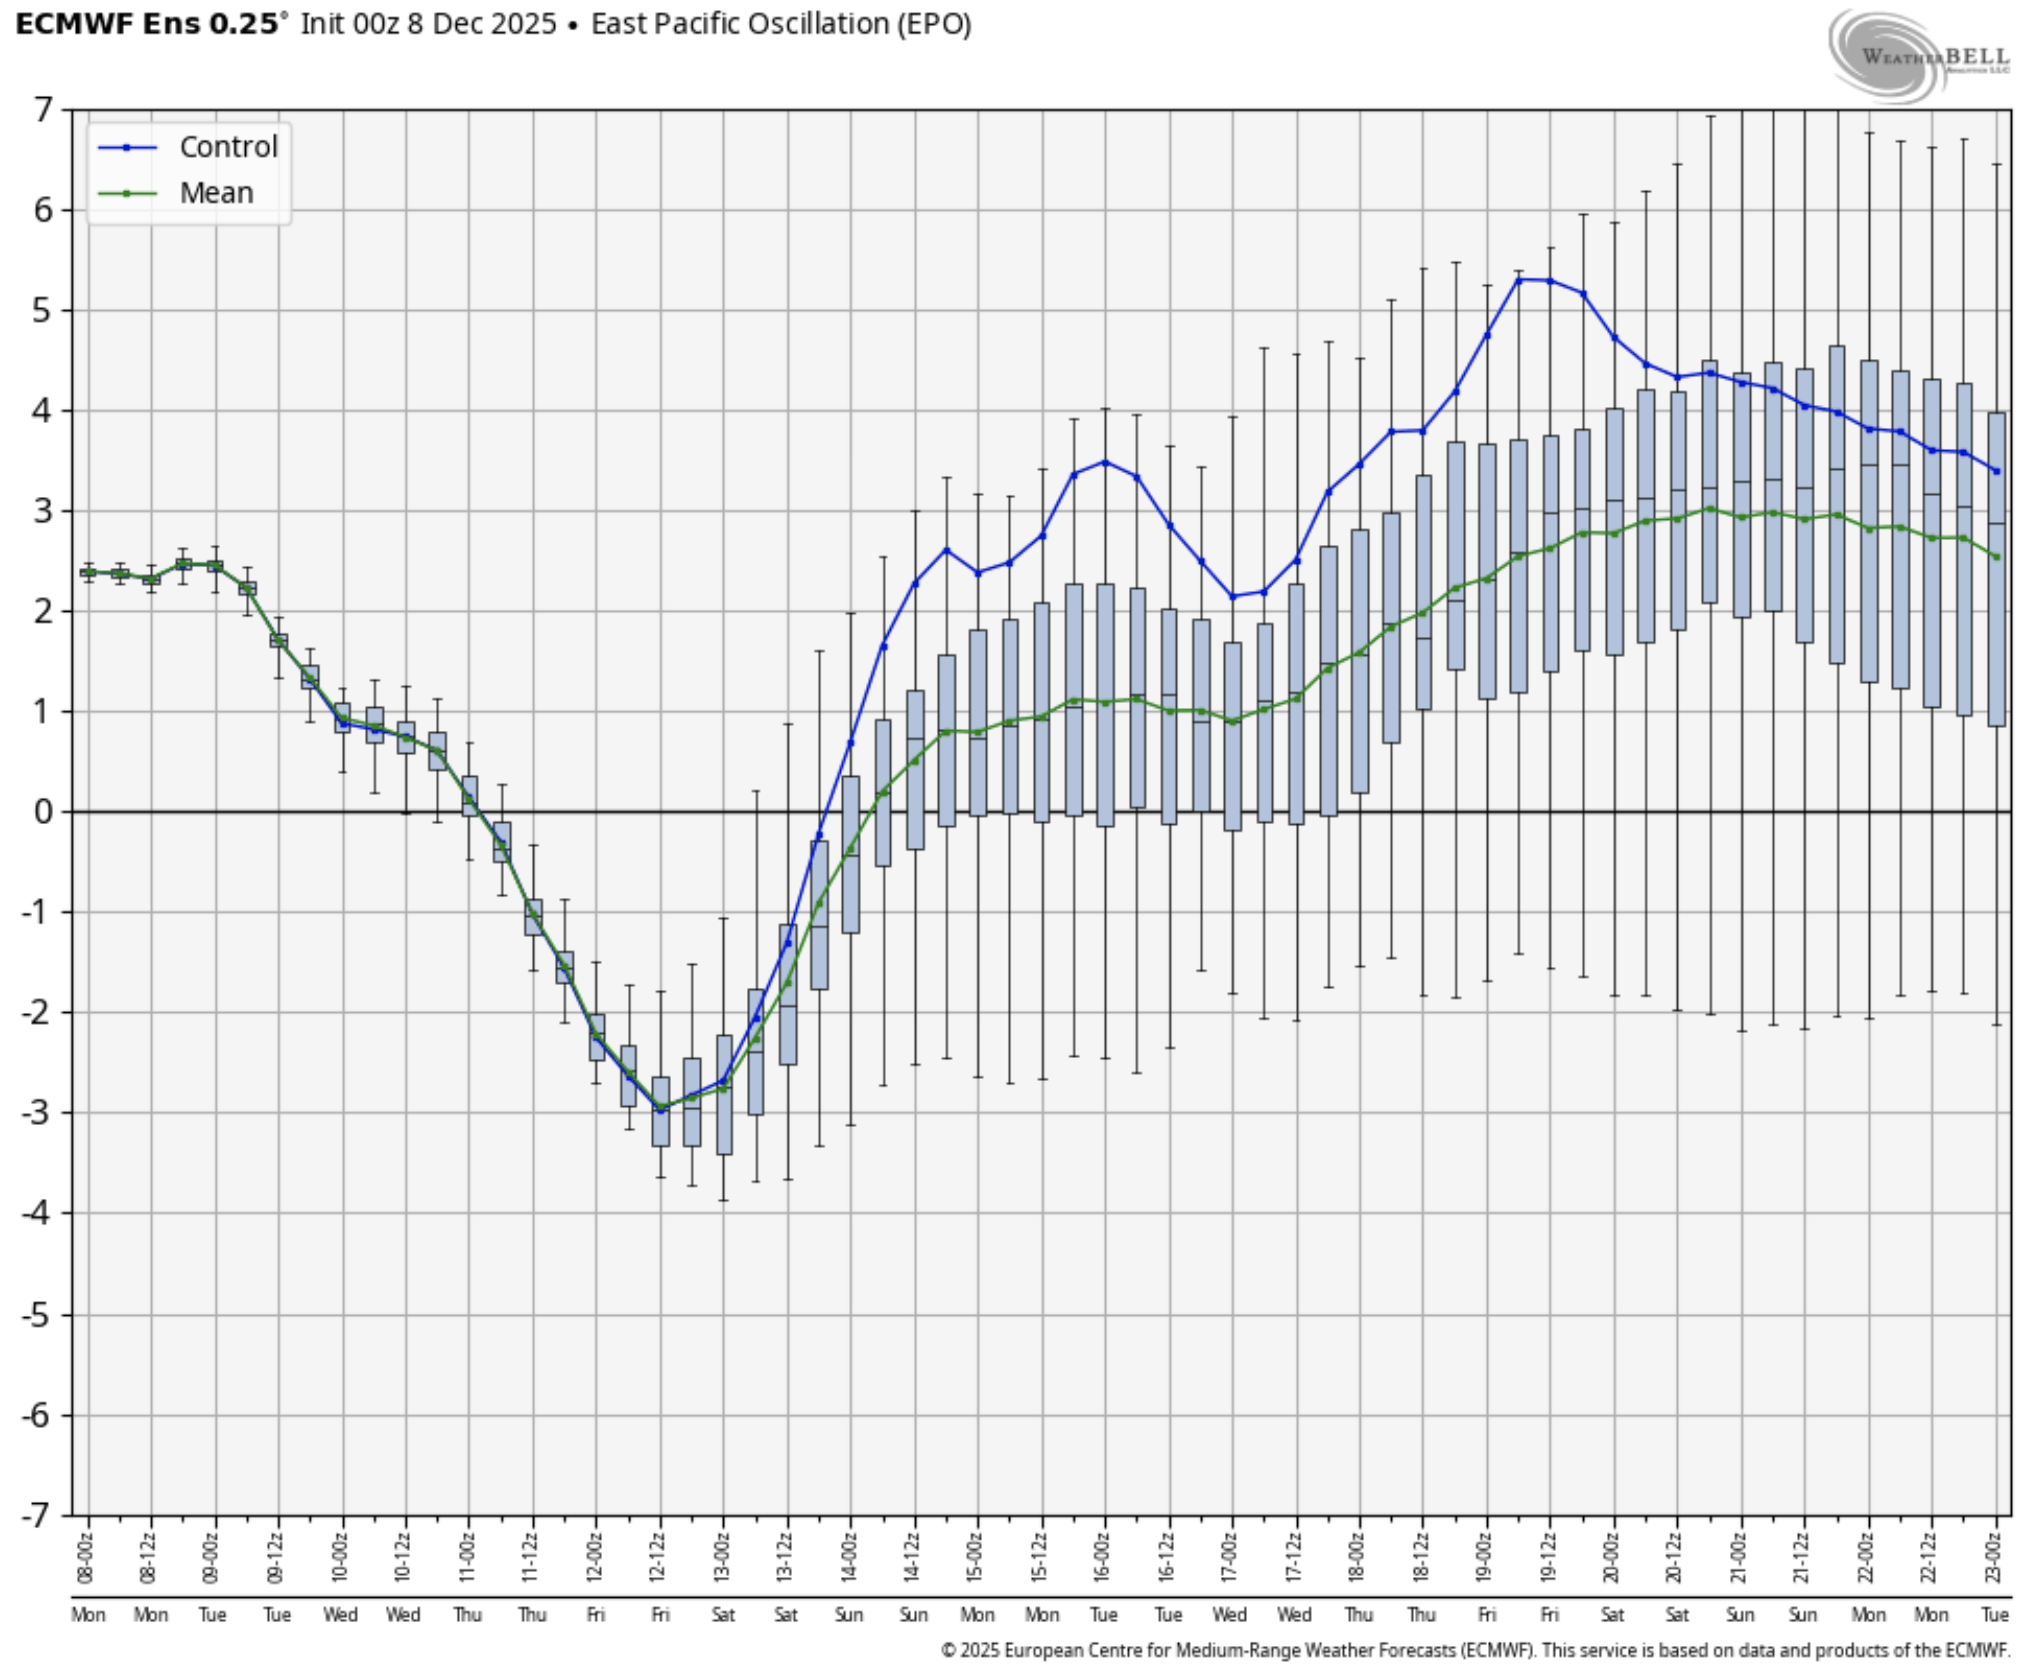
Source: Weatherbell.com
In the latest EPO teleconnection chart, you can see the -EPO pattern in the 6-10 day range, while the 10-15 day range flips to a positive pattern. The bar chart you see above is the range of forecasts from the 50 ensemble members in the ECMWF-EPS weather model.
For now, the ensemble members are projecting the return of an Alaska trough, which is ushering in bearish weather in the 10-15 day range. The bearish back-end of the model is precisely why natural gas prices are selling off.
Why aren’t prices selling off more?
The incoming weather pattern is extremely fickle. The smallest changes can lead to dramatic differences in the potential outcome. Take, for example, the Madden-Julia Oscillation or MJO forecast:
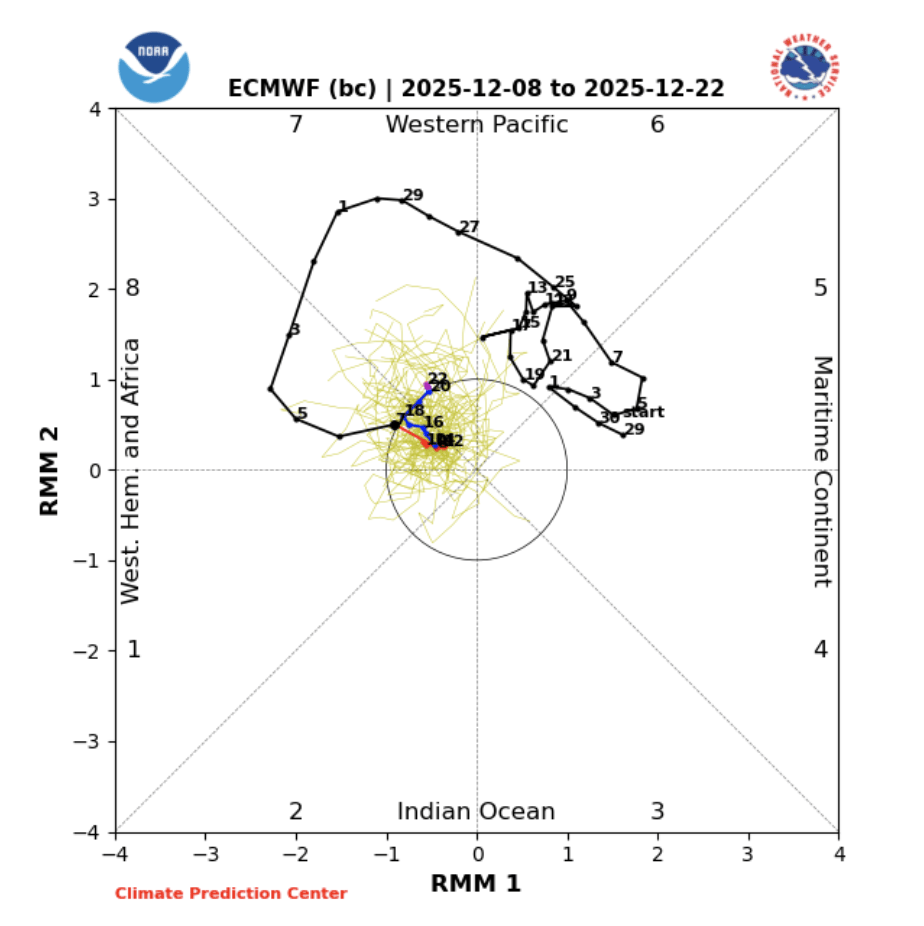
Source: Daculaweather.com (Explanation of MJO here)
Now I’m not going to get into the technical details of what MJO is, if you really want to pull your hair out, I suggest you read the explanation of MJO in the source link above.
For the purpose of simplifying life here, let me explain to you what that means for natural gas in broad terms.
In the chart above, you will notice: 1) yellow lines, 2) small numbers, and 3) blue and red line. The numbers represent the “calendar” days. For example, today is Dec 8, and tomorrow is Dec 9, etc. You can see by what date the pattern moves to what “phase”. Now you will notice that the MJO is forecasted to 12-22-2025, and the current projection for Dec 22 is in phase 7 (the boxes are labeled).
Historically speaking, MJO phase 7 equated to a bearish weather setup for December, January, and February.
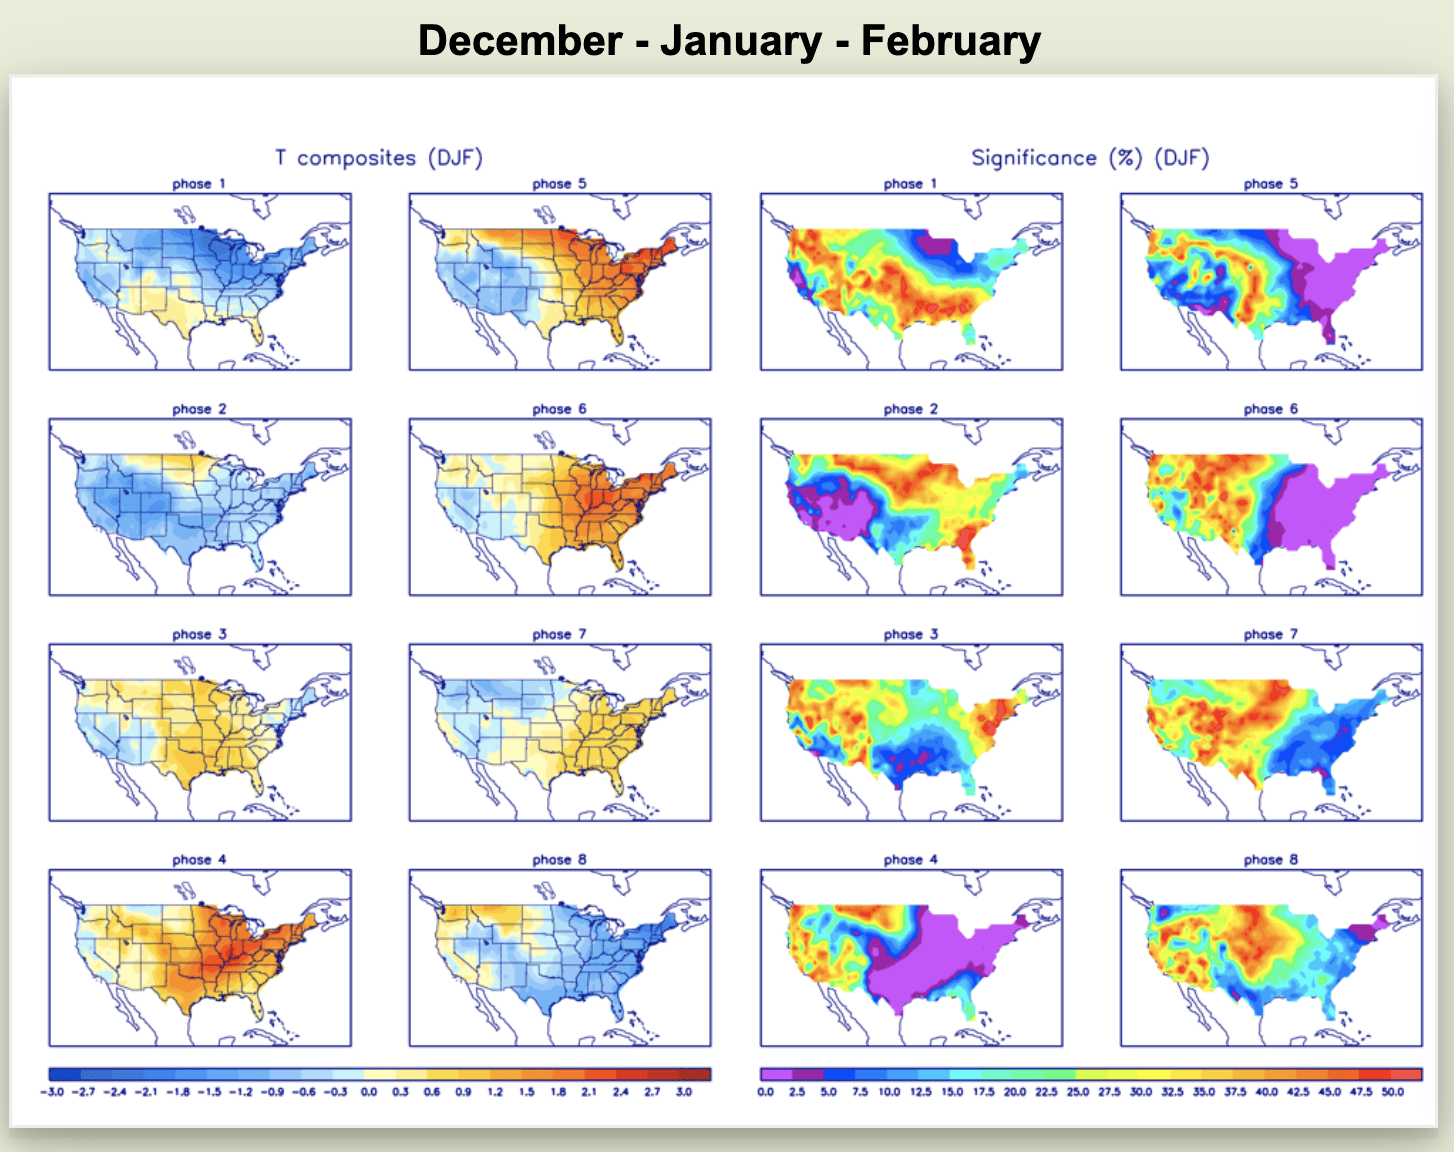
While a phase 8 setup is very bullish, here’s a zoomed-in chart of the two phases:
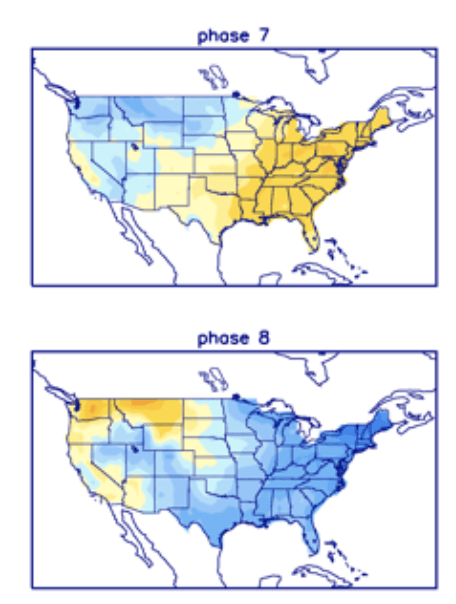
And here’s a zoomed-in chart of the MJO:
So yes, the difference is extremely sensitive here. On one end, if MJO just shifts slightly to phase 8, the odds of a very bullish weather pattern increase, while on the other hand, if MJO stays in phase 7, the pattern is bearish.
This insanity of a weather pattern change is precisely why weather forecasting is so difficult.