“It's tough to make predictions, especially about the future.” ~ Yogi Berra
Color me a skeptic, but there are some wildly insane figures being thrown out on US power burn demand forecast from now to 2030. The delta is so extreme that you can't even fathom the figures being thrown around.
But before we dive into the topic at hand, let's look quickly at the near-term natural gas market fundamentals. The entire curve is falling today on the back of the continuously weak cash market and bloated natural gas storage. Injection season so far is not coming in tighter than expected, which is prompting traders to rethink the steepness of the contango. We have always believed that Summer gas prices are currently too expensive and if we are to take a long position in natural gas, we would want to do that around $2/MMBtu for July contracts. With prices still trading at $2.293/MMBtu, we think it's just not quite there yet.
Looking at our natural gas market signals, the supply side is improving with Lower 48 production averaging just under ~100 Bcf/d. But with shoulder season upon us, total gas demand will be weak, especially considering LNG gas exports are down y-o-y.
As a result, despite the lower production volumes we are seeing, the US gas market is only slightly in deficit.
And while our storage injection projections have improved, it's not enough to push prices meaningfully higher.
Storage Outlook
With no demand catalyst in sight and production already low, the natural gas market is healing albeit at a turtle pace. The current implied deficit is not enough to eliminate the surplus in storage, so the market is going to force balance via even lower prices or by keeping prices at these levels for the remainder of the shoulder season.
Either way, readers should not expect any meaningful increase in natural gas prices in the near term.
Hilariously hilarious... Natural gas producers jump on the AI bandwagon
Given the bearish backdrop in natural gas fundamentals near term, it was that much funnier when I saw the power burn demand projections from EQT and Antero.
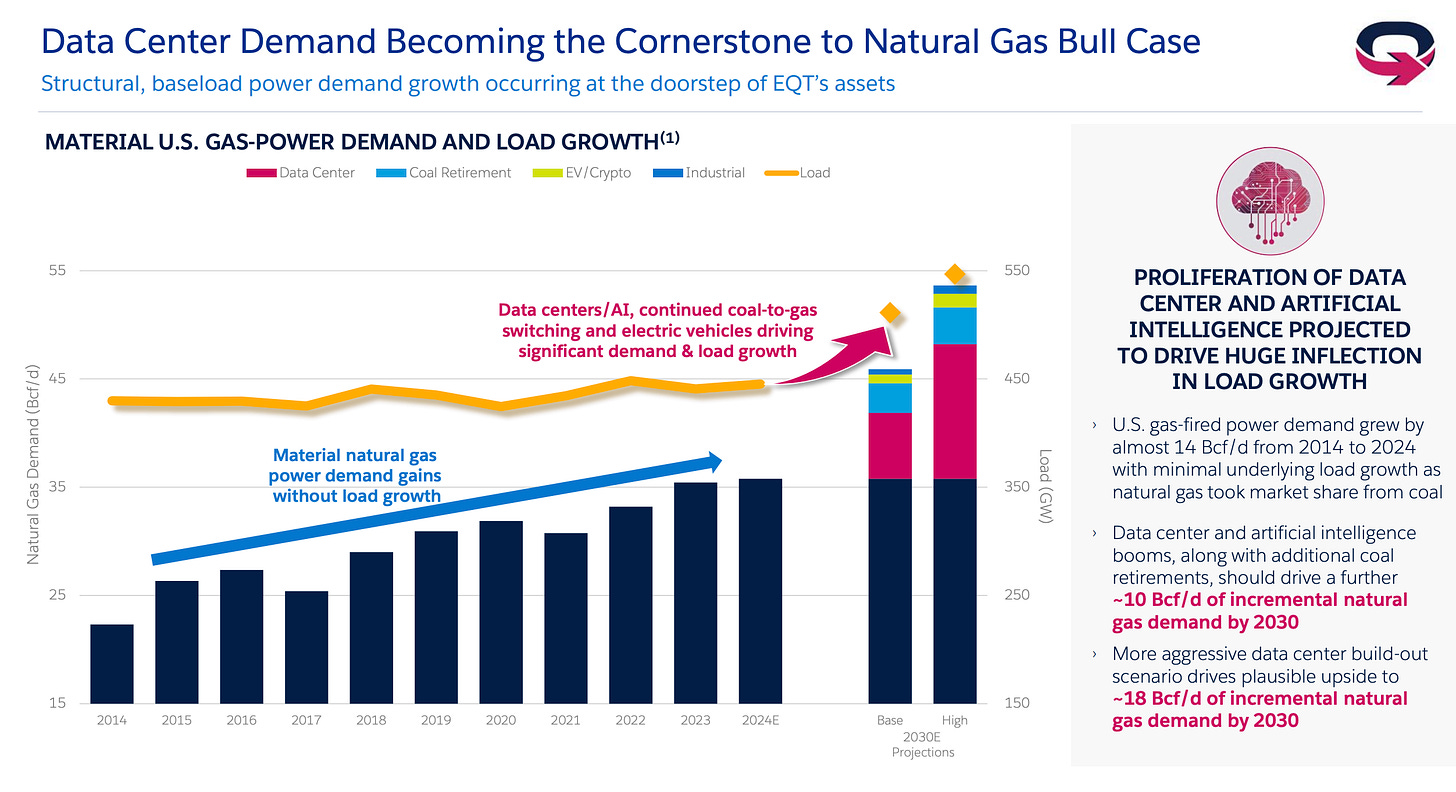
EQT is assuming power burn demand in the US to increase by 10 to 18 Bcf/d by 2030 thanks to higher AI data center demand.
For Antero, it is expecting +7.7 Bcf/d.
And for US natural gas exports, it is assuming a wild +22.7 Bcf/d.
Now how realistic are these assumptions?
IHS Markit just published its usual monthly natural gas market outlook and in it, it published this supply/demand chart.
Now what's remarkable about it is that if you look at the domestic demand assumption, IHS actually has power burn demand falling by ~6.6 Bcf/d due to renewables taking a larger share of the power burn.
My view is that IHS's view about power burn demand falling ~6.6 Bcf/d is about as unrealistic as the +7.7 Bcf/d or the +10 Bcf/d demand assumption from AR and EQT, respectively.
None of these forecasts look accurate, in my view, and a more realistic figure, assuming more renewable penetration, is closer to +2 to +3 Bcf/d by 2030.
But here's the real kicker in this analysis, if you flip IHS's domestic demand forecast from -6.6 Bcf/d to just 0 Bcf/d. All of a sudden the gap in demand growth jumps to +15.8 Bcf/d by 2028, while the supply side is expected to grow +7.3 Bcf/d.
Is the birth of a multi-year bull market in natural gas in the making?


