Largest Weekly US Crude Storage Draw On Record And More To Come
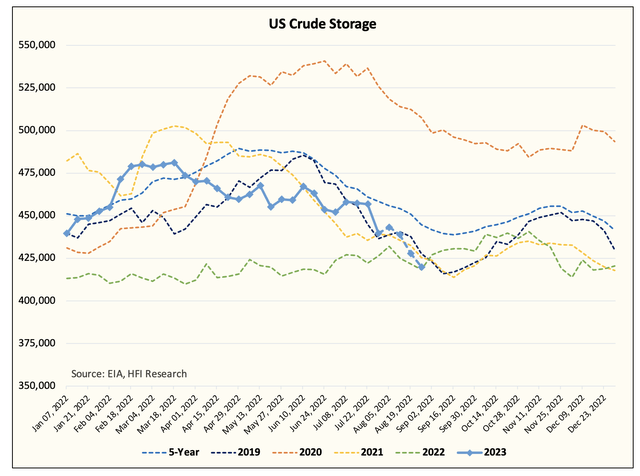
You may not know this from the price action in oil today, but EIA reported the largest weekly crude draw in history (-17 million bbls).
The drop also puts us in-line with 2019 and 2021 storage levels. For readers that follow us closely for the weekly crude storage forecasts, we want to give you a heads-up for next week.
Preliminary figures show a build as US crude exports drop and imports rebound.
This is not expected to be a trend. Looking at Kpler tanker traffic over the coming weeks, US crude exports are expected to remain elevated, while US crude imports remain low. This combined with flat US oil production is a recipe for much lower crude storage.
Our very early estimate shows US crude storage falling in line with 2022 by the end of August.
For readers, the conclusion to reach is that the crude draw is only beginning. Seasonally speaking, US crude storage draws into mid-September, so this is not a surprise to the market. But the magnitude of the draw will be a tailwind for the bulls.
For the Saudis, this is much needed in order to sustainably keep prices higher. We think the Saudis will keep the voluntary cut of ~1 million b/d into November to ensure that any demand downside surprise will be covered.
Now that we've covered the incoming US crude storage changes, let's move on to the positives and negatives in the report.
Negatives
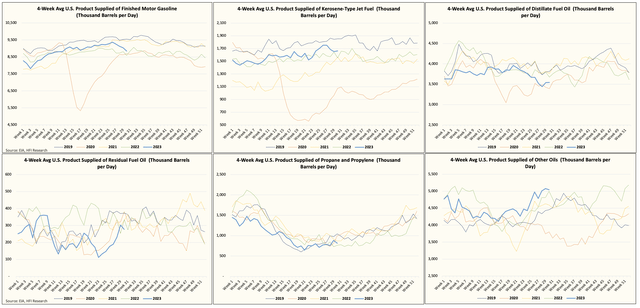
US oil demand is not recovering as we expected. In fact, it is now moving in the opposite direction of what we expected. While the weekly demand figures are by no means accurate of the bigger picture, the directionality has been a good indicator. As a result, it is unlikely that we see US oil demand reach an all-time high this summer.
Interestingly, gasoline demand, which was a key tailwind going into the summer, is now becoming a drag.
And if we overlap this with the monthly oil demand data, we can see that gasoline demand has not been as strong as we had hoped for.
Now for those of you that say that weekly oil demand is garbage, you have to realize that the monthly big 3 demand (gasoline, distillate, and jet fuel) have tracked closely with the directionality of the weekly figures.
The latest weakness in the big 3 is the result of weakness in gasoline and distillate. Labor Day usually marks the peak for US gasoline demand, so without an uptick in the following weeks, it is very likely we do not see further improvements in those demand figures.
As for total US oil demand, other oil has kept total demand elevated. For those wondering what other oil entails, EIA describes it as:
Natural gas plant liquids (NGPLs) and liquid refinery gases (LRGs) excluding propane/propylene which is reported separately, unfinished oils, kerosene, and asphalt/road oil. These products typically account for the majority of other oils stocks. Stocks of the remaining minor products included in other oils inventories not collected on weekly survey forms are estimated. Minor products include aviation gasoline, other hydrocarbons and oxygenates, aviation gasoline blending components, naphtha and other oils for petrochemical feedstock use, special naphtha, lube oils, waxes, coke, and miscellaneous oils.
In the coming weeks, we will need to see US oil demand trend higher or else our assumption that WTI reaches $85 to $90 will have to be lowered. Elevated refining margins and low product inventories suggest a tighter market condition than implied by EIA's demand figures, so let's see what the data shows us.
Positives
US oil production remains flat.
Our latest high-frequency data puts US oil production around ~12.6 million b/d or slightly lower than the May production average of ~12.65 million b/d.
Typically, US oil production starts to meaningfully grow by the end of Q3 and into Q4. If we don't see similar momentum this time, it implies that US oil production has already peaked for the year. Given the rig count drop, we think this is a very high possibility.
US product storage remains low.
Despite the weak demand we alluded to previously, product storage remains low. Gasoline storage is still at the lowest level over the last 5-years.
Distillate storage remains low.
All things considered, elevated refining margins continue and suggest to us that low storage levels are incentivizing refineries to increase throughput. But with US refinery throughput stuck around ~16.5 million b/d and maintenance just a few weeks away, refining margins are likely to remain elevated going forward.
Conclusion
Q3 inventory draws are underway. Next week's EIA report will show a crude build, but the following weeks will show material draws. The trend has not changed. This combined with flat US oil production and low product storage should continue to push oil prices higher.
However, readers should note the weakness in US oil demand figures, and we will want to see that rebound in order to keep pushing prices higher.


