
(Macro) Chemical Sector Part 3 - Lessons From Past Cycles And How They Apply To Today's Chemical Stocks

By: Jon Costello
Please read part 1 and part 2.
My previous macro article on the chemical industry explained how investors are viewing the sector through the wrong lens. Many are waiting for the onset of a macro GDP recession before investing, even though prices are at bargain levels. They’re doing so to sidestep a selloff that may happen during a recession, or to time their investment at the bottom in anticipation of the subsequent upturn.
Although a recession may happen and likely push chemical stocks lower, investors should consider initiating a position in chemical stocks now.
Recessions are only clear in hindsight and are nearly impossible to predict accurately. Investors waiting for a recession before buying these stocks might miss out on the profits to be had in the eventual recovery.
Second, the industry has already experienced a brutal multi-year downcycle that has impacted the supply side in a macro recessionary manner.
Third, cyclical chemical stock prices are so low that even if they fall further during a recession, the long-term returns they will generate are likely to be satisfactory.
Fourth, and most importantly, the industry’s historical pattern has been to decline and recover in the absence of a macro recession. In fact, each value chain within the industry has its own unique cycles.
My previous article covered the key economic factors that cause downturns and recoveries. This article will present historical examples of chemical cycle downturns and recoveries, both of which occur on a timetable distinct from the broader GDP changes. Once investors realize how some of the harshest chemical downturns have been resolved within the value chains themselves—often while headline macro data is neutral or only slightly positive—they might consider taking the plunge into some beaten-down chemical stocks today.
Titanium Dioxide: Overbuild, Environmental Crackdown, and Forced Discipline
Titanium dioxide is a particularly volatile chemical value chain. The market’s cycles since 2011 show how bad conditions can get within the titanium dioxide chain, even as global macro GDP expands, and how an upturn can begin without a GDP increase.
In 2011, the titanium dioxide market experienced a spike in prices after severe supply rationalization in response to the 2008-2009 recession. The industry reacted predictably to higher prices: it expanded capacity. This time, China took the lead.
Also predictably, the capacity buildout went too far. While the global economy continued to grow, the excess capacity created in 2012 and 2013 caused a sharp drop in titanium dioxide prices in 2014.
The industry downturn worsened in 2015, with operating rates dropping to the mid-60%. Prices declined sharply, making 2015 one of the worst margin years in decades for titanium dioxide producers.
From the peak of the titanium dioxide cycle in 2011 through the lows of 2015, global GDP grew steadily. The industry’s downturn and eventual stabilization were part of an intra-sector adjustment process.
In this case, the adjustment process was triggered by a glut in major producing regions, which caused a decline in global titanium dioxide prices. In China, prices dropped below producer cash costs, forcing formerly expansionist producers to adopt supply discipline.
Adding to the Chinese industry’s woes were stricter environmental enforcement measures. These measures were implemented to address rising pollution levels resulting from the low-cost production process favored by Chinese titanium dioxide producers.
Chinese producers aiming for rapid expansion in response to rising prices adopted a cheaper but problematic “sulfate” production process. This method is older, simpler, and relies on widely available technology.
The alternative method, the “chloride” process, is more expensive and technologically advanced. This process yields a higher-quality product that commands a premium price.
The problem with the rapid growth of the sulfate process is the pollution it causes. The process produces large amounts of acidic liquid waste and other harmful byproducts, including carbon dioxide. Global regulators have cracked down on sulfate plants that couldn’t afford upgrades to cut pollution. They have generally supported replacing the sulfate process with the chloride process. Today, about 55% of titanium dioxide is made using the sulfate process, mostly in China. Newbuild capacity, both inside and outside China, mainly uses the chloride process.
In 2015, about 98% of Chinese titanium dioxide was produced through the sulfate process. The pollution issue was addressed with regulations such as discharge permits, mandatory inspections, and pollutant tax systems for producers using the sulfate process.
Chinese authorities also stopped approving new sulfate plants and required older ones to relocate or shut down. These measures impacted the Chinese industry but had only a minor effect on overall Chinese titanium dioxide production. Consider that in 2015, China produced a total of 2.7 billion tons of titanium dioxide annually. Brokerage reports at the time estimated that only 112,000 tons of the country’s sulfate production was shut down.
Nevertheless, the reduction of capacity and the outlook for fewer newbuild projects helped pave the way for a market recovery.
While Chinese production retrenched during the 2014-2015 downturn, high-cost Western titanium dioxide production capacity was exiting the field. Older European and North American sulfate plants were curtailed or permanently closed. Weaker assets were shuttered, and producers redirected their focus toward selling higher-value titanium dioxide grades to enhance returns.
The supply adjustment process continued through 2016 while demand remained steady. Demand from coatings and plastics end-users didn’t boom, but the supply reduction amid stable demand helped global inventories normalize, and Chinese exports slowed from manic levels during the boom.
The market’s recovery began in earnest in 2017. That year, titanium dioxide prices and producer margins increased to mid-cycle levels. Not the levels seen during the 2011 euphoria, but levels at which the surviving assets could earn their cost of capital.
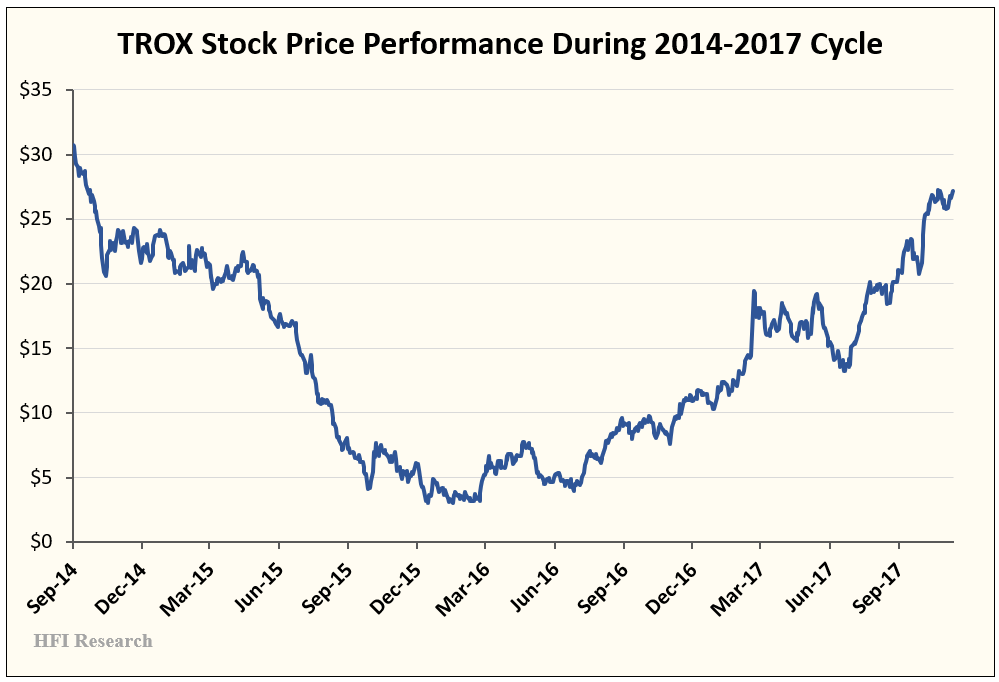
Throughout the entire cycle, titanium dioxide producer stocks mirrored the market’s progress. Over the 2014 to 2017 cycle, Tronox (TROX) shares plunged by 90% before staging a full recovery, as shown below.
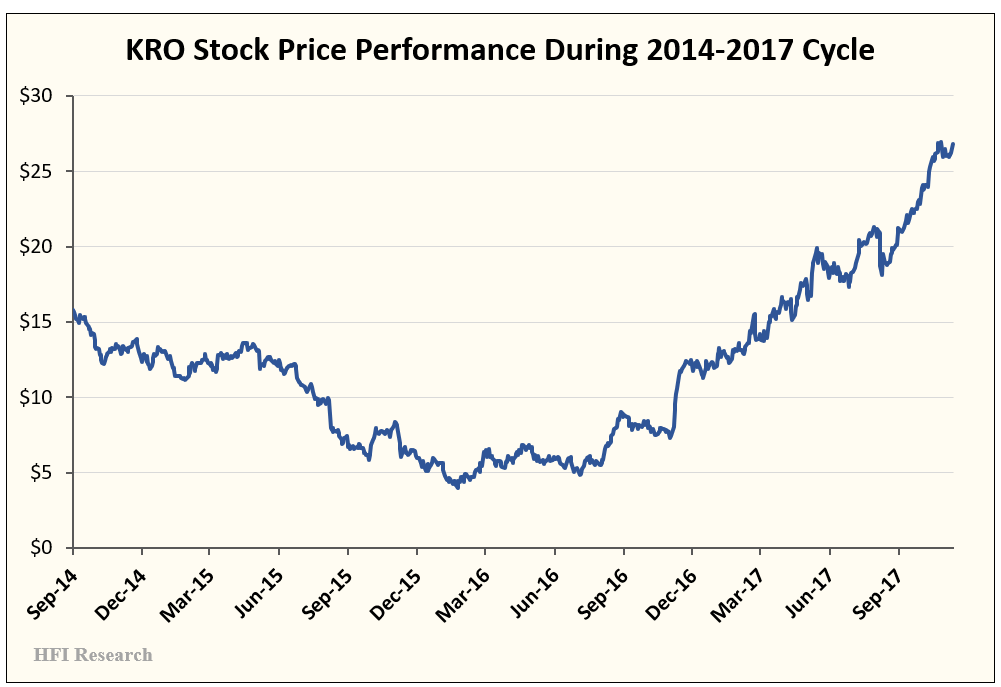
Meanwhile, Kronos (KRO) shares fell 75% before rebounding and then surged 474% from their lows during the 2017 upcycle.
The lesson from the titanium dioxide cycle is clear: the cycle turned not because of an acceleration in global economic growth, but because enough capacity had exited the market while modest volume growth quietly absorbed the remainder. Economic growth in the major global demand centers over this period remained steady, as shown below.
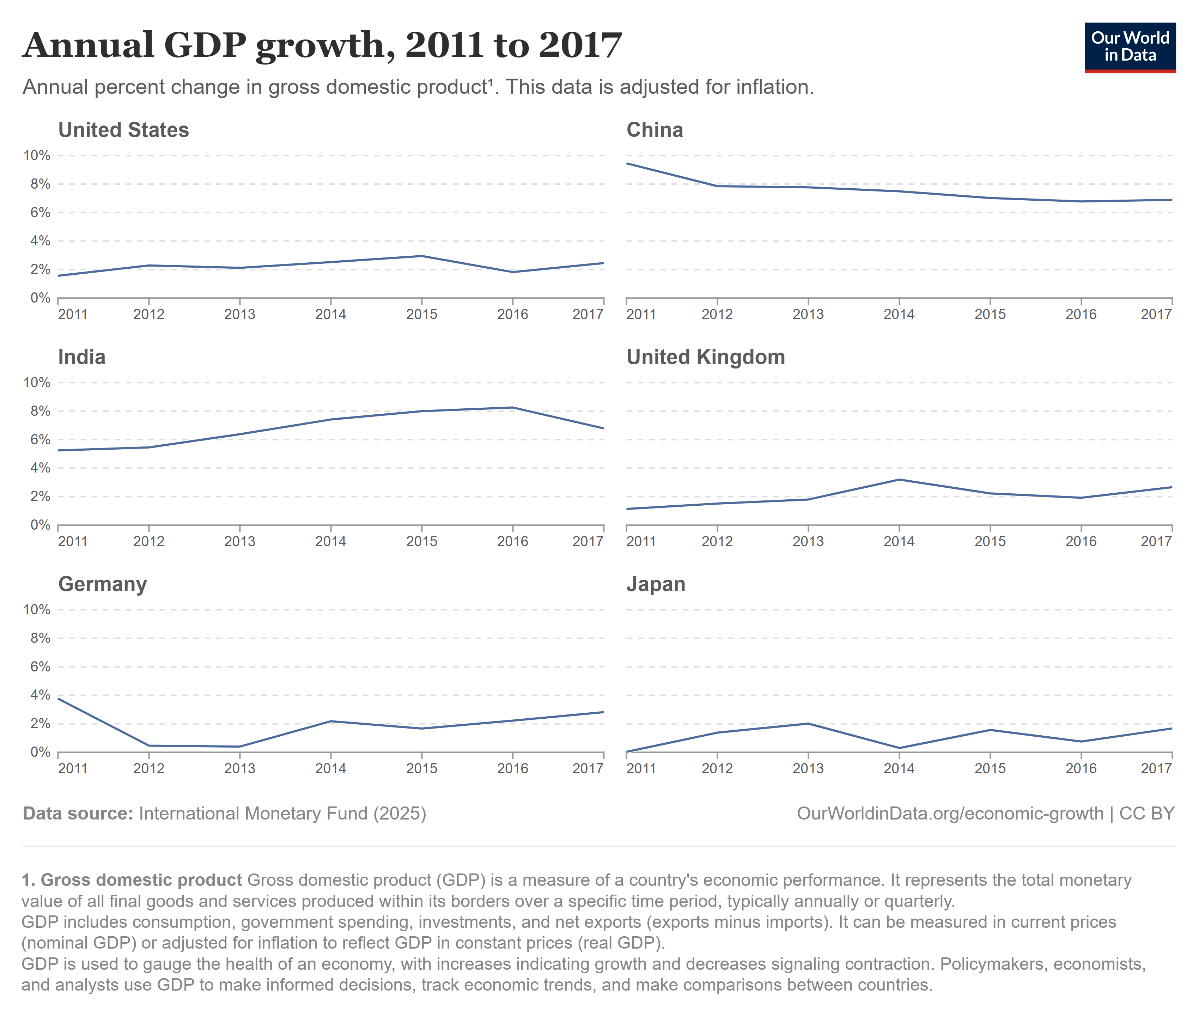
Source: Our World in Data.
Investors who sat on their hands due to concerns about price volatility a looming recession missed out on the opportunity to earn outsized returns over a multi-year holding period. The key was to hold, focus on intrinsic value over price, and avoid getting too emotionally involved in the dramatic short-term swings to which titanium dioxide stocks are prone.