

Natural gas prices continue to exhibit wild swings day to day. Part of the market remains reluctant to price in the extreme cold we are seeing. I don’t know whether that’s due to the fact that it believes the cold is transitory or because of the massive move in the prompt month (February), but traders have fixated on dealing with the physical realities first before pivoting their attention to March and the rest of the 2026 curve.
Regardless of the reasoning, February contracts are expiring on Jan 28, and the violent prompt month moves are coming to an end. Market participants can finally focus on 1) the end of withdrawal inventory and 2) whether we can refill the gas in storage.
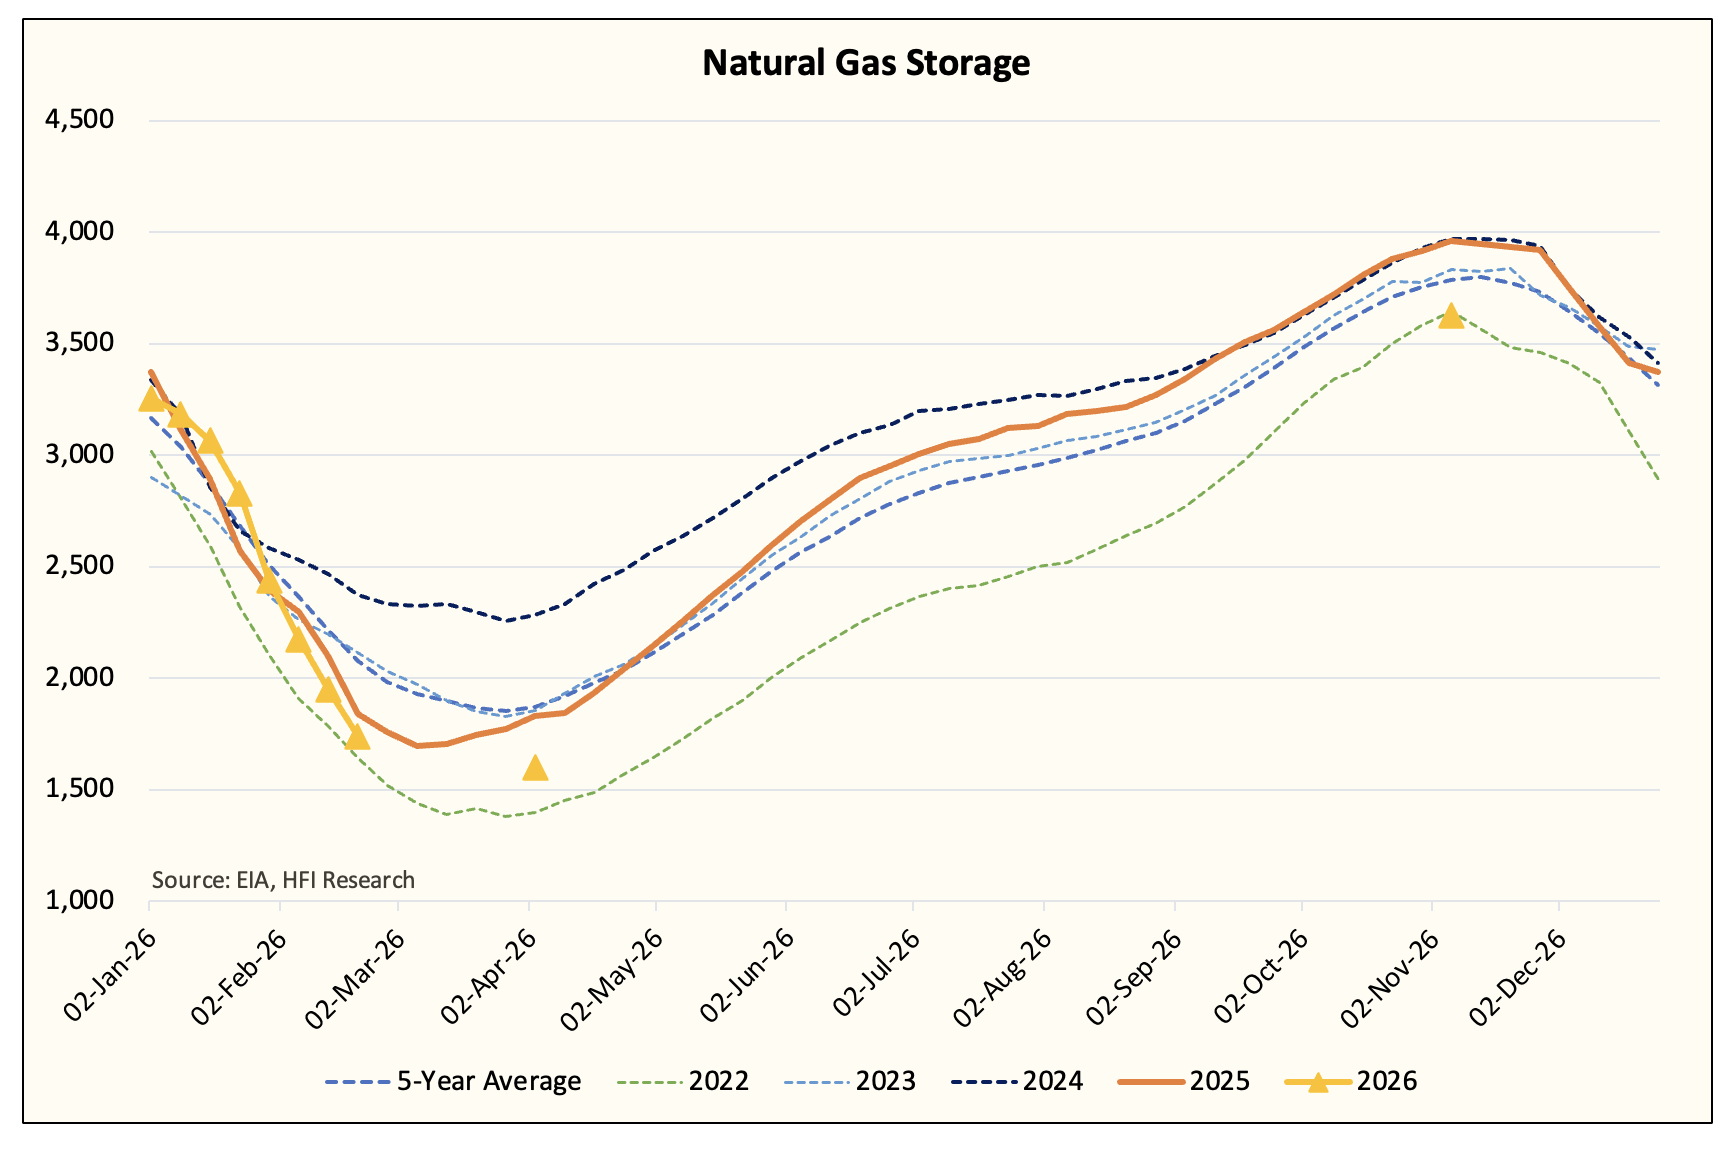
From a storage standpoint, this is where we stand today.
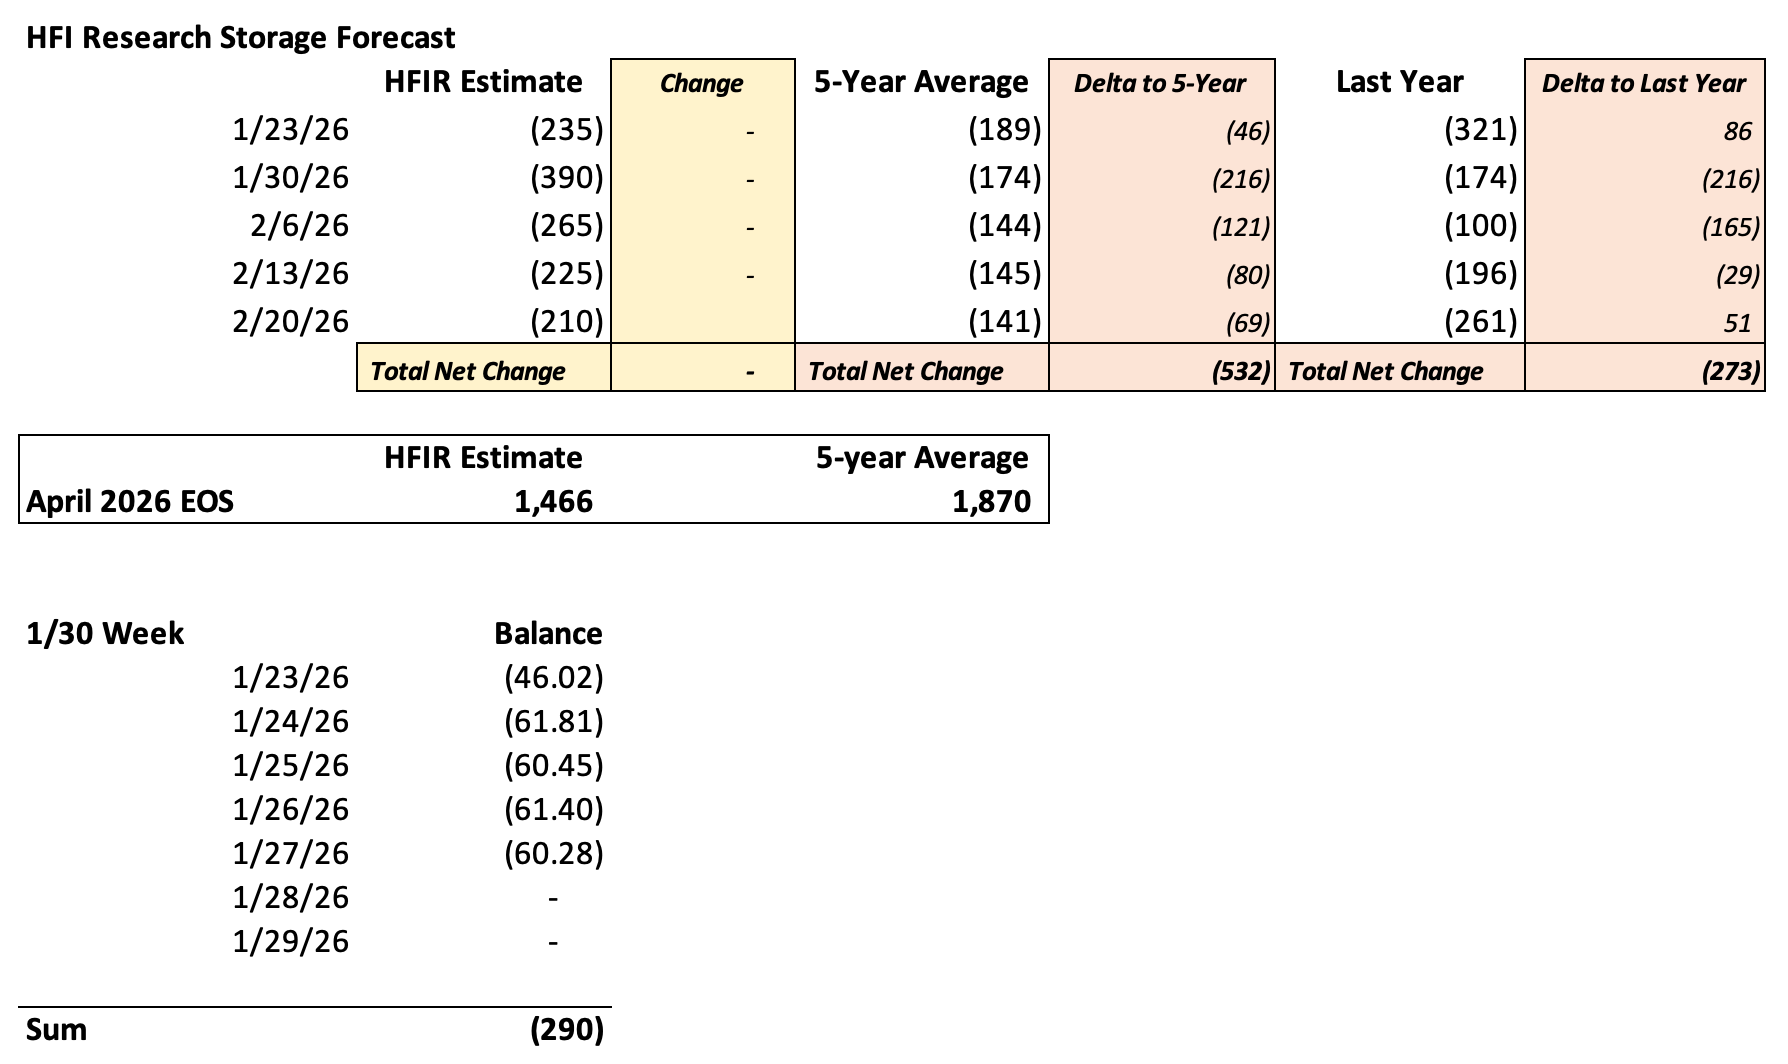
Elevated heating demand is expected until Feb 1. Implied storage withdrawal this week has averaged over ~60 Bcf over the last 4 days. Projected deficit for 1/28 and 1/29 is around ~116 Bcf, which would put the total withdrawal for 1/30 week past -400 Bcf. This would set a record.
Due to the size of the withdrawal, models can easily underestimate or overestimate. Considering that we’ve seen peak production freeze-off estimates at ~18 Bcf/d while our model shows only ~10 Bcf/d, we could be on the conservative side at -390 Bcf.
Either way, natural gas storage is expected to fall to 1.74 Tcf by Feb 20th. Interestingly enough, traders are expecting ~1.79 Tcf for the end of the withdrawal season.
Source: ICE
That seems way too pessimistic, and we think that has largely contributed to the muted moves we’ve seen along the curve.
By our estimate, if heating demand just stays modestly above the 10-year norm for the 2nd half of February, our storage estimate of ~1.466 Tcf will likely come to fruition.
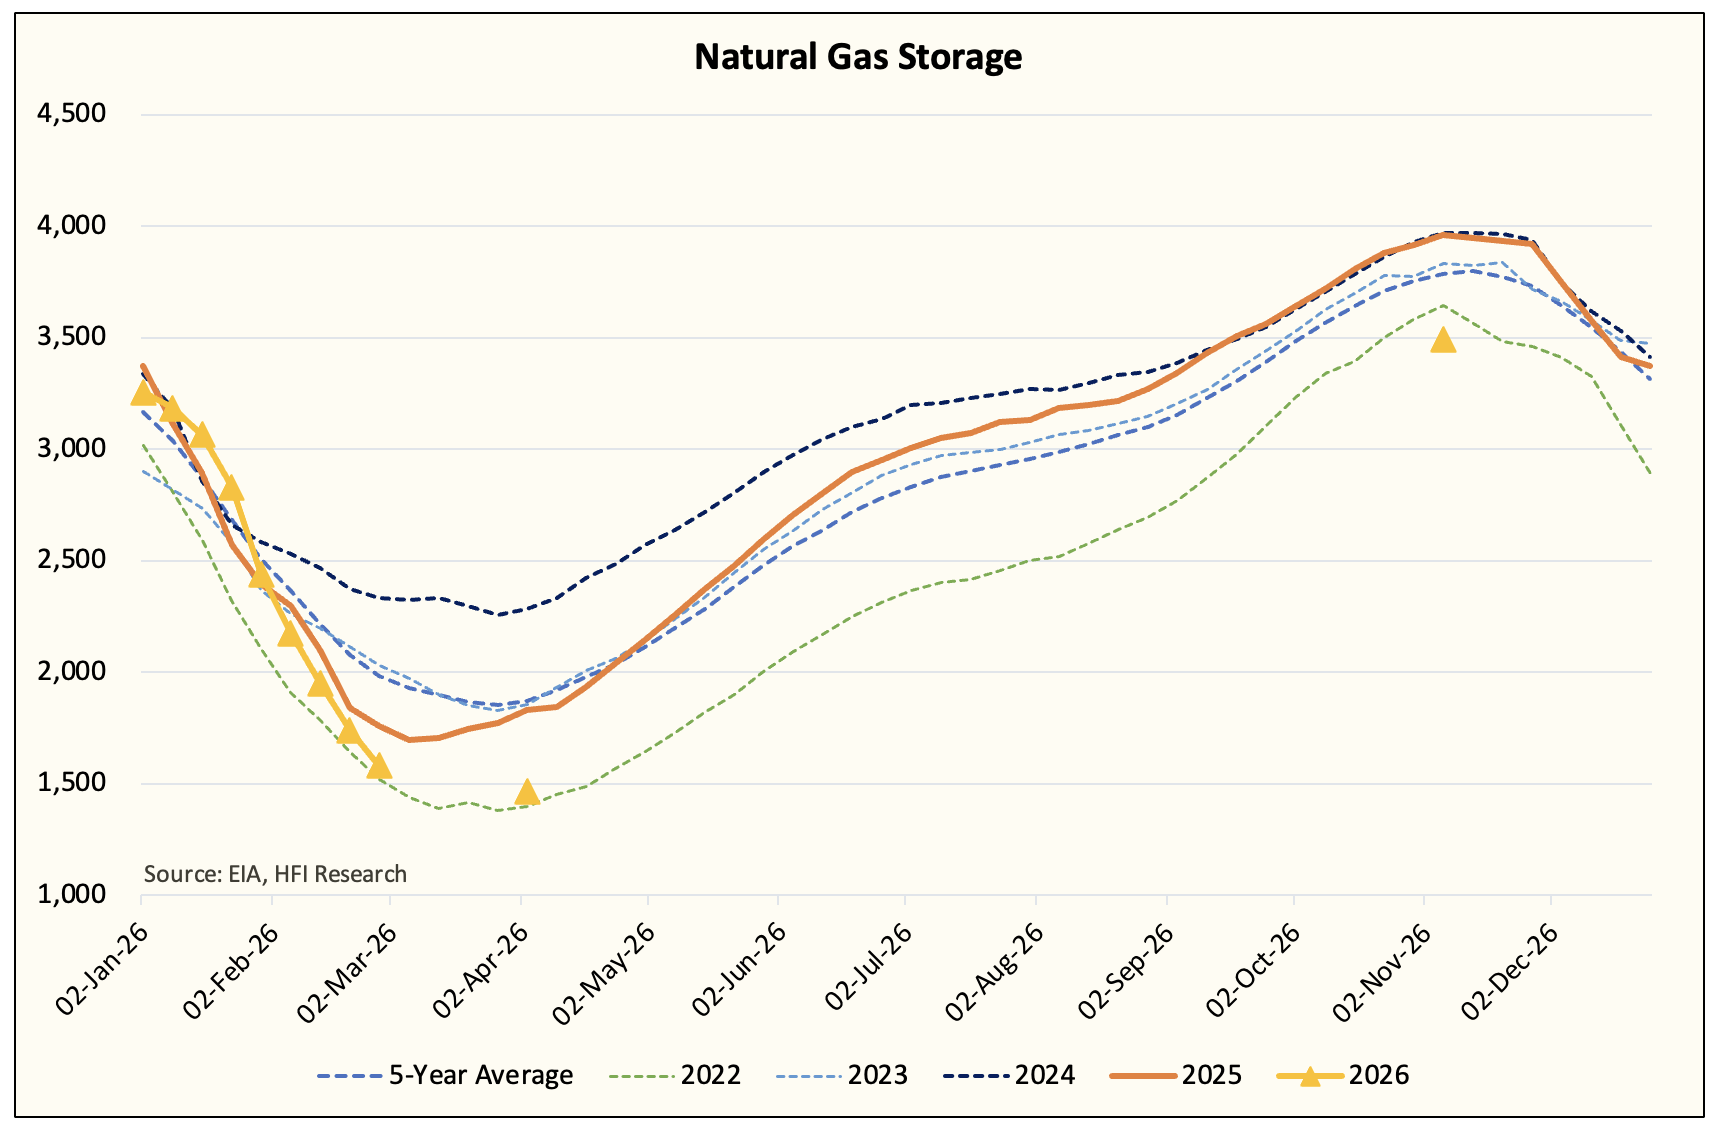
This will put April natural gas storage near the 2022 lows.
On the contrary, if heating demand is below the 10-year average, then April will come in near ~1.6 Tcf.
But here’s the kicker: both scenarios bring up the issue of the injection season.