
Oil Continues To Be Stuck In No-Man's Land And What Needs To Happen To Change That

EIA reported a bullish oil storage report today with the crude draw coming in slightly higher than our estimate (-9.6 million bbls vs -8.29 million bbls). Oil prices reacted positively to the report but remain stuck in no-man's land.
In our view, here are the things preventing oil prices from going higher, and here are the things that need to change.
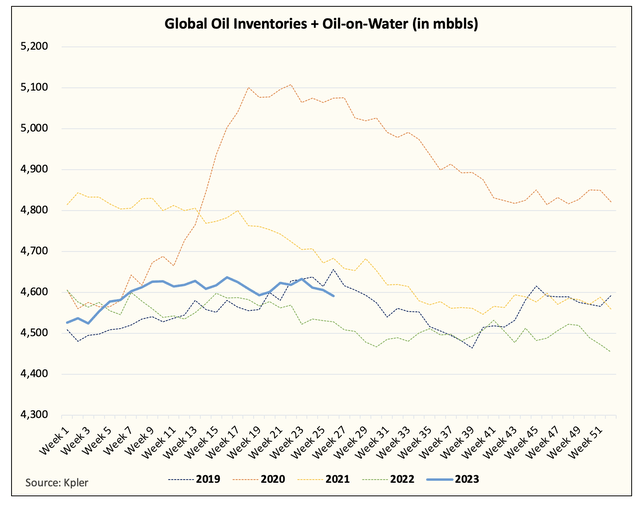
The physical oil market remains very weak. We are still not seeing an oil market that's firmly in deficit territory. From physical timespreads to visible inventory draws, we are just not there yet.
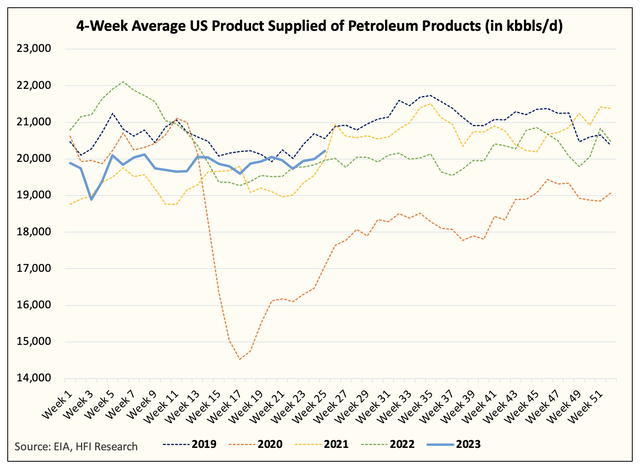
Demand is doing better, but not great. US implied oil demand is now back above ~20 million b/d on a 4-week moving average basis. However, we will need to see a meaningful tick higher before we can say that demand is on track. While we are seeing signs of a major divergence from the trend last year, without a move higher, we will remain in no-man's land.
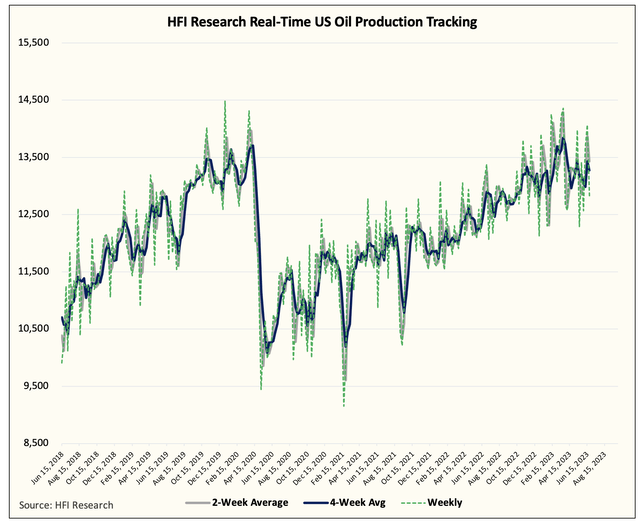
Sanctioned barrels (Iran, Russia, and Venezuela) have surprised to the upside this year giving the oil market a shock on the supply side. However, supplies are starting to peak with the US oil production peaking. Combining this with the commencement of the voluntary cuts from Saudi, the supply side needs to surprise to the downside in order for us to break out of this no-man's land.
Signpost Check-In
On June 7th, we published an OMF titled, "Let's Be Real About The Oil Market." In the report, we gave 3 scenarios:
Scenario 1: Oil inventories draw, and timespreads pick up into the end of June
In scenario 1, you want to be adding to energy stock exposure. If EIA oil data confirms visible inventory draws and Brent timespreads pick up, then you know we are right about the second half being tight, and you will want to take advantage of that.
Scenario 2: Oil inventories are flat, and timespreads stay the same
In scenario 2, you will want to reduce energy exposure but maintain a bias to the long side. Balances are not turning right away, but it implies our paper balance is far too bullish. We think holding 15%-20% cash makes sense.
Scenario 3: Oil inventories are up, and timespreads move lower
If scenario 3 happens, you will want to sell down at least half of your energy exposure. While one can still make the argument that the long-term is bullish for energy, we are completely wrong on the oil market balance. This scenario is unlikely to happen given the Saudi unilateral cut, but we can never say never. If this happens, you will want to hold over 50% cash.
Fast forwarding to today, timespreads are down considerably and flipping back into contango, and oil inventories are flat. We are stuck between scenarios 2 and 3. Investment implication-wise, this means that readers should continue to hold cash in case the bull thesis doesn't pan out.
In our view, the market is treating oil as a show-me market, and rightfully so. Without large visible inventory draws and without any meaningful surprise to the upside on demand, the market doesn't see a reason why oil prices should move higher. That's a fact. And for energy investors, we should continue to use signposts as a way to gauge our risk tolerance.
Going forward, the roadmap is very simple. With the Saudi unilateral cut coming in July, if we don't see 1) firming up in the physical market and 2) visible inventory draws, then we need to cut our risk exposure. If the physical market firms up and inventory draws materialize, then we need to add to our exposure. And depending on the size of the draws and how much the market firms up, we will vary how much we add.
For now, this is what I see. Q3 and Q4 are supposed to show global oil markets flip into a large deficit, so we oil bulls can no longer make any more excuses if they don't materialize. It's time to put this thesis to the test, let the inventory draws begin.