Oil Demand Is Bad? Nah, Just Bad Data
Some of you may recall that on August 3, we published an article titled, "US gasoline demand falls below 2020 but there are far more questions than answers." In it, we said:
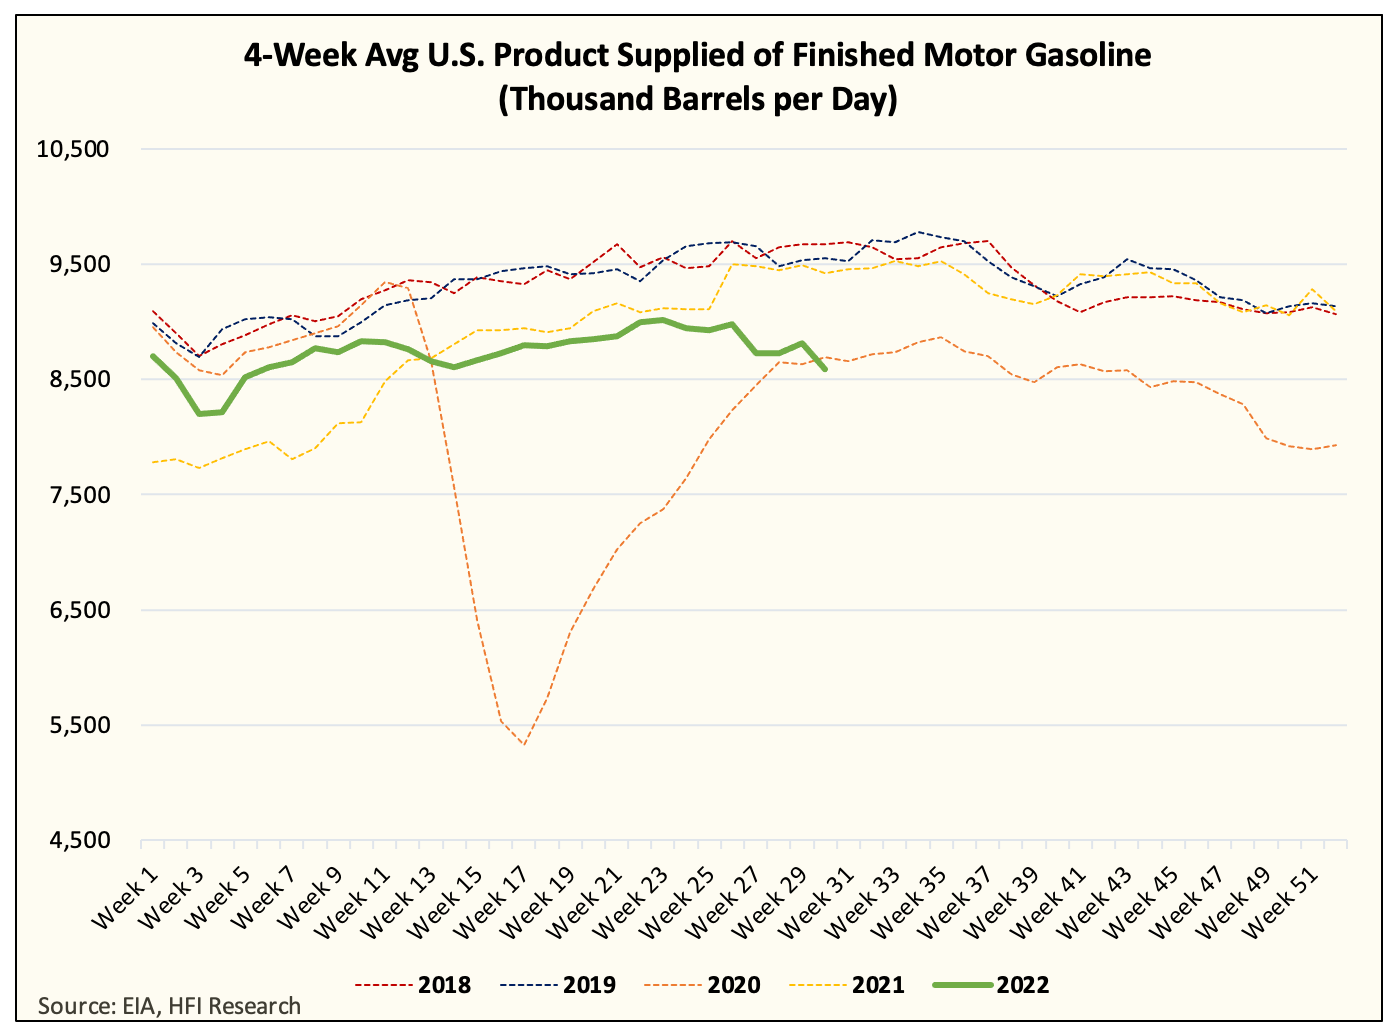
The big energy headline today is that the US implied gasoline demand fell below 2020 levels (on a 4-week average basis).
For those of us that actually leave the house and drive, you can likely recall that traffic wasn't nearly as bad as compared in 2020. Yet, the EIA data appears to suggest that gasoline demand is now below that for July.
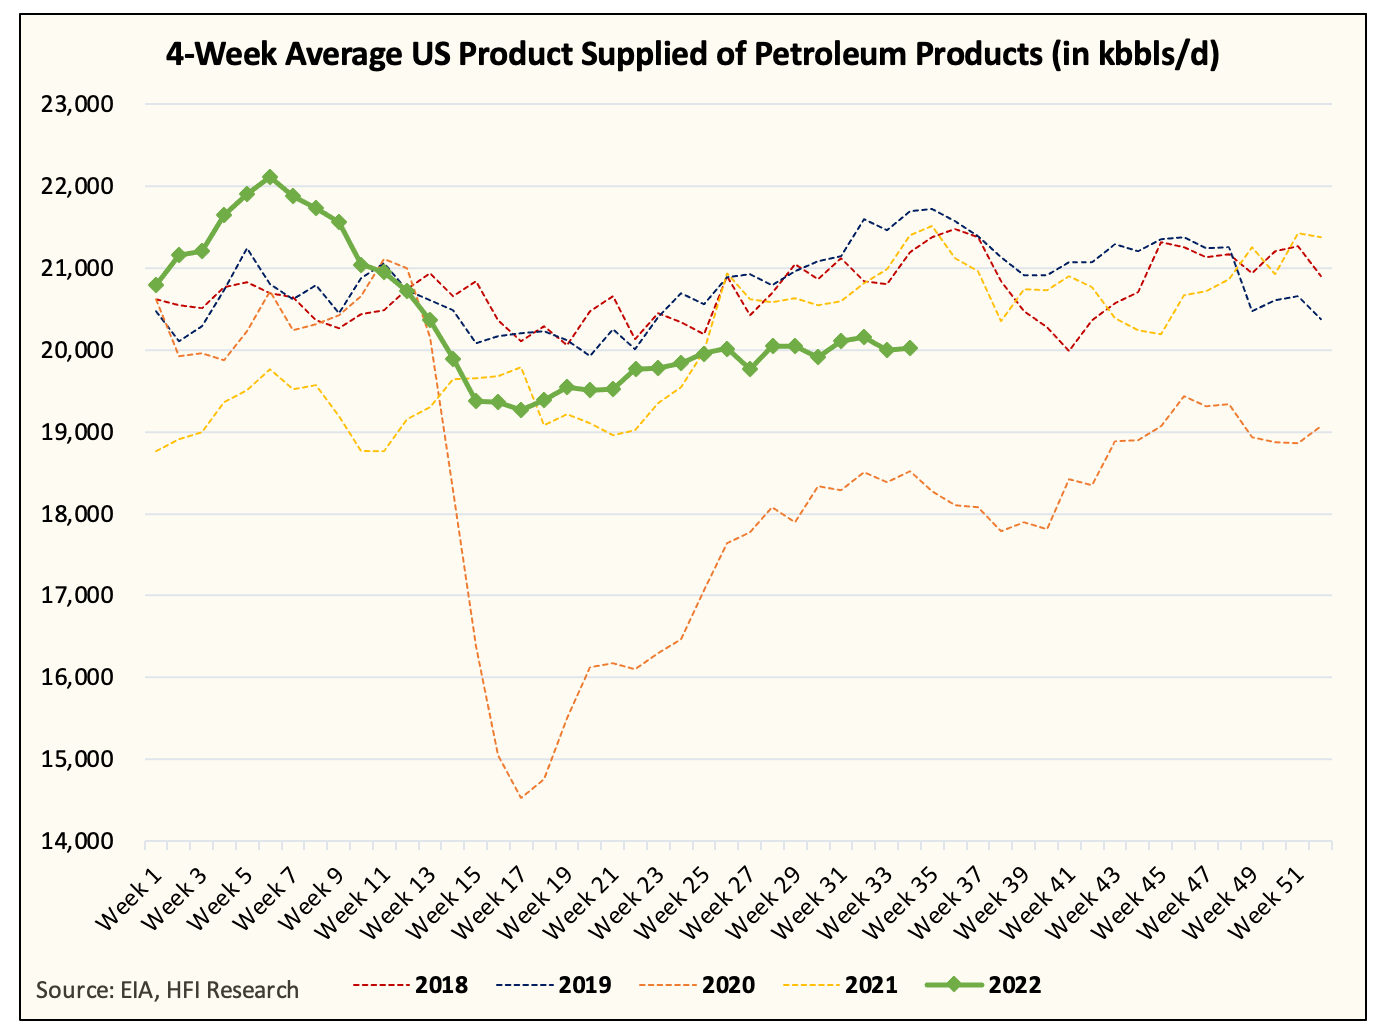
We then followed up with the point that there have been large discrepancies between the weekly implied demand data and the monthly. So now that the end of August is here, this is what the monthly US oil demand data looks like versus the weekly:
Yes, the discrepancy is too large to ignore. EIA understated the US implied oil demand in the weekly reports by ~900k b/d. It understated it so much that if you compare the June data in the weekly versus the monthly, you would have thought we lost close to ~5% of demand from the spike in price when in reality, nothing has changed.
Monthly
Weekly
As you can see in the charts above, that is clearly not the case.
But to be fair, we do have to acknowledge the weakness in gasoline demand. In the article we published on August 3rd, we concluded by saying:
Again, we are not trying to make up some bull narrative and argue that demand is not weak. In fact, we were one of the first ones to point out that US oil demand was surprising to the downside. But at some point, you just have to call a spade a spade. We think demand is weak due to increasing prices, yes, there's no doubt about that. But is gasoline demand below 2020? No, and so we are likely somewhere between 2021 and 2020 demand figures, but skew towards the upside.
Now let's take a look at the monthly gasoline demand figure:
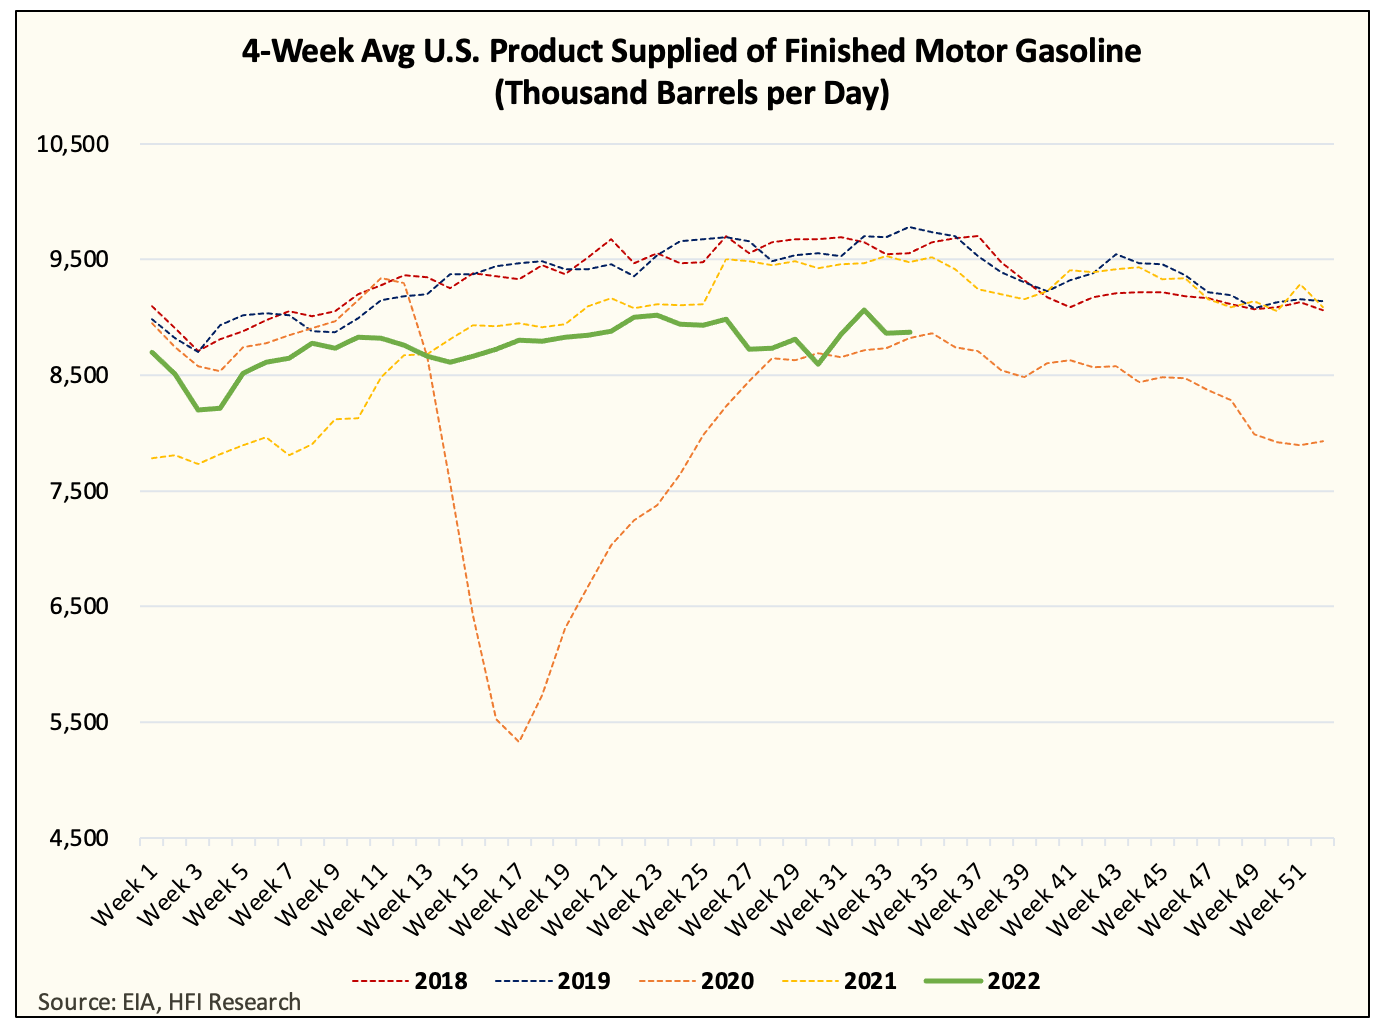
As you can see, US implied gasoline demand for June was lower y-o-y, but it was significantly higher than in 2020. Similarly, we suspect the same issue is happening to the weekly data for the most recent report:
As you can see in the weekly data, EIA appears to be suggesting that since the end of June, we have averaged ~8.814 million b/d for gasoline demand. Using the delta to the June data, that would imply a decrease of ~300k b/d. This is unlikely and it appears EIA is understating the US implied gasoline demand by 250k b/d to 300k b/d (or in line with our assumption).
Why does this matter?
This is vitally important to the oil market analysis because we've been hammering away the point that demand is really the only thing that could push prices higher. With the June data, we now have a bit more clarity:
Gasoline demand did fall due to higher prices. Demand is weaker y-o-y, but nowhere near 2020.
Total implied oil demand is strong despite the increase in price.
Inventory is the only figure we can rely on in the weekly reports.
Putting this in terms of perspective, the oil market weakness as of late has more to do with the possibility of demand weakness on the horizon versus an actual demand weakness now. Gasoline demand aside, and we acknowledge that it's lower y-o-y, total US oil demand is fine.
Now if the fear of oil demand falling down the road is the real worry, then it implicitly assumes that the possibility of oil demand surprising to the upside is lower. This is a valid assumption given the macro headwinds on the horizon, but this greatly changes the calculus.
Because as of this moment, we have OECD oil demand ~1 million b/d below 2019 levels in Q4 2022. However, if OECD oil demand is already at 2019 today (US is nearly half of OECD), then the odds of us moving lower ~1 million b/d in light of the macro weakness is a very conservative assumption.
This means that the oil market balance is likely to remain in deficit going forward despite demand worries, which should continue to linger in the near term but have no actual fundamental impact to balance.
Now, of course, we have to be mindful that this is just June demand data, and July data could be different. But given that EIA understated US oil demand by ~900k b/d for June, we think the odds of demand being higher than what EIA stated for July and August are high.
What's the conclusion then?
Simple. Gasoline demand is lower y-o-y but substantially higher than in 2020. Total US oil demand is strong and healthy despite the price increase, thus implying OECD demand is much higher than we expect. As a result, the global oil market balance has now shifted to a higher probability of surprising on the upside (more deficit), thus increasing the probability that oil prices remain higher for longer (implicitly assuming a lower risk of moving lower to find "demand bottoming").
Energy stocks will have a higher floor priced in once the worries of macro risks and recession recede.
Fundamentally speaking, we are going to be ok.


