
Oil Fails To Gain Traction As Q1 Builds Continue

Q1 builds are starting to really dampen market sentiment. EIA's oil storage report today came in with another total liquid build bringing the YTD total to 55.431 million bbls.

While on an absolute basis, and depending on which chart you are looking at (right or left), US total liquids stockpile remains low. And if you are looking solely at the commercial total liquids chart (right), then we are currently above 2019.
The market is right in taking an extremely cautious view when looking at the oil market. With oil inventories building in the most visible dataset (US oil data), the market is right in being skeptical that oil market balances will flip into a deficit later this year.
It also doesn't help that the latest US data is fraught with questionable quality issues. Since we've started our modified adjustment method (taking actual exports/imports and netting it vs EIA's exports/imports), we've recorded two of our largest modified adjustments since 2018.
You couple the data volatility with sincere skepticism over the underlying tightness in the oil market, and in-lies the problem with why oil prices are failing to gain any traction.
There are problems...
For us, the most concerning issue is in products. First, product storage seasonally starts to draw this week. Warmer than normal weather is a big reason why we are not seeing heating demand-sensitive products draw more.

Gasoline had its first real outperformance this week via the implied demand data, but more is needed for the market to start tightening.

And looking at the latest refining margins, things aren't as good as we are hoping to be. Even with global refineries going into maintenance starting now, refining margins are failing to get any uplift, which is another sign that the global product overhang remains.
It is plausible that as China reopens, the lag between the increase in demand and the drain on storage will take time.

The data is indicating that the reopening is real, so it's not fantasy to assume that this will eventually show up via demand for products.
With that said, however, it is a fact that as of this writing, the global crude market is nowhere near as tight as we had expected, and the product market remains in surplus.
Uncertainty in the data...
In 2018, we started a new method called "modified adjustment", which takes into account EIA's own adjustment but with a twist. We know based on EIA's methodology that the crude imports and exports figures are based on customs filing. And since this is not reflective of the real-time movement of vessels, we wanted to see what the real implied adjustment would be if we netted out the physical movement in imports and exports vs EIA's figures.
The net product, modified adjustment, was then used to calculate the implied US oil production figure, which you can see in the chart below:

On the right-hand side, you can see our accuracy (blue-dotted line) vs EIA's monthly US oil production reading + monthly adjustment. As you can see, we are fairly accurate in predicting US oil production.
But what's troubling about the latest data is that these are two of the highest modified adjustment readings we've had in our dataset.
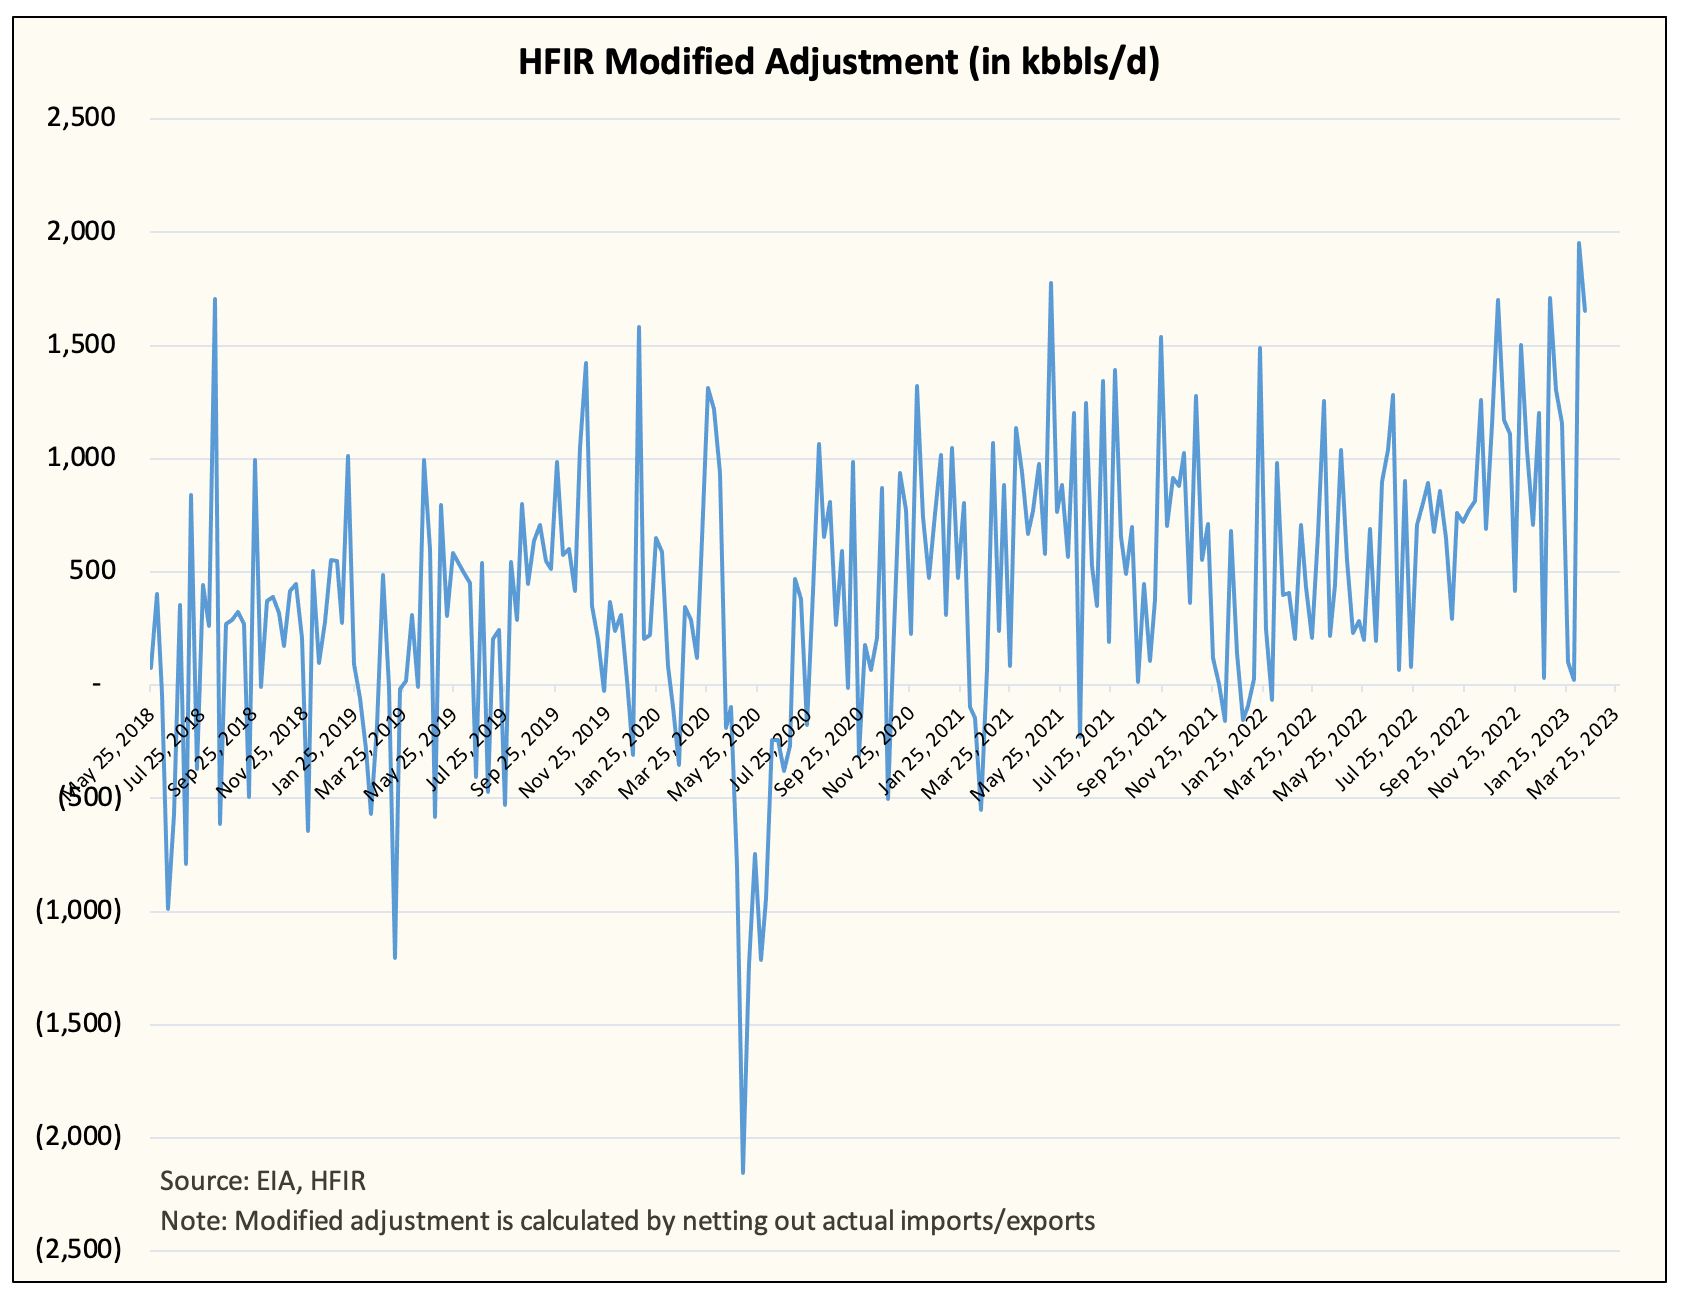
Now you are probably wondering what all of this means. Well, let me try and explain this the best way possible, and hopefully, EIA can explain this better down the road when they find the root cause of the adjustment issue.
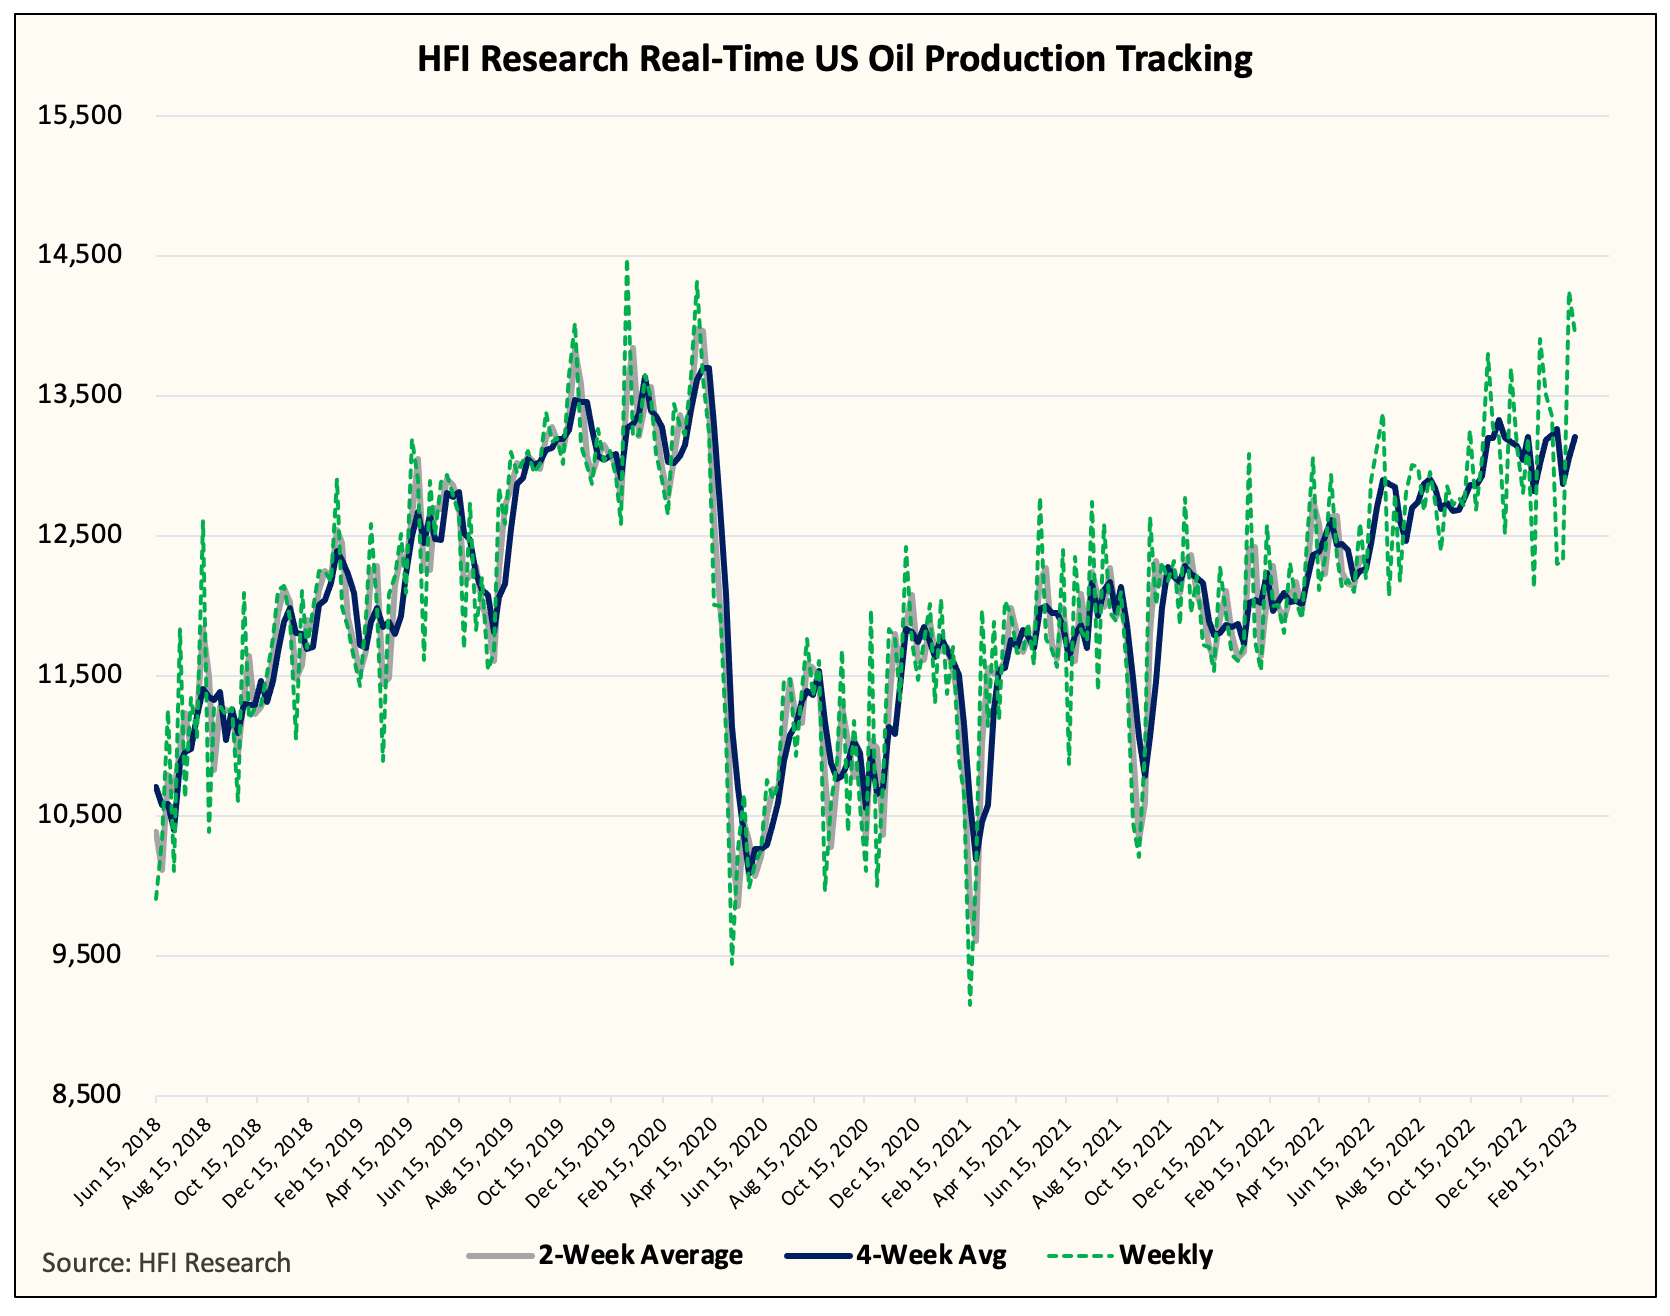
Here is the modified adjustment but incorporated on a weekly basis. As you can see from the bold-blue line, US oil production has been flat on a 4-week average basis. But you will note that the green-dotted line is all over the place.
This typically happens when an exogenous event like the freeze-off we saw two weeks ago takes place. In that scenario, US oil production was meaningfully impacted, and thus, all the figures associated with it will fall out of place.
How do we know for sure that production was impacted? We can track US gas production to see how severe the drop was.

Now that we've verified a significant drop took place, how come we didn't see a similar drop in the EIA data? It is because the weekly US oil production figure the EIA uses is based on the STEO (short-term energy outlook report) data. As a result, the modified adjustment for that week dropped to 25k b/d. And the week prior to the freeze-off, the modified adjustment dropped to 103k b/d.
In essence, the last two weeks of bad data were in some way a "make-up" mechanism for the previous two weeks of bad data. This is the reason why you see in our weekly modified adjustment tracker the wild swings.
And now that we are on this wild adjustment swing, the next few weeks will also encompass a lot of volatility to make up for these last two weeks of bad data. The cycle then goes on and on until the data normalizes itself.
What to expect going forward?
US crude exports are going to be very elevated in the coming weeks. This combined with the normalization of the modified adjustment should imply US crude storage to be flat to down.
Our preliminary estimate for next week shows flat US crude storage.

The record reading we saw in the modified adjustment will self-correct. This is unsustainable and our dataset shows that. Readers can expect that figure to meaningfully drop and we will keep everyone updated via Twitter.
Conclusion
The oil market, for the time being, will remain concerned over the builds we are seeing in Q1. The most visible data, the US, will continue to weigh on sentiment until traders start to see draws return. But as we explained, the data in the coming weeks should start to change the sentiment.
We think there are still valid concerns like weak product demand and weak refining spreads, so we will need to see the reopening mobility data from China translate into higher oil demand before we can say we are fully out of the tranches for Q1.
For now, it's all about surviving Q1.
Disclosure: I/we have no stock, option or similar derivative position in any of the companies mentioned, and no plans to initiate any such positions within the next 72 hours.