

Price action drives the narrative and with WTI $2/bbl lower than when we called for the bottom, fundamentals must have worsened, right?
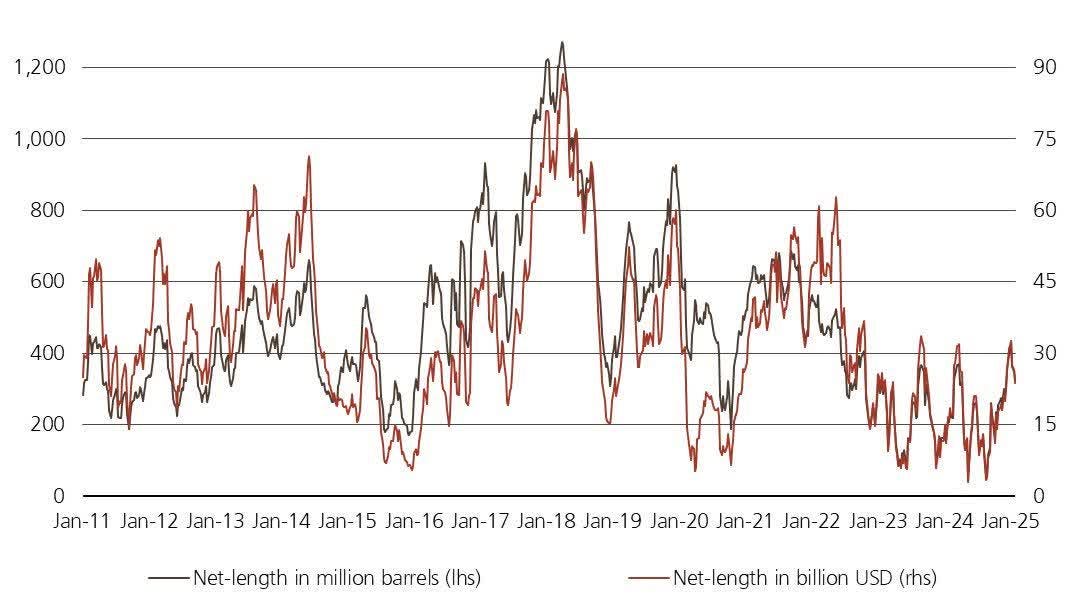
The reality is simpler than that. Money manager positioning remained elevated as of last week Friday's report (report last week Friday reflected positioning as of Feb 18th).
Source: Giovanni Staunovo
As a result, we think the latest bout of selling that occurred since Feb 18th has materially reduced speculator positioning. All the while, US total liquids have continued to trend lower, and the physical market is showing signs of a bottom.
But when it comes to oil fundamentals, there is a debate as to what the recent oil inventory draws have been concentrated on. Here's a deeper look at the latest US oil storage figures.
Oil Fundamental Math
US Total Liquids

Global Liquids
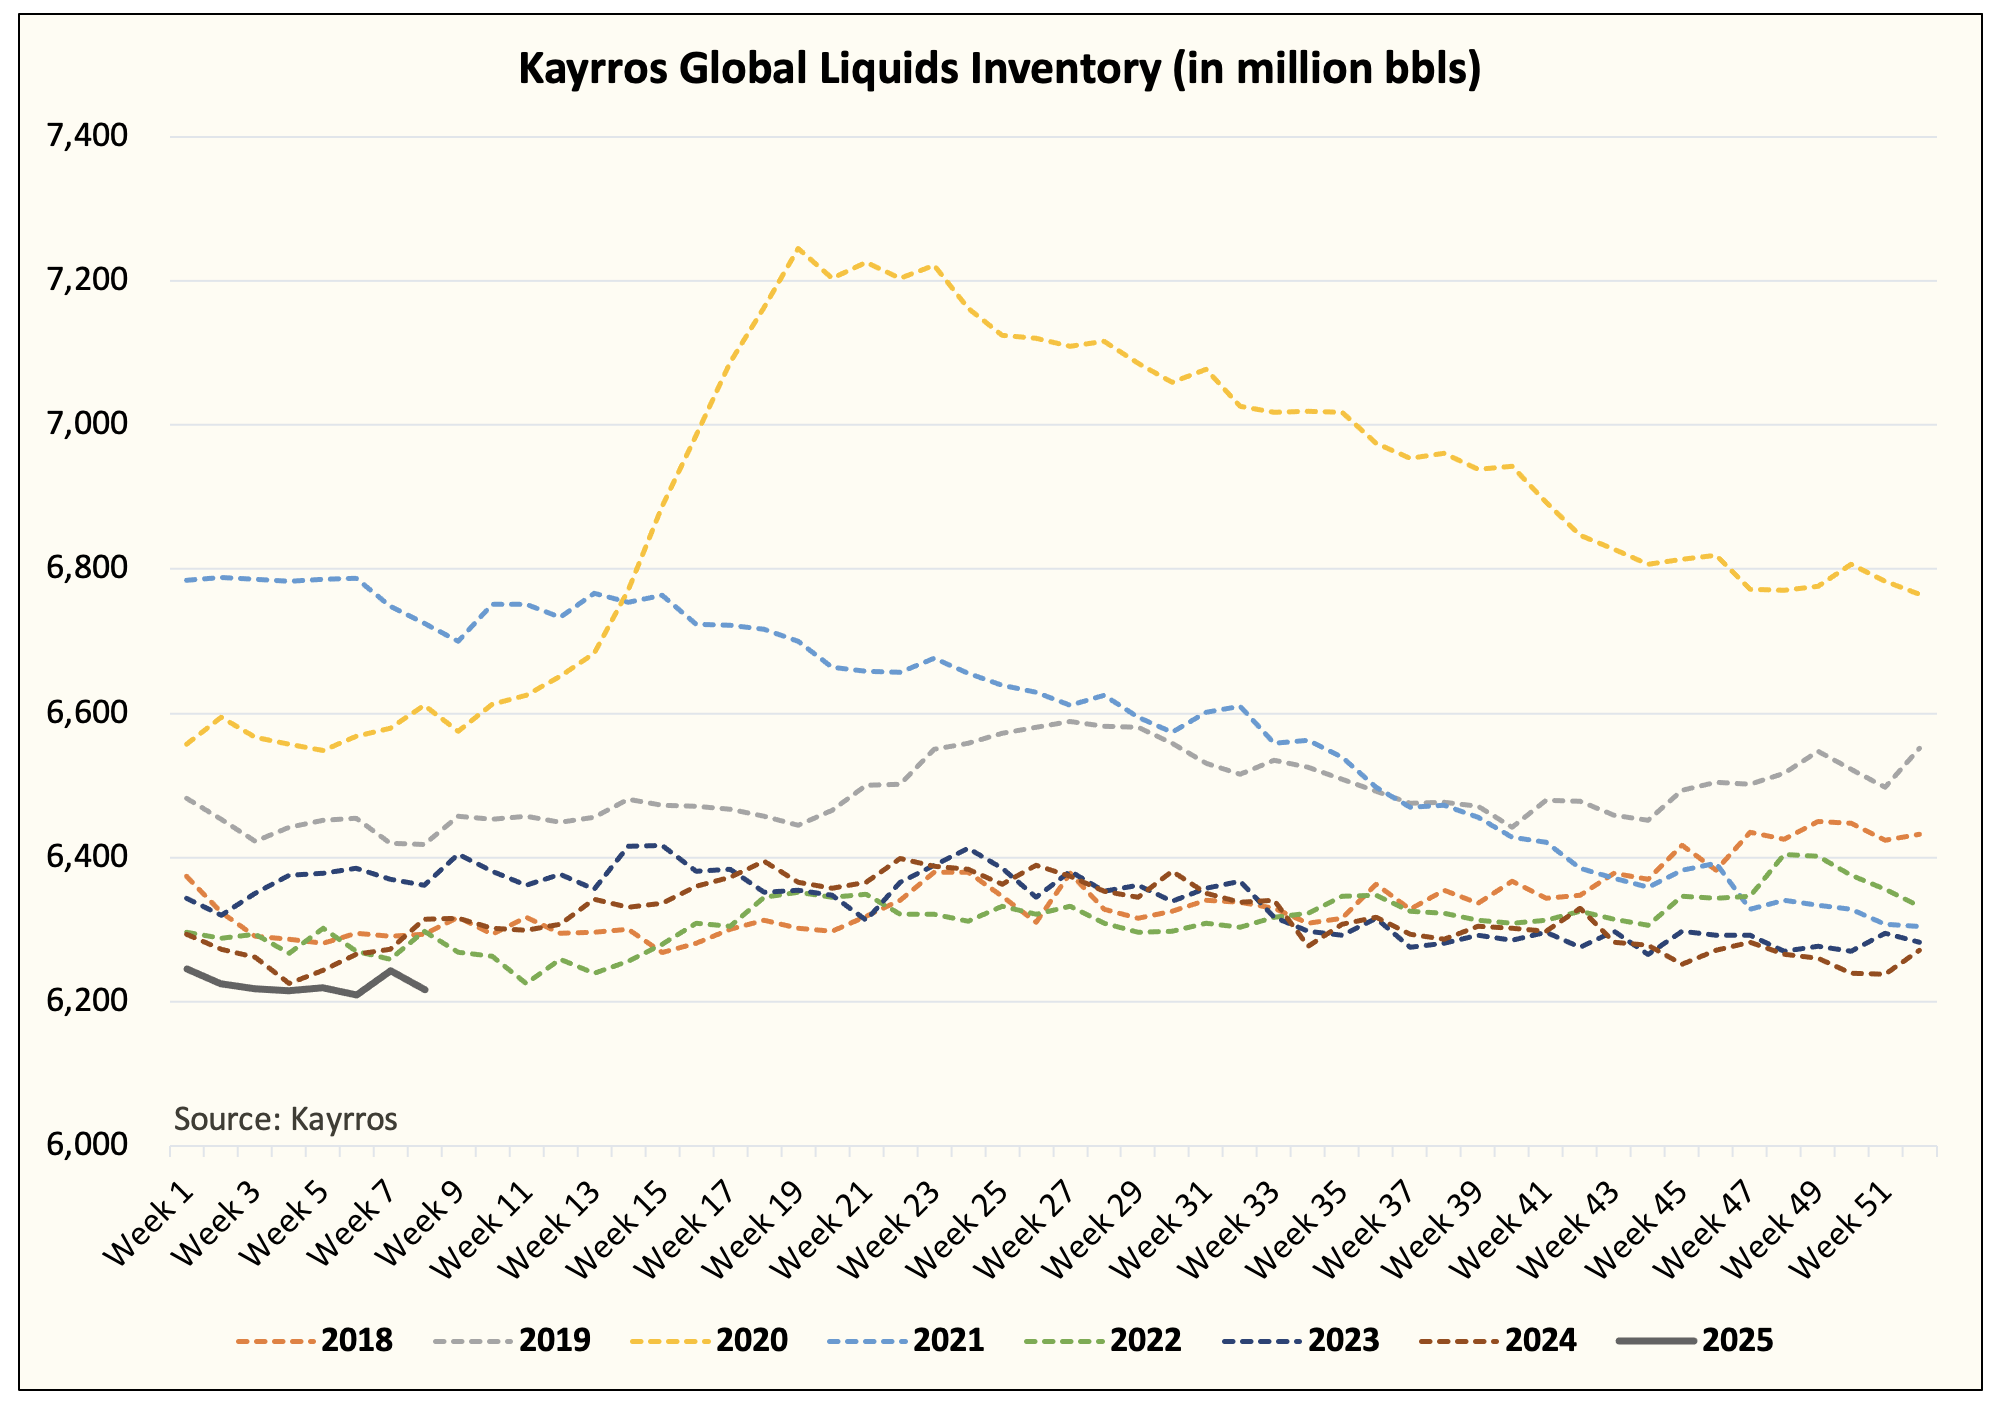
There are a few ways we can track global oil inventories. The first method is to look at US total liquids to derive an implied oil market balance. The second method is to look at satellite storage providers like Kayrros to gauge implied supply/demand.
Using the second methodology, you can see that Kayrros data is showing YTD global liquids to be flat.
Looking at US total liquids, inventories have declined ~18.214 million bbls to date amounting to an implied deficit of 0.325 million b/d.
But if you look at the US oil data closer, product storage is up 17.925 million bbls since the end of 2024.

And crude is up 14.56 million bbls.

This puts the combined total of crude + big 3 products at +32.485 million bbls. This is bearish right?
Not so fast.
The build we saw in crude storage at the end of January into February was the result of 1) lower than normal US crude exports due to tighter Brent-WTI spreads and 2) lower than normal refinery throughput.
As we wrote in our US crude storage outlook, we expect US commercial crude storage to reach ~440 million bbls due to the incoming refinery maintenance. This should, however, translate to lower product storage going forward.
But what's up with product storage?
This week's EIA oil storage report showed a build of 4.952 million bbls versus the 5-year average draw of 7.302 million bbls. Is it because demand is bad?
The answer is mixed on this one.

If you look at the implied US oil demand figure for the big 3 products, we are trending higher than last year. In theory, strong implied demand should result in lower storage, but we are not seeing that.
This week's product storage build was fueled by the 1.64 million b/d week-over-week drop in product storage. So there's a bit of timing mismatch there. But what's a bit concerning for us is that despite low refinery throughput (~15.7 million b/d), we are not seeing higher refining margins.
While refining margins are off the lows from January (thanks to the sell-off in crude), the weak price action suggests to me that there's an inherent weakness in demand, which oil bulls will need to pay attention to closely.
Where are the draws coming from?
The draws from US total liquids are coming from propane/propylene and other oils. For other oil, the draw is seasonal, while the draw in propane/propylene is due to higher-than-normal heating demand.
Propane/Propylene: -33.497 million bbls

Other Oils: -22.28 million bbls

As you can see, the draws are not happening in the critical regions of the oil market, which is why you are not seeing it being reflected in the price. While from a fundamental balance (NGLs are part of the total liquid balance), the total liquids draw appears to be bullish, oil bulls have to acknowledge the draws are coming from other segments of the market.
As a result, we think the Kayrros chart best captures the dynamic in the market we are seeing.