

I have more questions than answers.
I am going to present you with three charts, offer some explanation, and I want you to try to make sense of this.
The first chart is the Brent short position versus global onshore crude oil inventory:
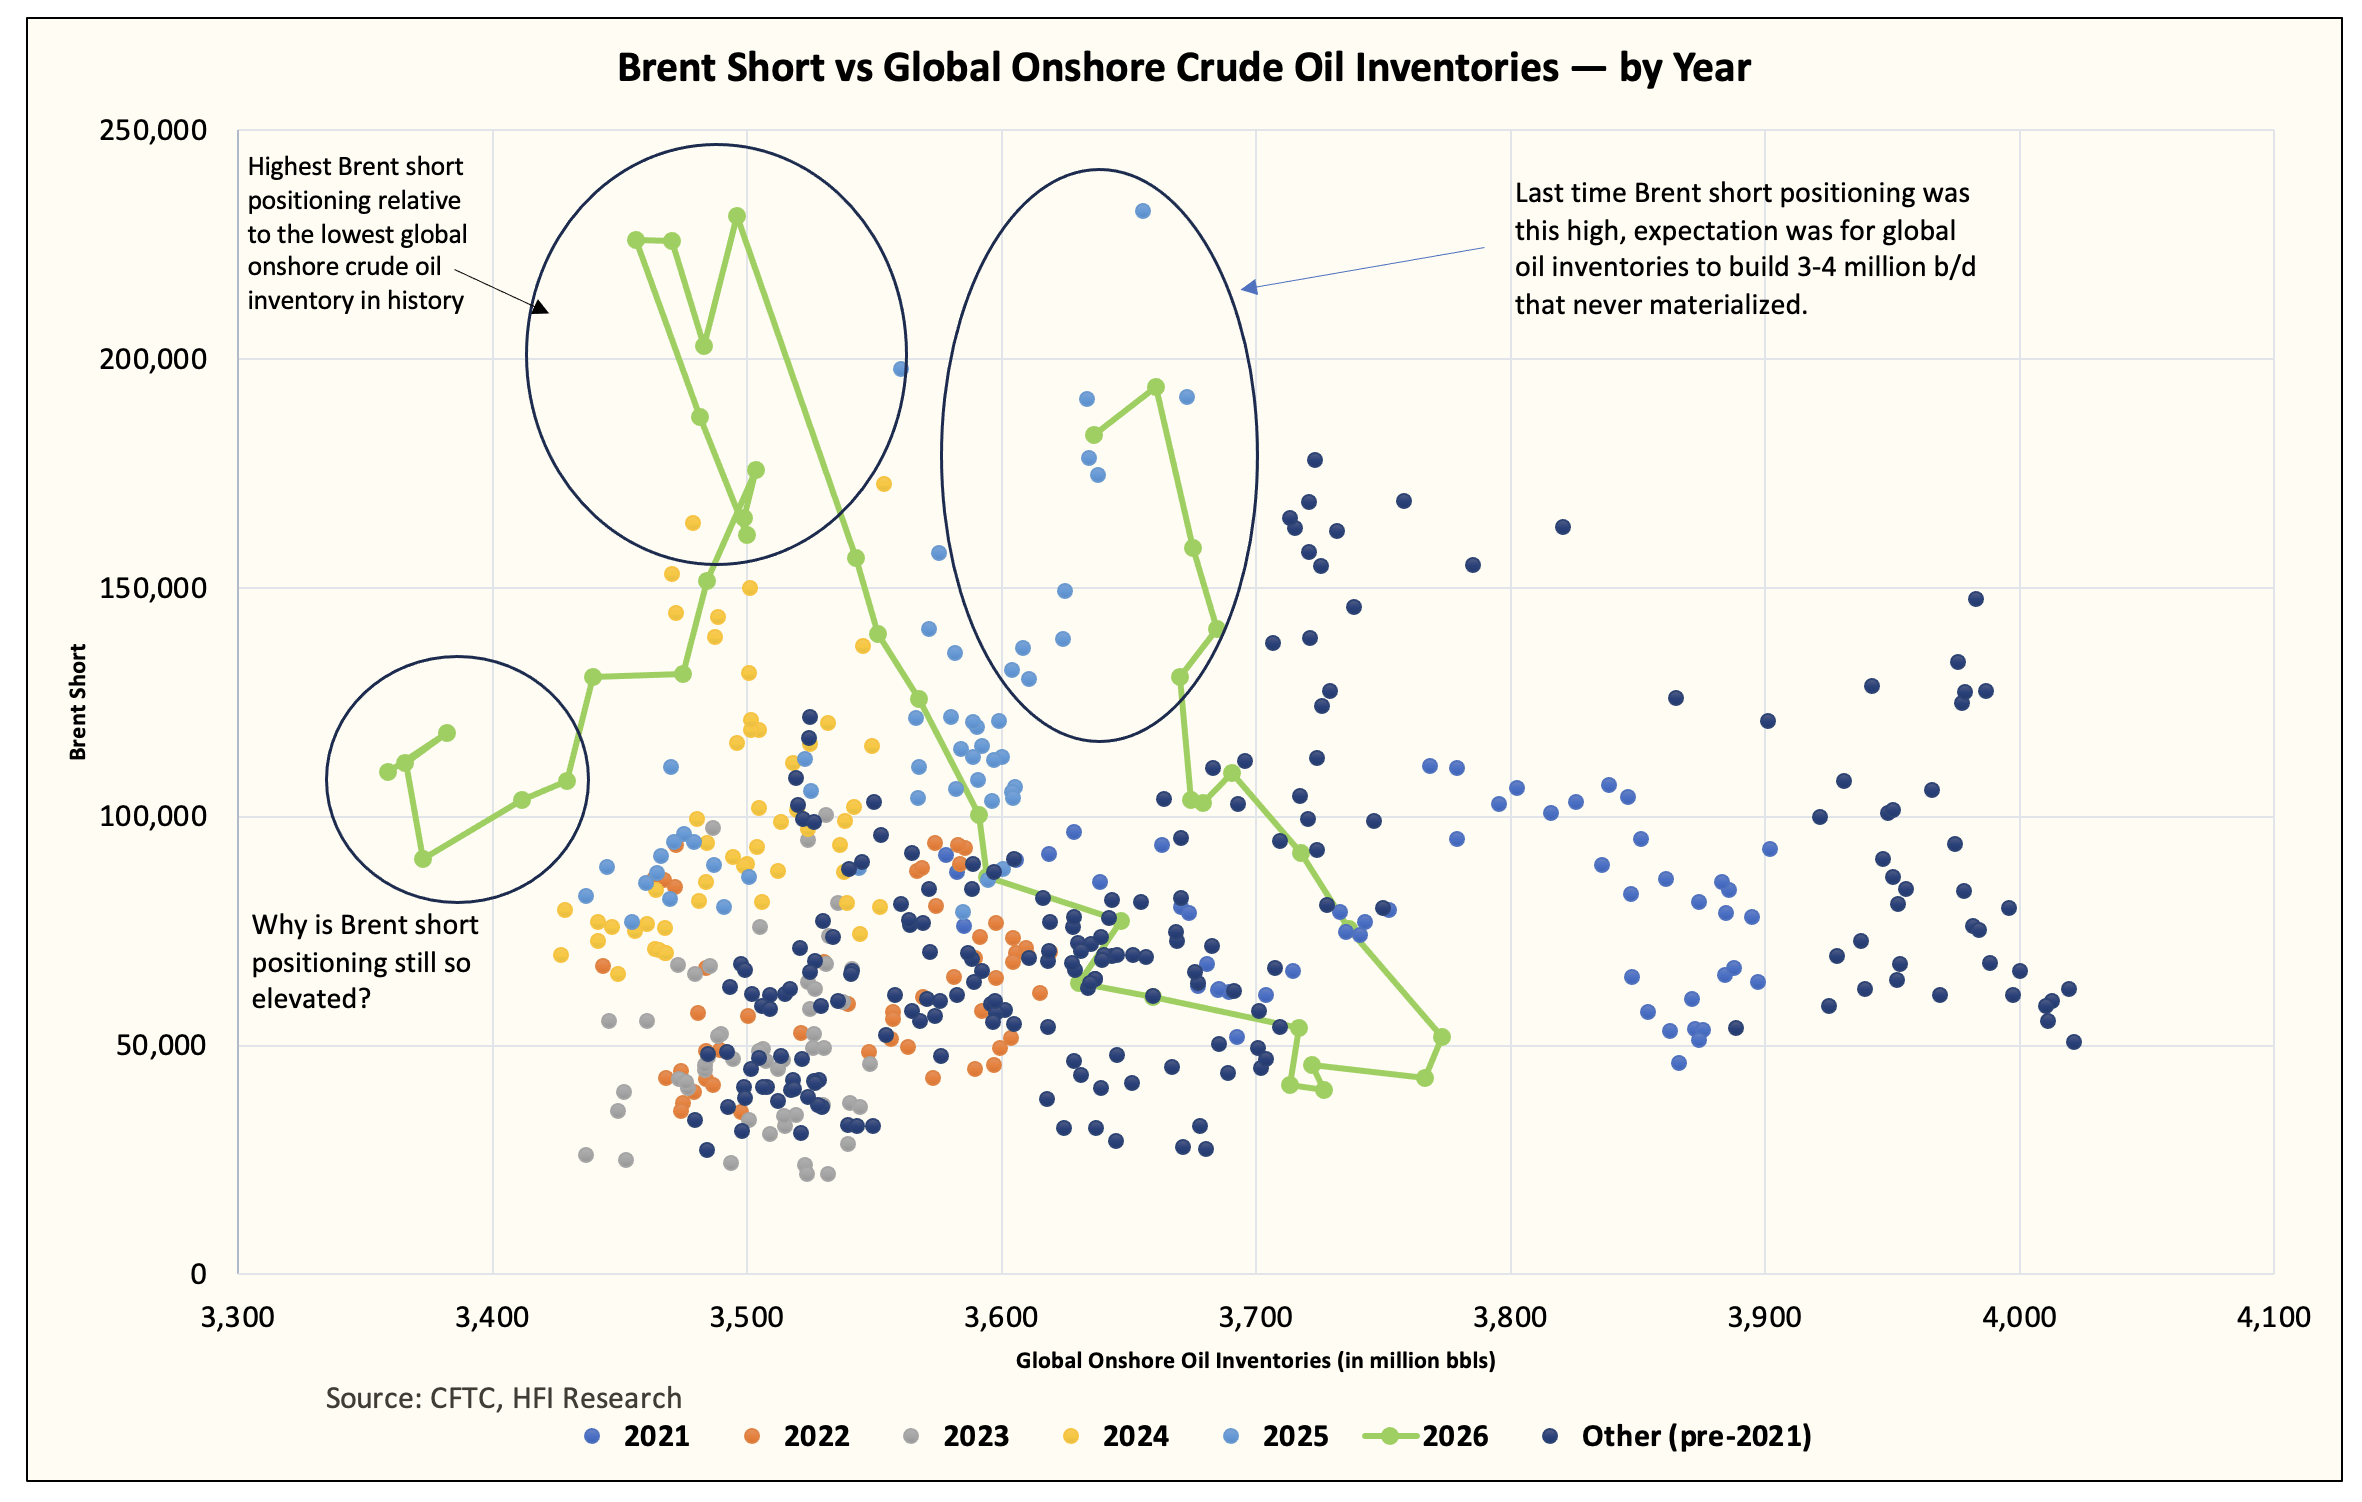
This is the first time in history with the lowest visible onshore global crude oil inventory data and the highest relative Brent short positioning.
We first saw the craziness unfold in July, when Brent short positioning was just a hair shy of an all-time short record. At the time, I noted that the positioning suggested a surplus of 4-5 million b/d that never materialized. As evidenced by the chart above, global onshore crude oil inventories have trended even lower since then, making this particularly high short positioning questionable.
The second chart is the Brent net long (non-commercial) positioning relative to global onshore crude oil inventories:
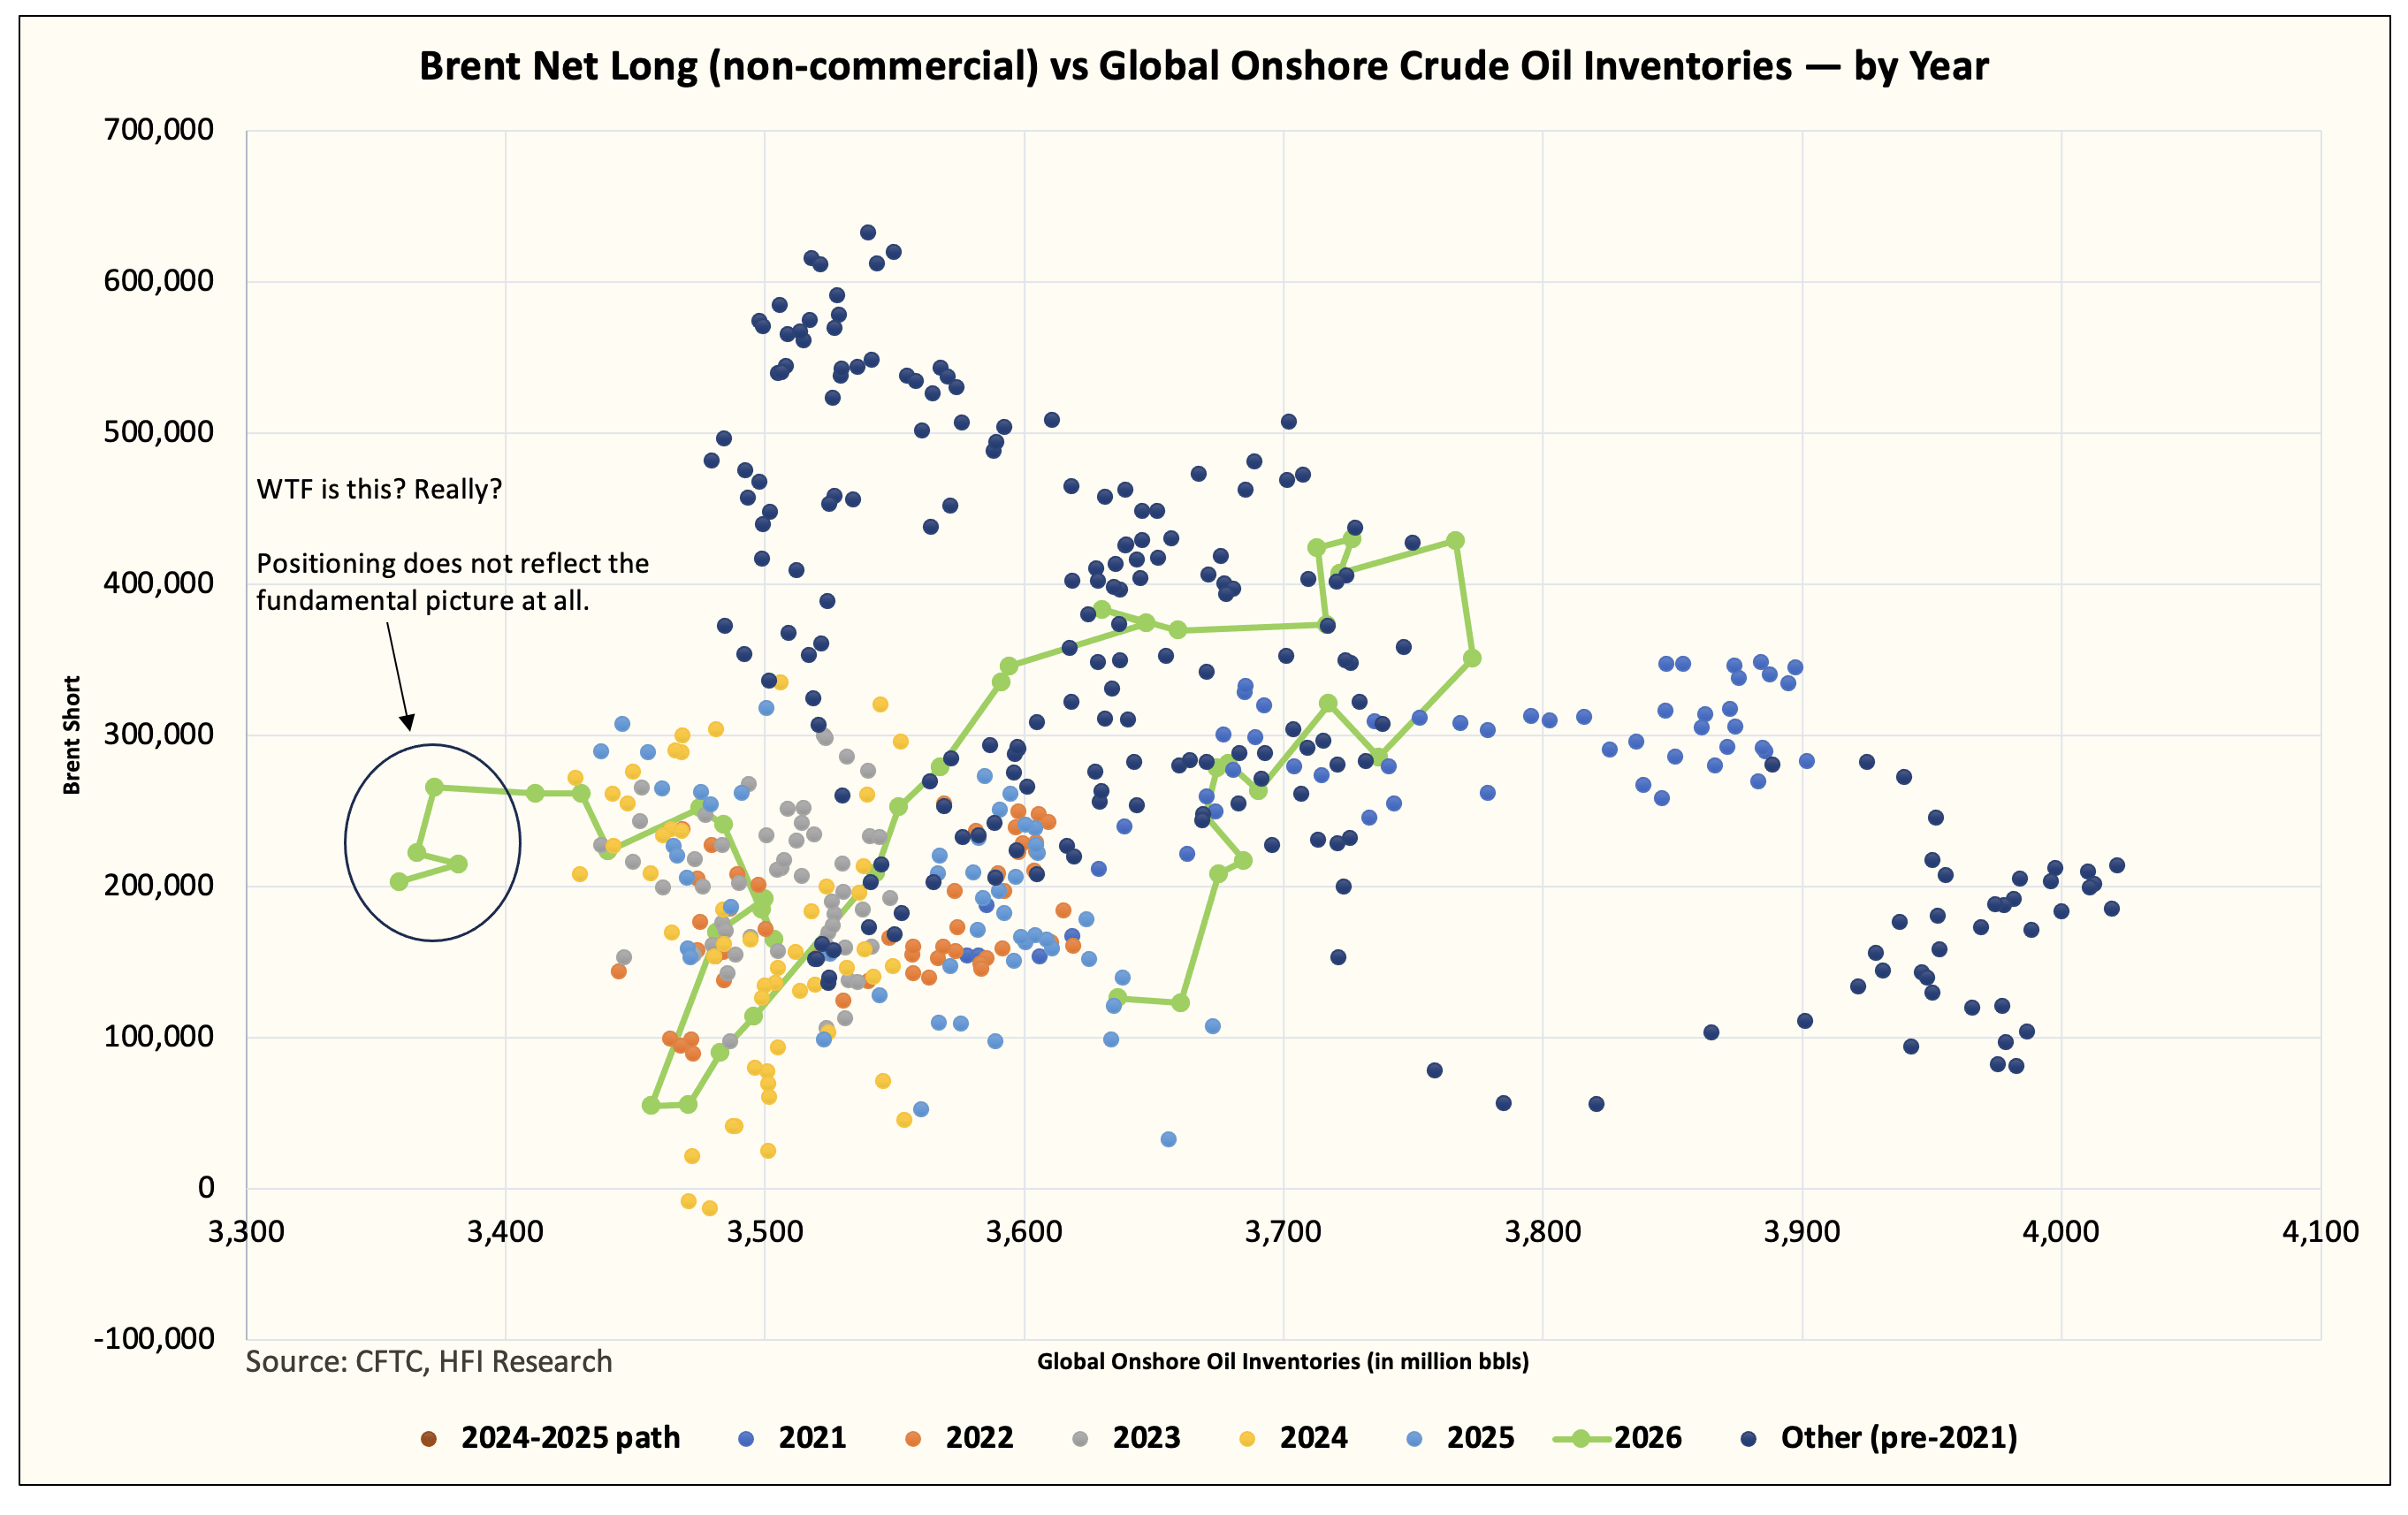
Once again, we see something fascinating. You will notice some of the earlier years had 1) higher total onshore crude oil inventories and 2) 3x the net long positioning versus today.
Yes, both 2018 and 2024 had higher net long positioning with 1) less of a supply risk and 2) higher inventories.
Again, why is the market so bearish? I don’t know. But the lack of net long positions presents more questions than answers.
The last chart is more straightforward; it’s just the Brent price versus global onshore crude oil inventory. And you probably guessed it:
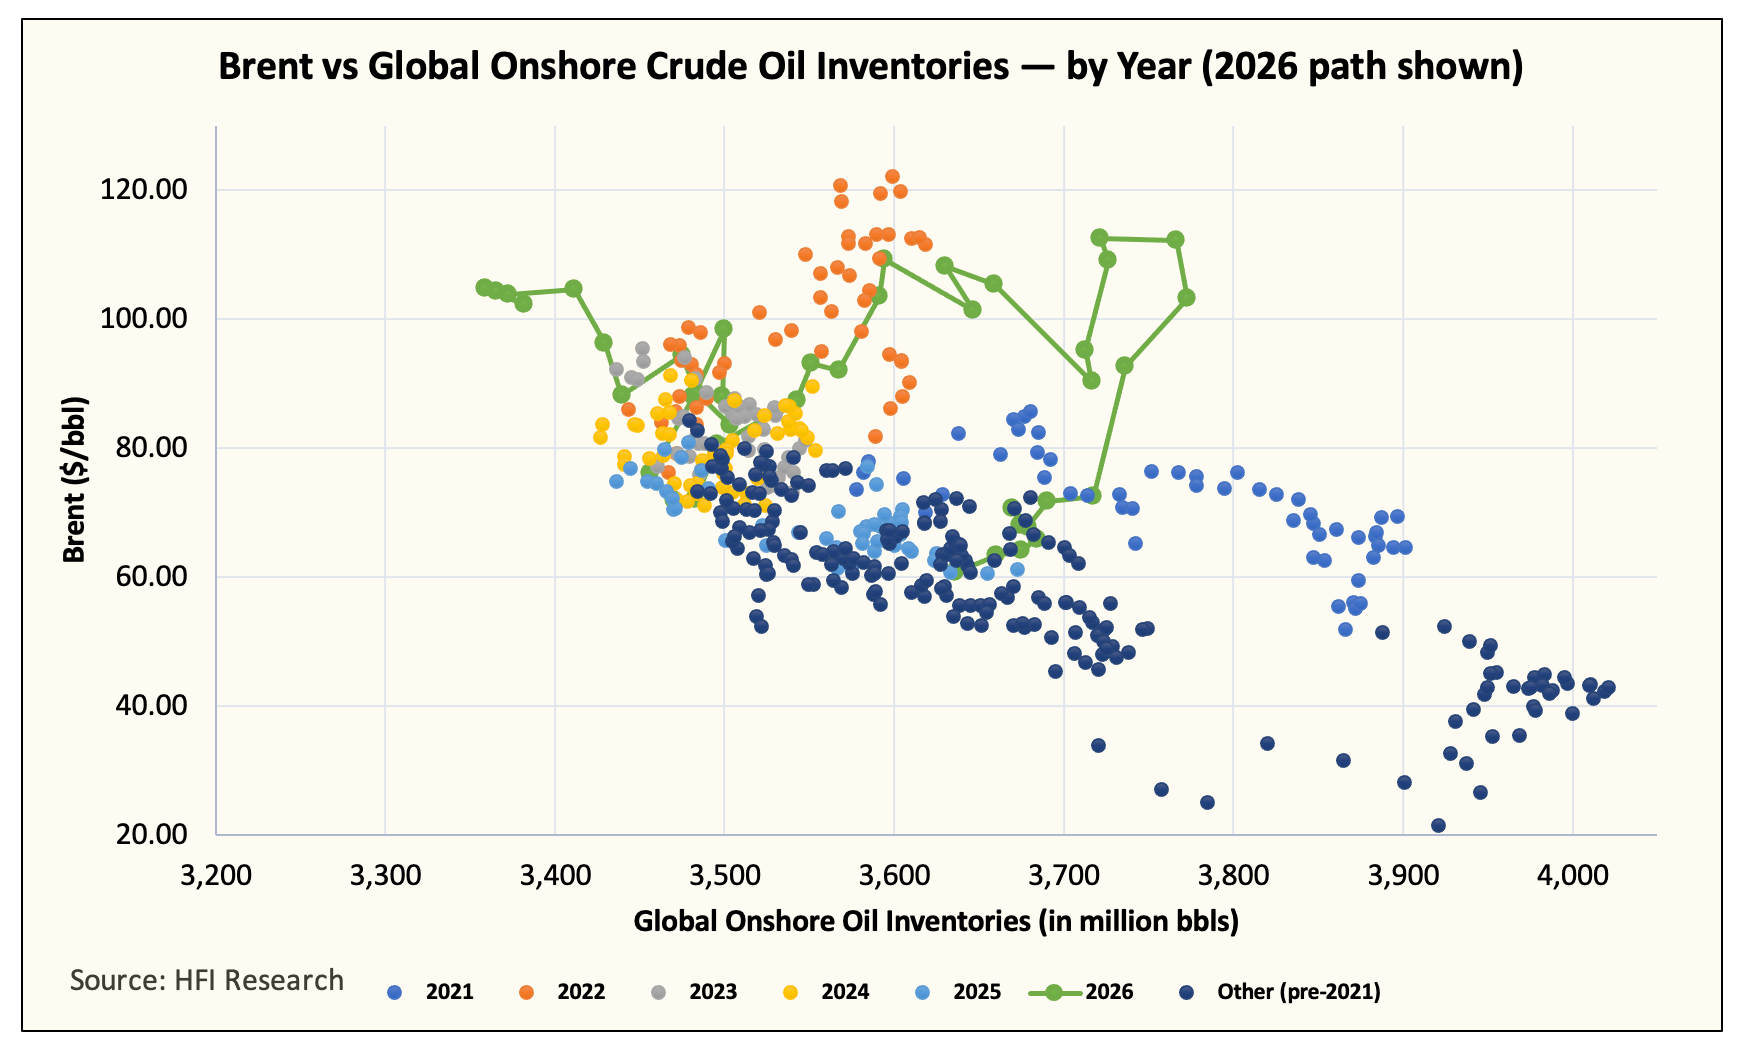
I think this chart is self-explanatory. In 2022, prices were higher and inventories were higher. This year, prices have stayed around $100/bbl, but inventories are low and headed even lower.
Possible Explanations
Let’s work backward. In June, when I presented the positioning data, I interpreted what the market was trying to say. In today’s case, the market is effectively saying:
The geopolitical situation is transitory.
Global onshore crude oil inventories will build if the geopolitical situation is resolved.
For most people, Brent staying around $100/bbl might look like the bears are right, but the reality is that backwardation has wiped out anyone who was bearish.
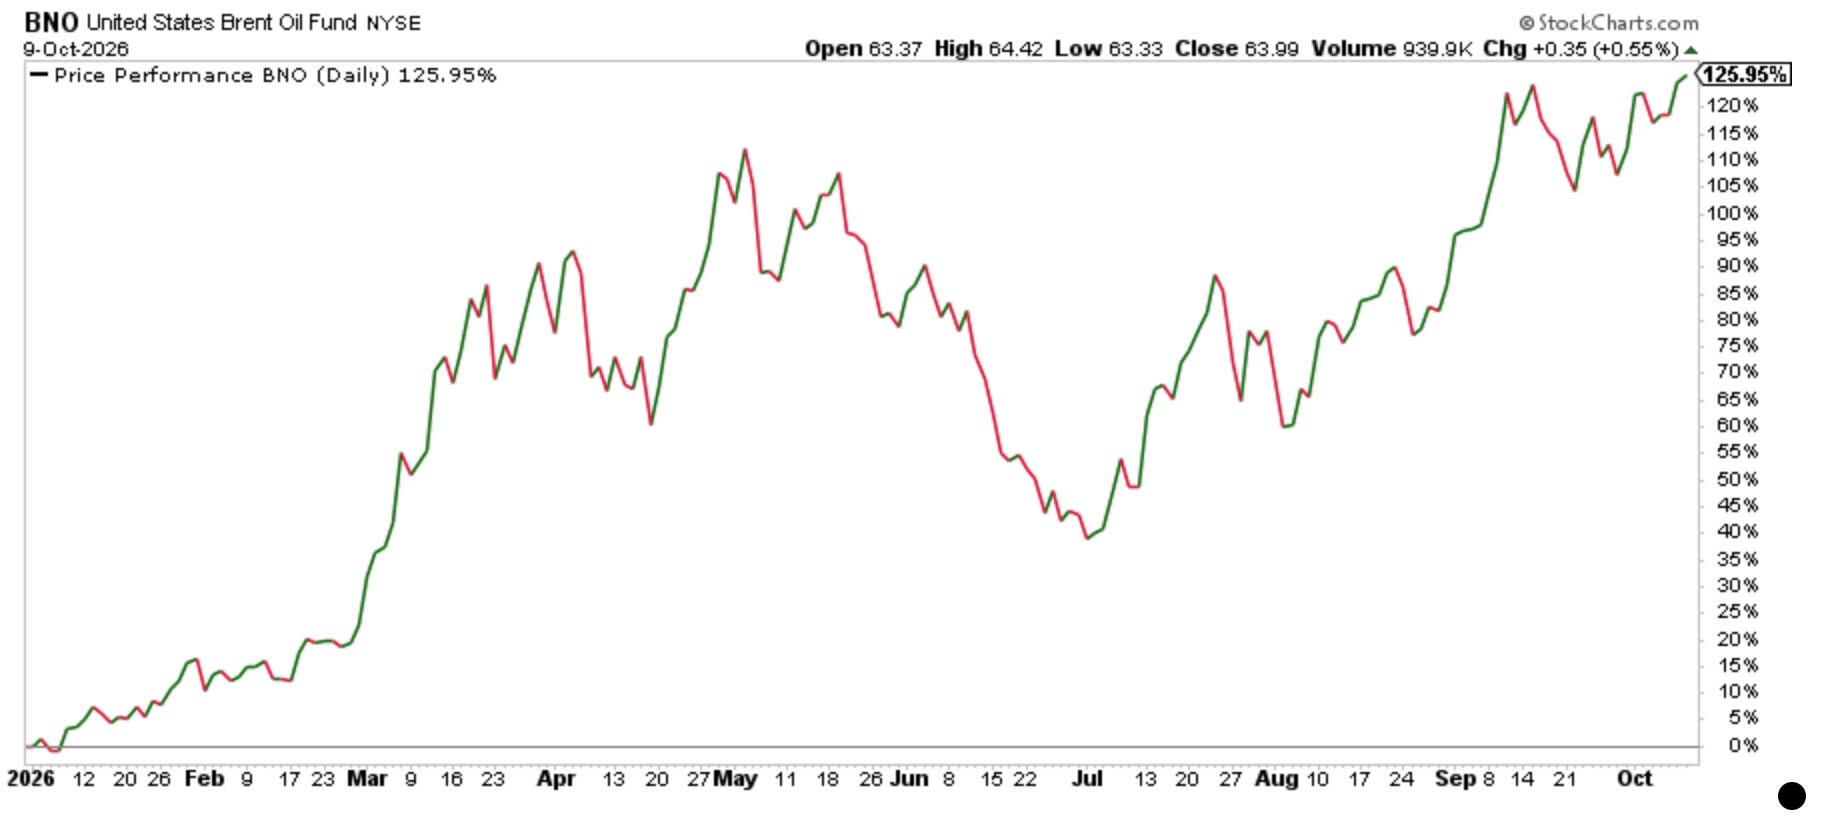
BNO, the ETF that automatically rolls Brent futures each month thus capturing the backwardation yield, is at an all-time high today. Despite the nonsense we saw in the June MOU and the subsequent sell-off, backwardation is a real killer for the bear thesis.
That is why it is strange that Brent short positioning has remained so elevated since July. I have asked this question to other oil traders, and their response was along the lines of “that the short trade is part of a bigger pair trade in the oil complex.”
Yes, that could be true given elevated crack spreads, but WTI, which is physically settled unlike Brent (cash settled), has not seen the same type of short positioning.
In fact, anything in oil that is physically settled has not seen this type of short positioning... Which, again, brings up a lot more questions than answers.
Breaking Records
If the elevated short positioning rests on the assumption that this geopolitical event (Iran war) will end soon, I don’t think these bears will like the outcome very much.
What’s clear to me is that global oil inventories are headed lower now that we’ve seen Peak Hormuz, and I don’t think the oil prices are reflecting just how dire the current situation is.
We are going to break some records.
Analyst’s Disclosure: I/we have a beneficial long position in the shares of USO, UCO, BNO either through stock ownership, options, or other derivatives.