

Editor’s Note: This article was first published to paying subscribers on June 26, 2025. We have since updated the oil market fundamentals in this write-up.

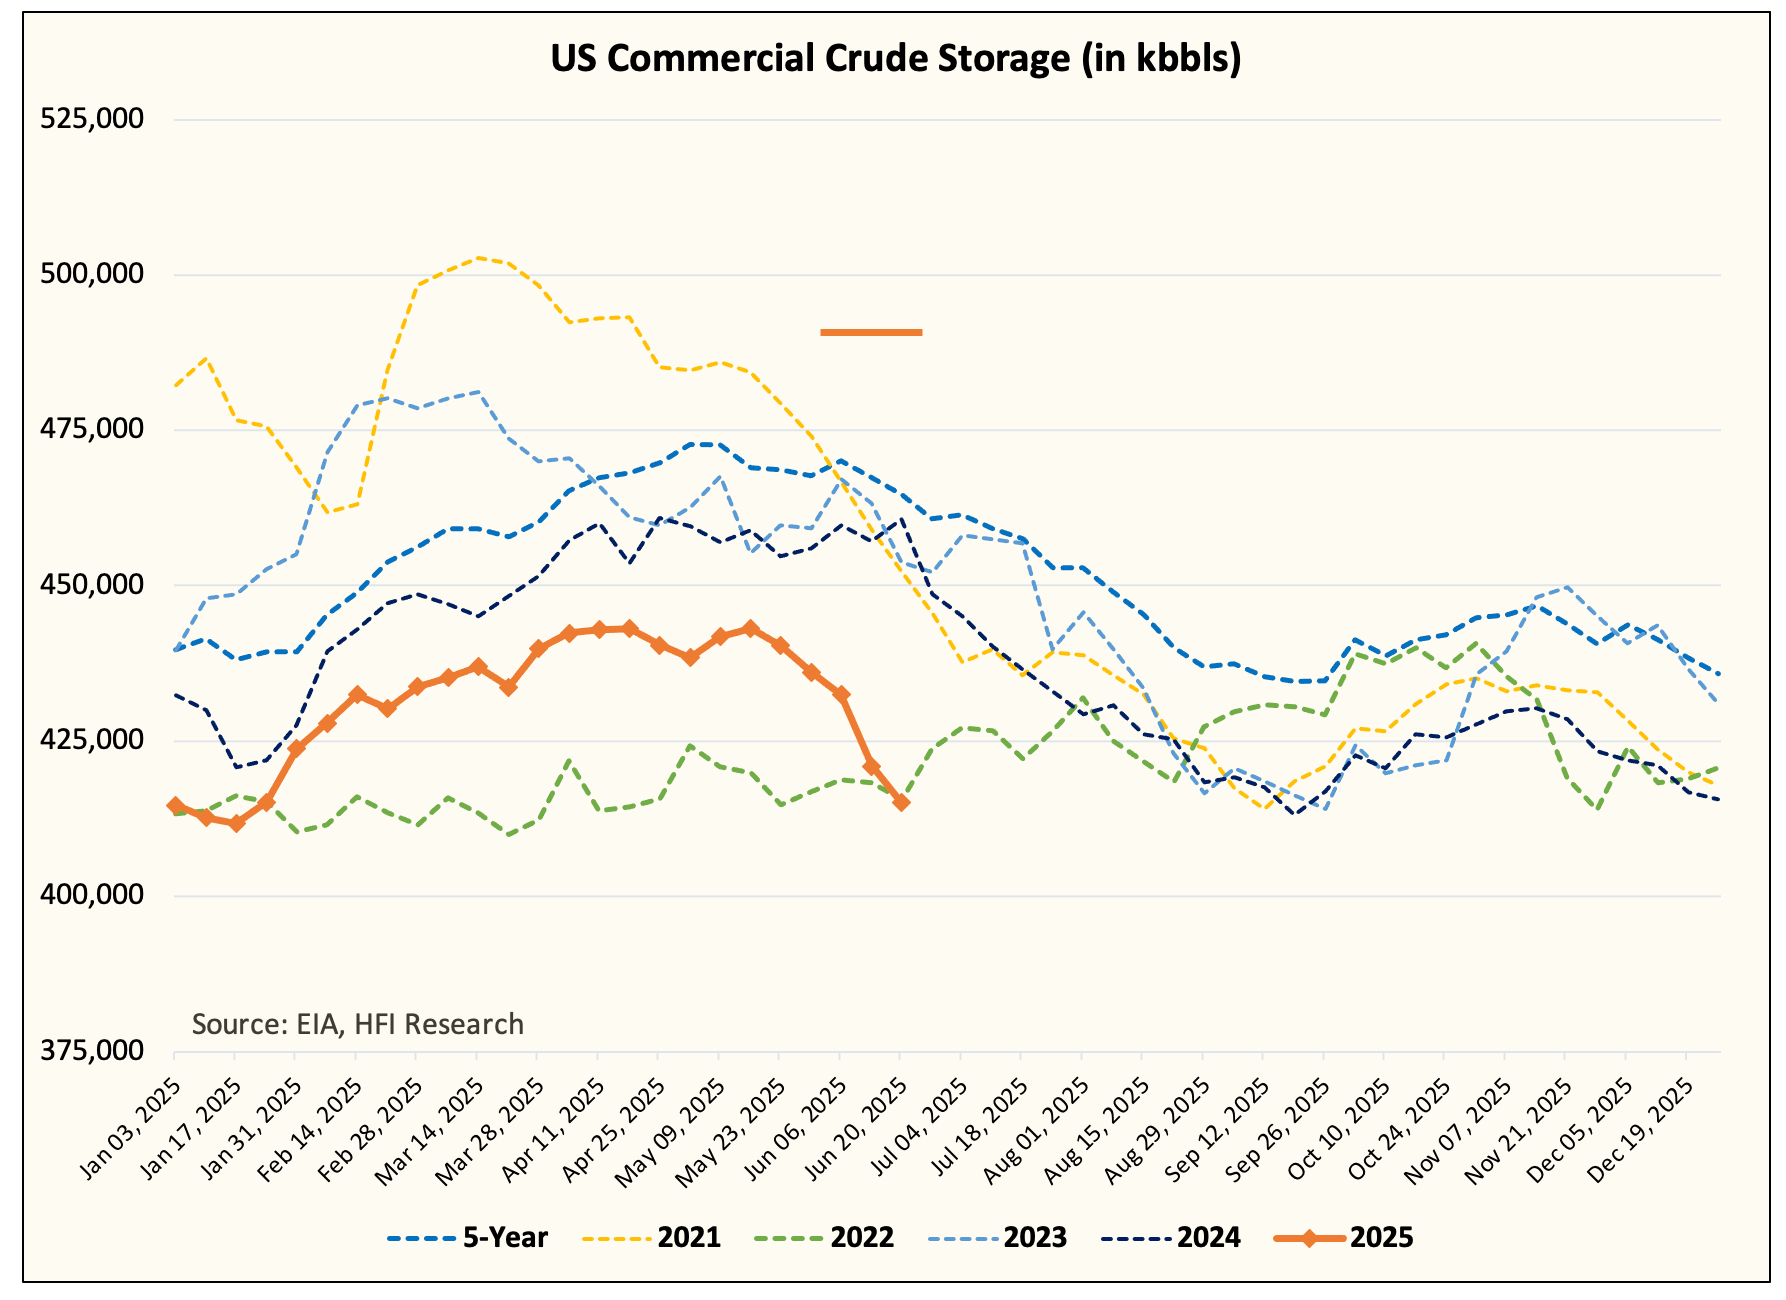
The oil market is entering an interesting dichotomy. On one end, visible inventory figures like the one from EIA show an unbelievably bullish setup going into the summer draw months.
Crude Storage

Crude + 3 Products

On the other end, high-frequency data shows that there are inventory builds in non-OECD, and global oil inventory balances are still higher YTD.
Global

Source: JPM
OECD

Source: JPM
But in light of the contradiction in the two datasets, one question we must ask is, "Dude, where's the oil?"
Because let's face it, non-OECD inventories are murky at best. They aren't from official government sources and are subject to change after the fact. And even after the geopolitical risk premium evaporated from the oil price, timespreads remain steeply backwardated.
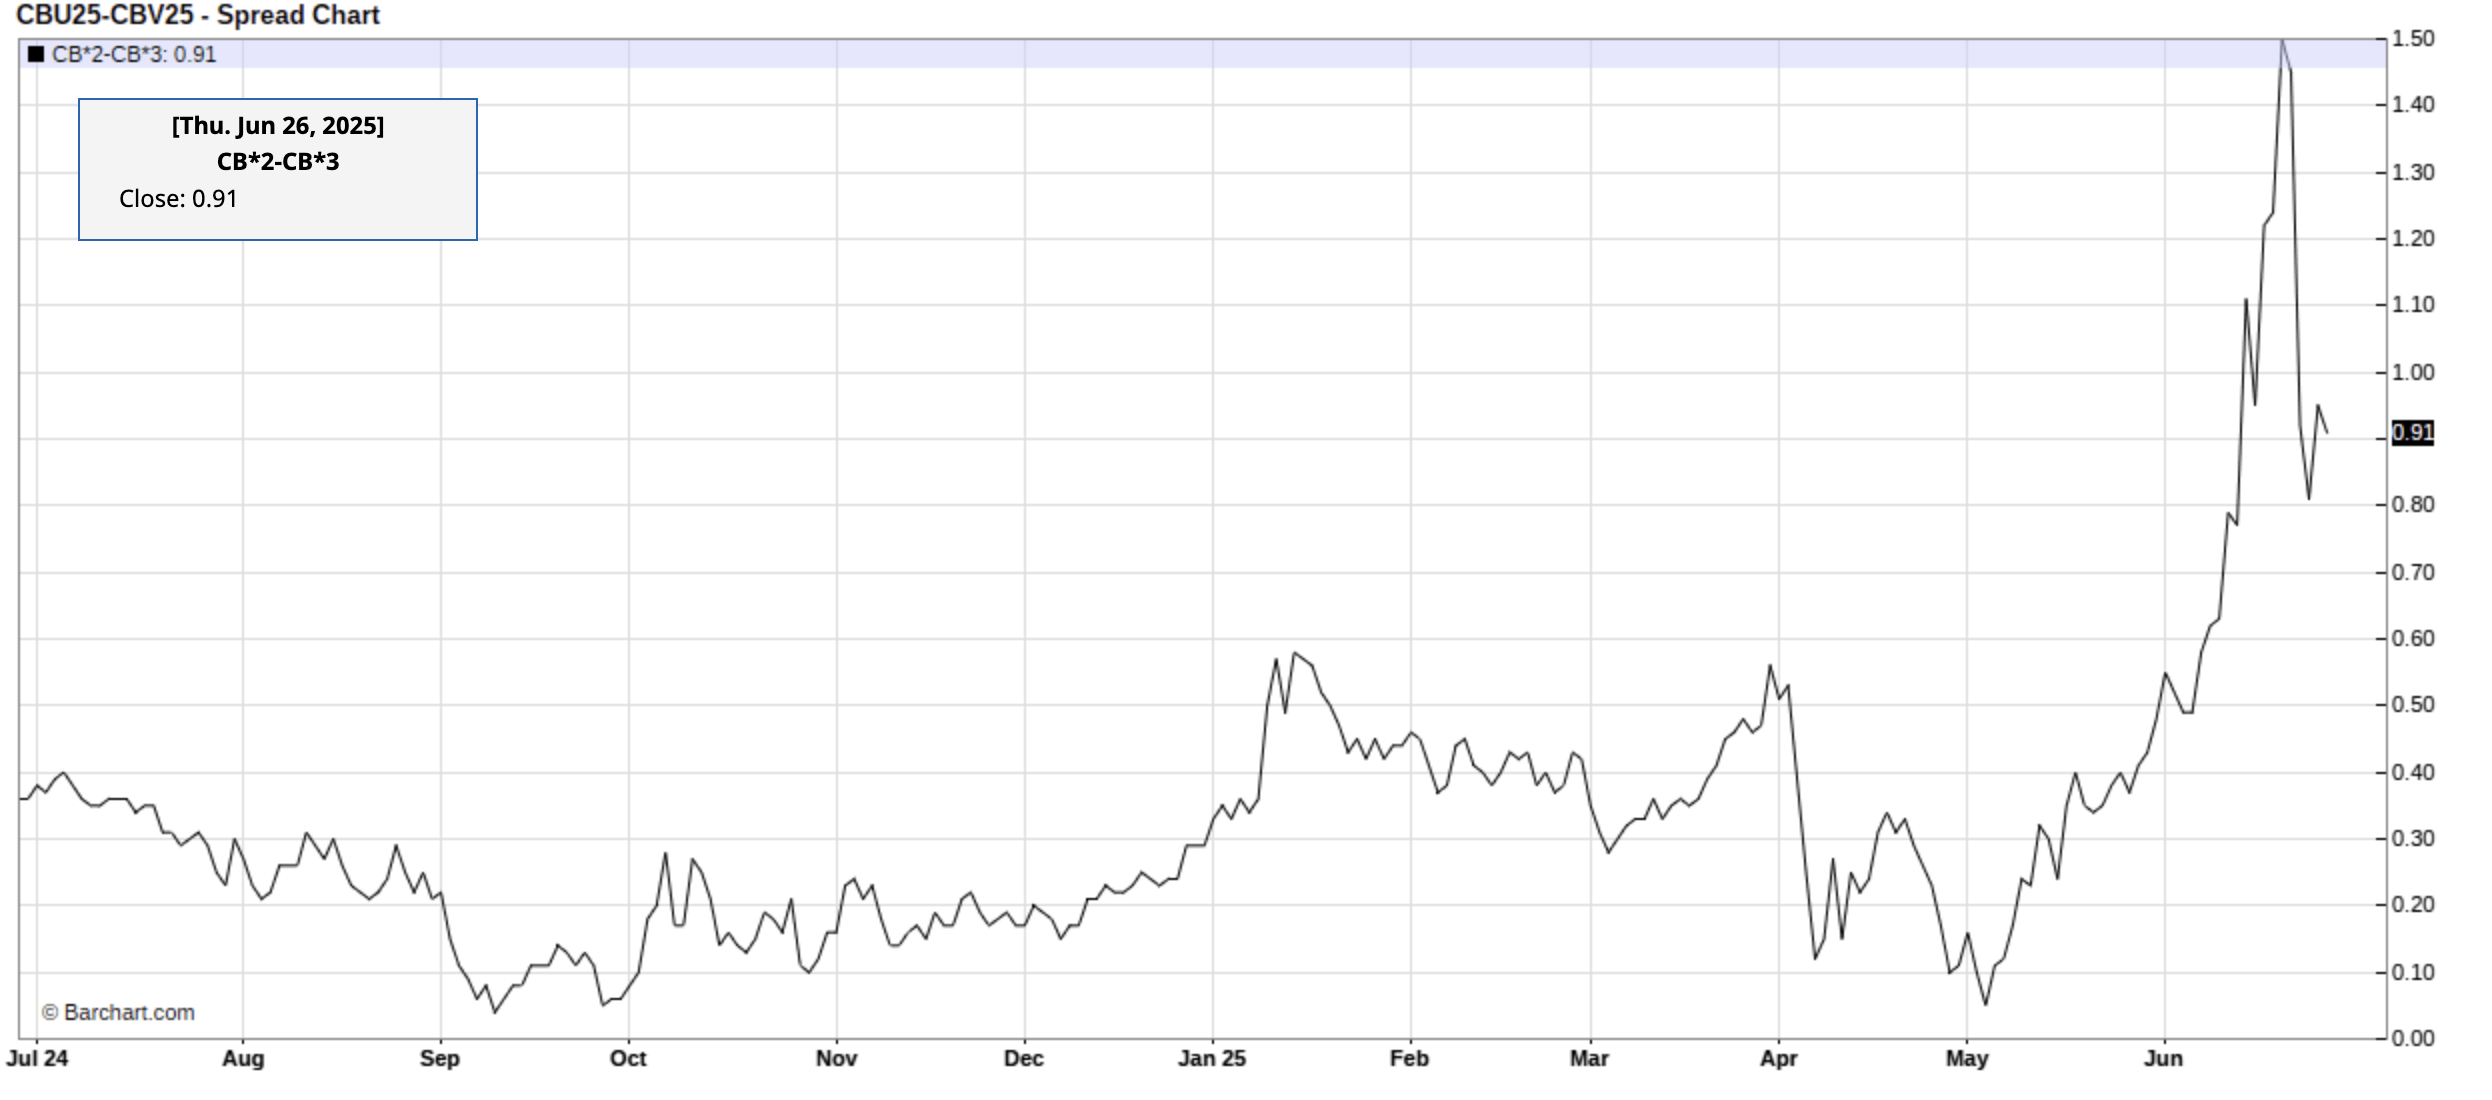
Source: Barchart.com
This is despite the fact that OPEC+ crude exports are higher month-to-date vs May by ~800k b/d. And if the global oil market is indeed "massively" oversupplied like the IEA and sell-side analysts contend it to be, where's the oil?
A More Realistic Look
Since the beginning of this year, we said that the massive surplus the consensus was expecting would turn out to be a false alarm. One of the main fundamental variables that the consensus is getting wrong is US crude oil production.
If you look at the current global oil inventory landscape, for example, the US is showing the tightest inventory balance out of everyone. China is showing the weakest implied balance likely due to a combination of weak domestic demand and elevated crude imports (from Iran).
The US market is the most transparent, and despite the many criticisms we have of the EIA, it is still by far the best energy agency on the planet (relative to others).
So the tightness we are seeing in US crude storage is, first and foremost, the phenomenon we've been pounding the table on for the last 18 months, US shale is disappointing to the downside.

In fact, here's the number to illustrate our point. From January to June 2025, the consensus expected an average US crude oil production figure of ~13.45 million b/d. Many of the estimates we've seen show a production figure of ~13.6 million b/d for Q2.
For our dataset, we have a raw average of 13.287 million b/d. If you exclude condensate, the average is ~13 million b/d.
Now, what's funny is that if you take the delta between the two figures, you get 0.45 million b/d, and over 26 weeks, you get a total delta of 81.9 million bbls.
That delta is the precise difference between where people thought US commercial crude storage was headed versus where it is today.
With that said, where are we headed?
But with everything in the oil market, there's a caveat.
Despite the bullish US oil inventory figures above, you may ask, "Why aren't oil prices higher?"
Well, there are a few important reasons:
OPEC+ is set to meet and will likely conclude another truncated production increase (+411k b/d), followed by another one at the end of July. This will conclude the end of the voluntary production curtailment. OPEC+ crude exports are higher MTD versus the pre-production increase policy, so oil traders are concerned about more supplies.
Low oil prices are needed to keep US shale from increasing production. We estimate that WTI would have to average $60/bbl for US crude oil production to decline into year-end. At current prices, supplies will be flat.
US tariff threats remain on the table with only 1 deal signed so far. Other countries have not agreed to a more comprehensive trade deal, which will cloud demand certainty.
For oil market participants, the reality from now to year-end is straightforward.
Global oil inventories will have to draw in Q3. If so, the size of the draw will be revealing of 1) implied demand and 2) implied supply. A bigger draw will foreshadow a smaller build in Q4, etc.
How much does OPEC+ increase production from now to September? The September OPEC+ crude export figures will be the most widely watched figures in the trading community.
US crude oil production velocity going forward, do we decline more from here, or do we stay flat? This will have an overriding impact on how market participants view the "balancing" price.
As a result, even if global oil inventories draw in Q3, the impact on oil will be limited given the uncertainties in the other 2 variables.
But seriously dude, where's the oil will eventually matter...
If, and it's a big if, we managed to escape this temporary oil bear market with global oil inventories relatively flat, we are in for a hell of a rude awakening at the end of the rainbow.
Saudi would be producing 10.5 million b/d, and US crude oil production would be averaging ~12.5 million b/d. And the only way we can prevent significant inventory builds will be dependent on demand, which I suspect will be closer to ~106 million b/d.
If all three variables align and global oil inventories remain near the lower end of the 5-year range, then the IEA will have to coordinate another global SPR release. Commercial inventories will be too tight for comfort, and the increase in price will prompt Trump to tweet about oil every day.
At this point, it will be obvious to everyone who follows the data closely. So yes, where's the oil will eventually matter. It just won't matter that much this year.
Keep this playbook in the back of your head the next time you see a crude chart that looks like it's nosediving off the X axis. There are still headwinds ahead, so it's not all rainbows and flying puppies just yet.
Analyst’s Disclosure: I/we have no stock, option or similar derivative position in any of the companies mentioned, and no plans to initiate any such positions within the next 72 hours.