(Public) Is US Oil Production Surging?
Is US oil production surging? I am certain that if you have been on Twitter lately, you must've seen a few people post pictures of how close US oil production is to the pre-pandemic highs. You can't blame these people for buying into that story. In EIA's latest weekly oil storage report, US oil production was re-benchmarked to ~12.9 million b/d to match the short-term energy outlook update (or STEO).
But what people may not realize is that the EIA weekly US oil production figure has lagged behind the monthly production figures for almost a year. It's funny that it has taken them this long to re-benchmark.
Now before we begin, it's important to remind you of an important update the EIA did to US oil production tracking. On August 31, we published a very important update on US oil production. In that report, we noted that EIA is trying to be more transparent in what goes into the "adjustment" figure.
To make the long story short, EIA pegged US oil production in June 2023 at 12.844 million b/d, 634k b/d was in transfers to crude oil supply (i.e. blending), and adjustment came in at -200k b/d.
Our old formula for calculating "real" US oil production was as follows:
Production + adjustment = Real production
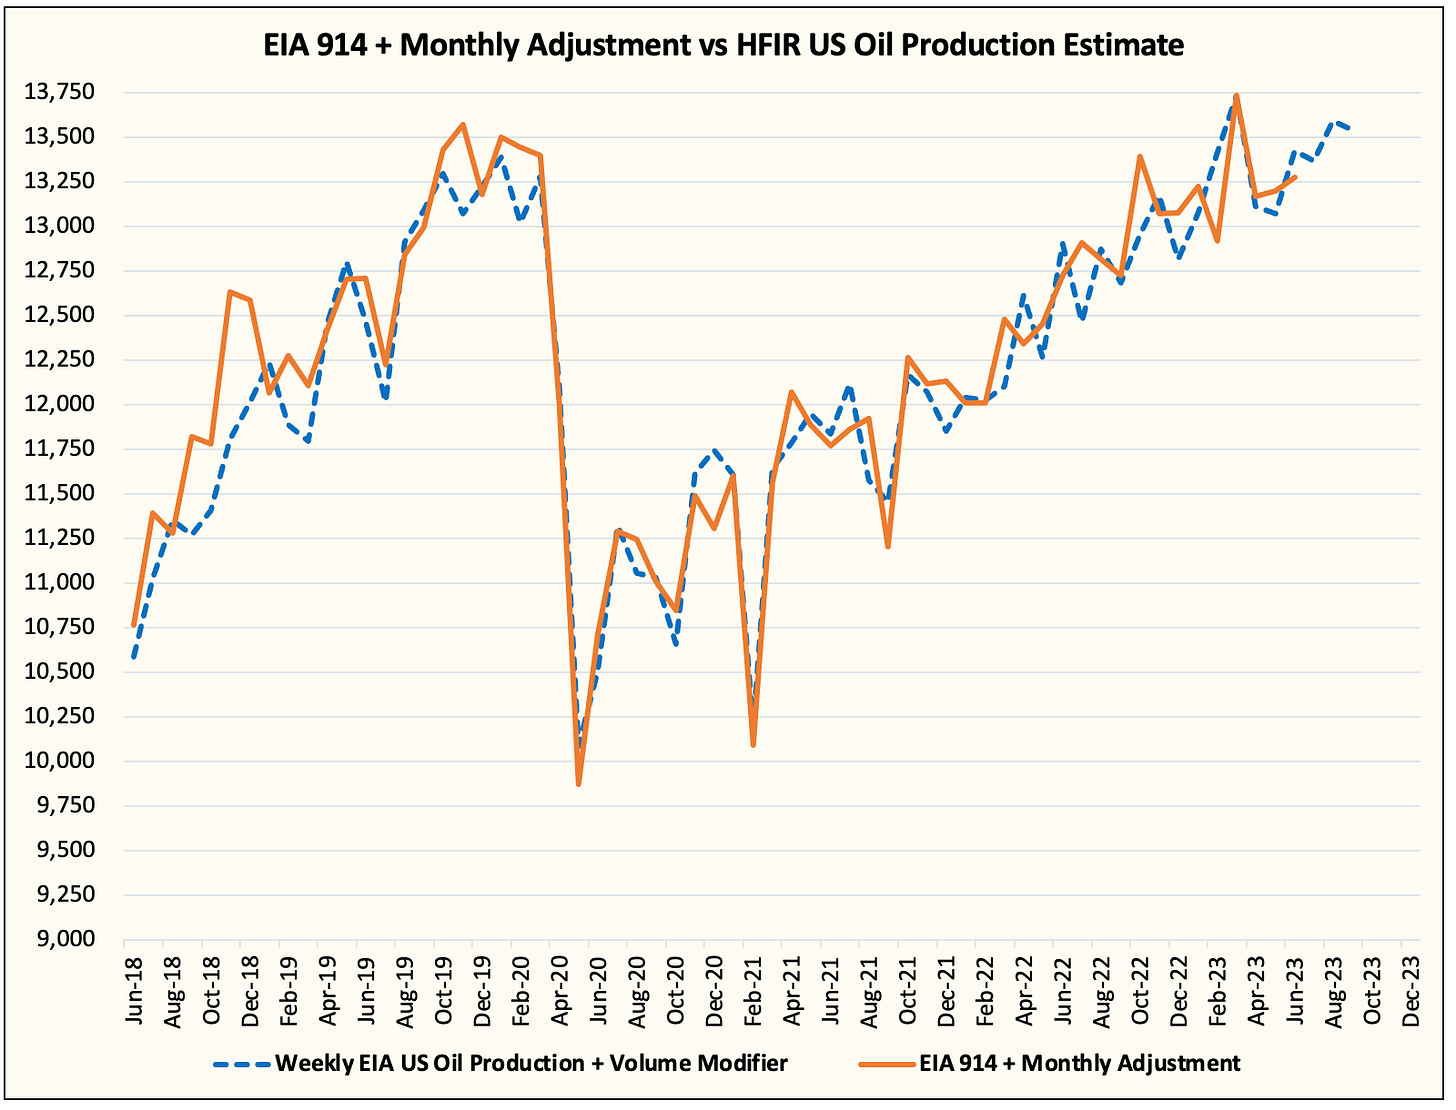
The chart below shows how accurate we are at tracking US oil production:
Now this is where things get tricky. Because of EIA's attempt at being more transparent, they are now in fact overestimating US crude production. Why? Because the adjustment came in at -200k b/d, and using our old methodology of calculating real supply, US oil production in June really came in at 12.644 million b/d.
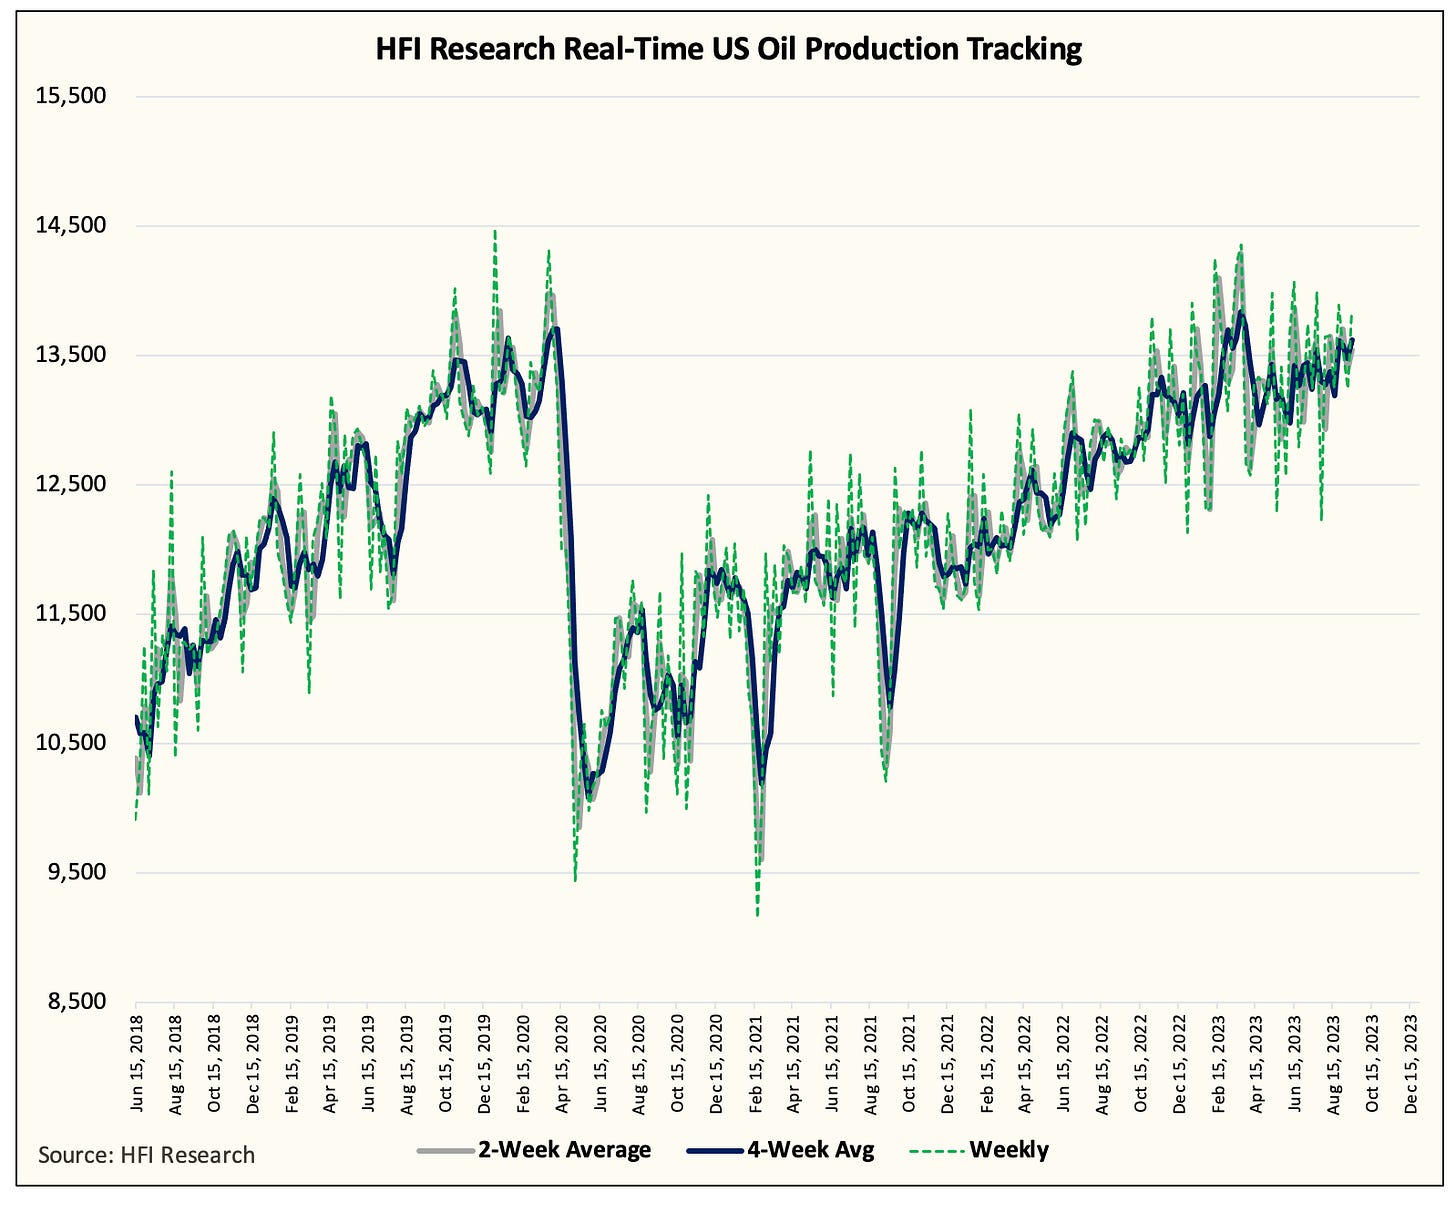
If we circle this back to what we are seeing in our high-frequency tracking data, we find the same conclusion:
There's been no real surge in US oil production since March 2023.
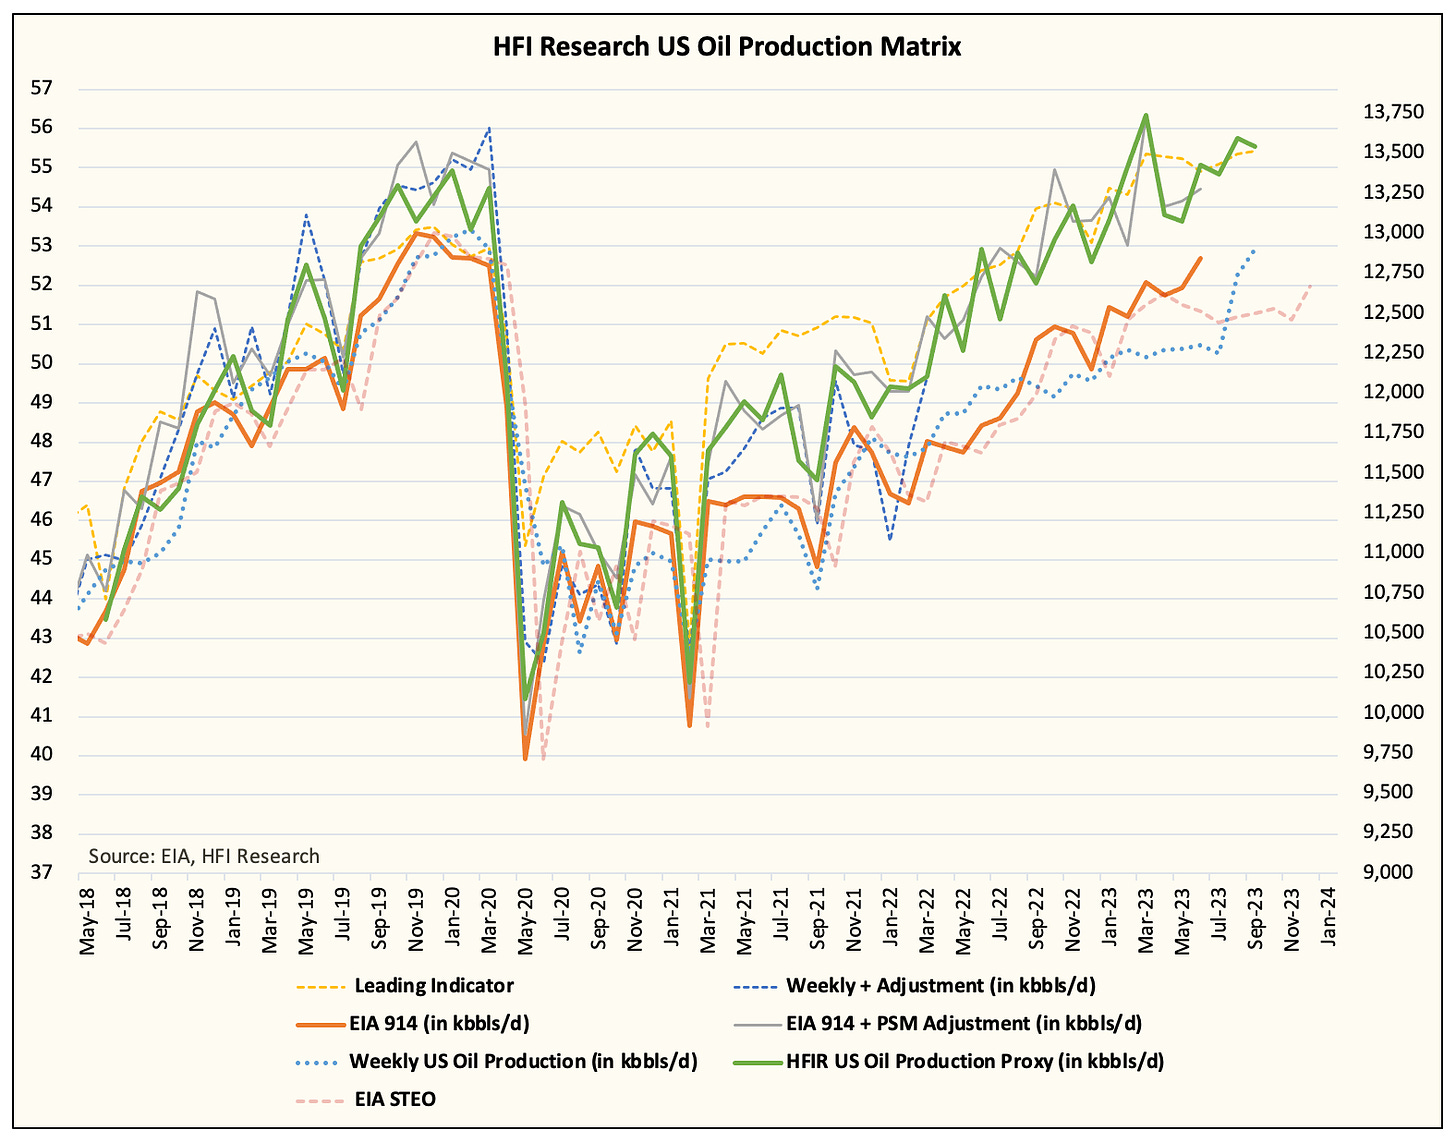
In fact, we can go one step further and look at associated gas production:
(Note: We include adjustment in our production calculation.)
From this dataset, you can find the same conclusion. US oil production is not surging.
What does this mean going forward?
Readers should ignore the noise from the weekly US oil production figures. EIA STEO has US oil production growing to ~13.2 million b/d by year-end. We don't see that happening. As a result, you will notice the EIA adjustment figure in the weekly report trend lower and lower. Last week was a great example of that when the adjustment came in close to zero.
Another way to validate that we are correct about the US oil production assumption is by looking at the weekly EIA crude storage figure change relative to our estimate. If EIA reports a figure more bearish than the one we published, then it implies that production is surprising to the upside. If EIA is more bullish, then it implies that production is lower than our estimate.
Here is an example using next week's estimate:
If EIA reports a larger crude draw than our estimate, then it is likely that US oil production is currently below 12.75 million b/d, and vice versa.
Going forward, readers can use our estimate as a proxy for US oil production. This is why we have spent so much time perfecting this methodology.
Conclusion
US oil production is not surging, it's flat. Please ignore the EIA weekly US oil production figure. It is not useful. As long as you know that and look at what we say US oil production is, you will have an edge over the rest of the market.


