

Editor’s Note: The piece below is a compilation of all of the chemical sector write-ups we published since October 2025. We hope readers will find this helpful in navigating what we think is the trough in the special chemical space.
By: Jon Costello
As a capital-cycle investor, the chemical sector piqued my interest in the second half of last year. We began investing in the space late last year.
Since then, chemical stocks have started to recover, with further gains likely if the recovery continues. What were potential three- or four-baggers a few months ago can still double or more from their current prices.
As we made our investments, I published a series of articles outlining my views on the sector, its cyclical properties, and my favorite investment prospects. This article provides a review of my macro and micro theses for the cyclical chemical sector.
Part I: The Chemical Sector: Olefins and the Rest
The chemical sector is in its longest downturn in recent history. For many chemical companies, earnings have been on a downward path since 2021. As demand remains tepid amid abundant supply, the industry faces several headwinds, both cyclical and structural. However, opportunities are there for investors who understand the risks and potential upside.
After reviewing the industry, I have found a few crucial points for investors navigating the sector in search of bargain opportunities.
One is that opportunities are absolutely there for the taking. Anyone who looks at the past earning power of the typical industrial or commodity chemical company and compares it to today’s market cap and enterprise value can appreciate that most of the sector is cheap. Many chemical stocks trade at obscenely low multiples of mid-cycle earnings. Interestingly, this isn’t the case in the energy sector, where most stocks discount a sustained recovery. But even using extremely conservative valuation assumptions, I believe multi-baggers exist in chemicals for investors who can identify opportunities, size their positions appropriately, buy on weakness, and stomach the inevitable volatility that arises in cyclical downturns.
A second crucial point is that cyclical forces will bring about a recovery. No one can precisely time when this will occur, though I believe a recovery is underway for some chemical sub-sectors.
For example, some particularly cyclical chemical sub-sectors are experiencing low prices that will likely lead to supply curtailments. Eventually, inventories will get worked down, prices will increase, and margins will grow. Meanwhile, in areas that may remain weaker for longer, low-cost producers are available. These are the companies that are most likely to survive the downturn and thrive in the ensuing upcycle. These are the kinds of opportunities investors should try to identify.
Such low prevailing prices raise the question of whether the sector’s low valuations are justified. This is another crucial point worth fleshing out, namely, that olefin producers are cheap for good reason. This is a large segment of the sector by market cap, and it often tops the buying lists of many generalist bargain hunters. Companies such as Dow (DOW), LyondellBasell (LYB), and Westlake (WLK) are at risk of a far more brutal downturn than their non-olefin peers. Their stocks are right to be low and will likely remain so, as their profits are at risk of moving even lower for years. Any recovery is likely to be fleeting.
This isn’t necessarily the case for non-olefin producers, though I suspect that many have been tarred too negatively with the olefin brush. Investors can therefore divide the chemical sector into olefins and “everything else.” The former are to be avoided altogether, and I discuss why below. The latter is where mispricings can be found.
The Factors Driving the Olefin Glut
Olefins are hydrocarbons that contain at least one carbon-to-carbon double bond. The main olefins are ethylene, propylene, and butenes. They’re made by steam-cracking ethane, propane, naphtha, and other hydrocarbons. Olefins serve as the building blocks for polyethylene, polypropylene, and various intermediaries. Polyethylene and polypropylene are the building blocks of plastics.
Investors in chemical companies should be aware that overinvestment has severely diminished the prospects for returns in the olefins market.
The culprit behind the oversupply is investment by the integrated oil majors to expand their downstream chemical operations. Their investments have been focused mainly on expanding production of ethylene, polyethylene, polypropylene, and aromatics. The onslaught of new supply threatens to lower the margins and returns on capital for olefin producers for years to come.
Since 2015, the annual production capacity of light olefins—ethylene and polyethylene—has increased by more than 50%, from approximately 230 million tons to 430 million tons. The growth outpaced real global GDP, which grew by roughly 25% over the same period.
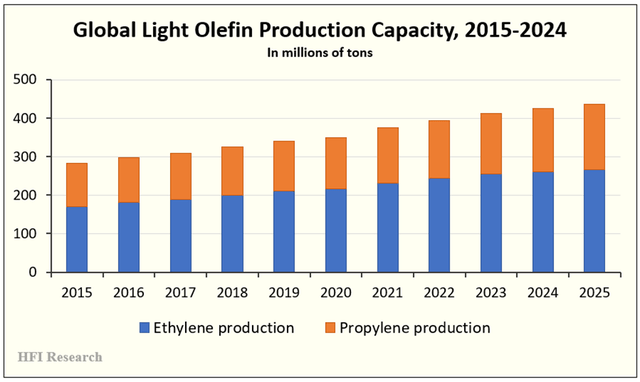
Source: Oilchem, GlobalData, ICIS, and Wood Mackenzie.
The surge in investment came as the narrative about the future of gasoline and diesel demand turned negative. Virtually all the majors bought into the idea that demand for their biggest-selling refined products would peak and begin to decline in the 2030s. Oil and gas executives who knew this narrative was flawed were pressured to accept it through political and regulatory dictat, corporate governance, lawsuits, and shareholder pressure. Many industry participants grew concerned that EV penetration, fuel economy improvements, and biofuel blending mandates would slow gasoline and diesel demand over time. As a result, refining would no longer be a reliable growth engine. Sticking to these “sunsetting” products implicitly meant embracing excess supply and structurally low margins.
Petrochemical production, on the other hand, was expected to grow. Rising living standards and global urbanization would drive demand for plastics and other petrochemical products above the GDP growth rate. With demand expected to rise, global majors sought to convert their hydrocarbon feedstocks into chemicals rather than gasoline or diesel. In doing so, they figured they could create more value per barrel of crude oil feedstock. Adding to petrochemicals’ allure was surging production of light oil and NGLs in U.S. shale basins, which promised years of growing chemical feedstock at ultra-low prices. Structurally lower feedstock prices held the prospect of boosting margins relative to competitors on the global stage.
As usual in the oil industry, nearly all participants embraced the same strategy: favoring investment in chemicals over gasoline and diesel. Thus, a synchronized global petrochemical capacity buildout was unleashed. Polymer inventories bulged, prices fell, and petrochemical margins were destroyed.
The economics are plain to see. For example, Shell’s (SHEL) new polyethylene complex in the U.S. has missed its original return targets thanks to cost overruns and weak polyethylene pricing.
The Integrated Majors’ Petrochemical Buildout
The integrated oil majors’ expansion in petrochemicals over the past few years has been unprecedented.
ExxonMobil (XOM) expanded its Baytown, Texas, refinery by adding new chemical units that sourced Permian NGL feedstock. The expansion represented an investment of $2 billion and included a 350,000-ton-per-year olefin unit and a 400,000-ton-per-year performance polymer unit.
More concerning for the chemical market, ExxonMobil plans to continue its Gulf Coast petrochemical buildout to convert light crude oil and NGLs from U.S. shale into higher-value products. The company plans to spend $20 billion over ten years beginning in 2023.
Shell built its Pennsylvania Petrochemicals Complex outside Pittsburgh. The complex is a massive ethane and polyethylene production operation designed to use locally produced Marcellus and Utica ethane to produce plastic. Its capacity is 1.6 million tons of polyethylene per year. Shell estimates spending $14 billion on the project.
TotalEnergies (TTE) commissioned a one-million-ton-per-year ethane steam cracker for $2 billion. The facility is integrated with Total’s refinery platform. In 2023, the company added a new 625,000-ton-per-year polyethylene unit at its Bayport, Texas, platform for approximately $1.4 billion.
Chevron (CVX) and Phillips 66 (PSX) entered into a 50/50 joint venture to partner with QatarEnergy to build a 2.1 million-ton-per-year ethane cracker and two one-million-ton-per-year polyethylene units in Orange County, Texas. Both are set to start up in 2026. The estimated investment for the project is $14.5 billion.
Saudi Aramco has explicitly adopted a “liquids to chemicals” strategy to maximize the profitability of each barrel of oil it produces. Aramco aims to convert 4 million barrels of crude oil per day into petrochemical feedstocks by 2030. As of 2025, it is around halfway there.
Altogether, Aramco’s investments to date include large-scale crackers and mix-feed steam crackers, which are likely to add more than 10 million tons per year of petrochemical production capacity.
All these—and many other—projects around the world amount to a structural supply headwind that will keep global chemical margins depressed and prevent cycles from the swings they have undergone throughout their history.
China’s Petrochemical Buildout
Over the past few years, China has carried out the most extensive petrochemical buildout in history, amounting to roughly 20 million tons per year at a cost of tens of billions of dollars. Multiple “crude to chemicals” facilities were built on the coast with state support. The objectives in the capacity buildout were to replace plastic imports with domestic production, keep refineries profitable as domestic gasoline and diesel demand slowed due to increasing EV adoption, and bind foreign crude suppliers, such as Saudi Aramco, more closely to China through long-term feedstock deals.
China doesn’t have the benefit of low feedstock costs, but it does benefit from low electricity costs and a lax regulatory environment compared to most global manufacturing regions.
The buildout—which is still ongoing—has been driven by state-owned enterprises, domestic private companies, and foreign operators. The list includes ExxonMobil, CNOOC, Shell, PetroChina, Sinopec, and Aramco. It has led to China’s olefins capacity exploding from approximately 45 million tons per year in 2015 to 145 million tons per year in 2025. To make matters worse for the chemical industry, the country is planning an additional 40 million tons per year of supply through 2030.
China is now the price maker in olefins. However, the country is now beset by overcapacity. But the structural oversupply has increased pressure for exports. This is why low-cost Chinese olefins are flooding the market and may continue to do so for years. So far, the country has not exhibited restraint, even amid persistently low prices, despite calls to rein in “disorderly competition”. China’s continued growth in the sector threatens to put global chemical margins under pressure for years.
Conclusion
Olefin economics are set to be challenged for years. While overcapacity amid lower-than-expected demand has led to a global oversupply, supply is set to continue coming online. China’s production is set to grow steadily through 2030, as shown below.
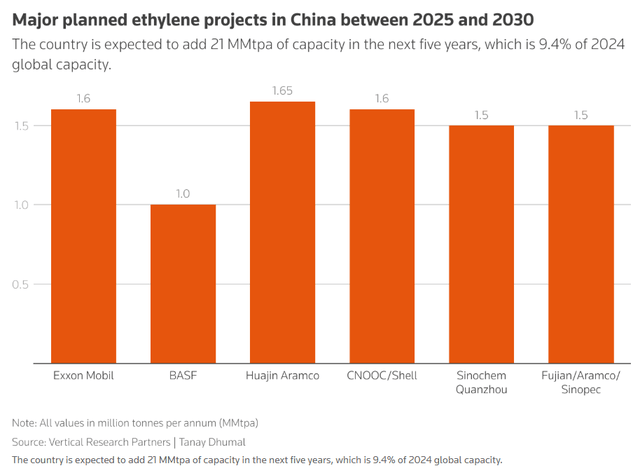
Source: Reuters, Sept. 22, 2025.
If China’s demand fails to rise by the amount of added supply, excess supply will be exported.
Only plant closures can prevent a glutted market on a permanent basis. There are signs that the downturn has forced some closures, but nowhere near enough to alleviate the oversupply over the longer term.
The upshot is that investors must avoid olefins and stick to other chemical sub-sectors. To help sketch a lay of the land, the next section breaks down the chemical industry into its sub-sectors. Each sub-sector has its unique economics. I believe the brief descriptions can help an investor get their bearings as they attempt to scan the chemical sector for bargain opportunities.
Part II: Chemical Industry Sub-Sectors
There are plenty of chemical stocks to choose from outside the olefins. The chemical industry is comprised of a diverse array of companies that run the gamut in terms of cyclicality, returns on capital, competitive advantages, and other factors.
The sector can be broken into sub-sectors presented as follows. This list is not exhaustive, and some companies operate in multiple sub-sectors. I hope it helps a beginner in the sector find areas within their circle of competence where bargains can be found.
Petrochemical Feedstocks. These are the core building blocks of other compounds. They’re made from crude oil—specifically, the lightest grade, naphtha—and NGLs such as ethane and propane. These feedstocks are used to make the olefins ethylene and propylene, as well as the aromatics benzene, toluene, and xylene. Olefins and aromatics, in turn, are used to make various polymers and solvents. Methanol is another petrochemical building block. It makes formaldehyde and acetic acid, among other compounds.
The key drivers of production are feedstock-product spread, such as the spread between ethane and naphtha. As a global market, product flows are also influenced by changes in inventories and prices across different global trading hubs.
Petrochemicals are highly cyclical. Their prices tend to swing with those of crude oil and NGLs.
Polymers and Resins. These products are formed from petrochemical feedstocks. Polyethylene and polypropylene are plastics used in packaging and consumer goods. PVC is used in construction, while PET is used in beverages. Polystyrene is also used in packaging. Various resins are used in automobiles and electronics.
Like petrochemical feedstocks, profitability depends on spreads between feedstocks and products, as well as the state of global inventories. Recycling plays a role in supply, which reduces the need for petrochemical feedstocks in production. The U.S. Gulf Coast is advantaged due to the presence of large refineries and its proximity to production centers in the U.S. shale basins. Longtime HFIR Energy Income Portfolio holding, Enterprise Products Partners (EPD), is engaged in polypropylene through its downstream PDH units.
Public petrochemical, polymer, and resin manufacturers include Dow, Inc. (DOW), LyondellBasell (LYB), and Westlake Corp. (WLK).
Inorganics and Minerals. This group includes a broad spectrum of chemicals, including chlor-alkalis, chlorine, soda ash, titanium dioxide, and carbon black. Feedstocks for these chemicals are generally mined, so the economics underlying each product differ. Soda ash—previously known from our Genesis Energy (GEL) holding, which recently divested of its soda ash operation—is dependent on the prices of natural trona and other synthetic feedstocks. Titanium dioxide is a pigment used in coatings and plastics. Its economics are tied more closely to housing, construction, and automobile production activity. Carbon black tracks rubber demand as a crucial component in tire production.
Public companies include Tronox (TROX), Kronos Worldwide (KRO), Chemours (CC), and Olin (OLN).
Industrial Gases. Oxygen, nitrogen, hydrogen, helium, and specialty gases are included in this subset of chemicals. As gases, these products are advantaged by long-term take-or-pay contracts, high switching costs, and their mission-critical reliability across their various uses. Industrial gases tend to have more favorable economics than other chemical sub-segments. Their demand is driven by steel and chemical manufacturing, healthcare, and electronics—all of which depend on gases for their production. Capital intensity tends to be high, but contract structures lock in attractive returns.
Public companies include Linde (LIN), Air Products & Chemicals (APD), and Air Liquide.
Fertilizers and Crop Nutrients. Natural gas prices drive the economics of these products. Ammonia, urea, phosphate, and potash industries have generally consolidated into semi-oligopolistic supply sources. Demand is impacted by weather, planting acreage, inventory levels, and export restrictions. New projects tend to be large, so these products are also impacted by the start of capacity additions. Due to price volatility, a producer’s place on the cost curve, as well as its logistics, dictates profitability.
Public companies include: CF Industries (CF), Nutrien (NTR), Mosaic (MOS), and Yara.
Agrochemicals. These are synthesized from other chemicals and include herbicides, insecticides, fungicides, seed treatments, and emerging biological compounds. This sub-segment is heavy on intellectual property and devising new formulations of existing products. Product life cycles, patent cliffs, and regulatory regimes all play a part in product economics. Pricing power and high returns tend to rest with the innovators, while generics producers compete on cost and scale.
Public companies include: Corteva (CTVA) and FMC (FMC).
Specialty Chemicals. This is a broad, fragmented category of diverse chemicals that include performance additives, surfactants, catalysts, mining chemicals, and oilfield chemicals. Calumet’s (CLMT) legacy operations can be found here. Many specialty chemicals are involved in lubrication, corrosion resistance, foaming, and other uses. As such, they tend to add value to other processes and products. They also involve greater innovation and lower commodity-price dynamics. Some specialty chemicals possess significant pricing power. Producers differentiate their products through the cadence of innovation, management of products that make up a chemicals portfolio, technical service, and qualification standards.
Public companies include: Eastman Chemical (EMN), Celanese (CE), Huntsman (HUN), and DuPont (DD).
Coatings, Adhesives, Sealants, and Elastomers (CASE). Producers of these products use solvents, additives, and titanium dioxide to make paints, protective coatings, adhesives, and sealants. Demand is tied to construction, automobile manufacturing, aerospace, and industrial activity. Pricing depends on a company’s ability to pass through fluctuating feedstock costs, as well as regulatory and sustainability trends. Companies compete based on their scale and ability to adjust product applications.
Public companies include: Sherwin-Williams (SHW), PPG Industries (PPG), Axalta (AXTA), and RPM International (RPM).
Consumer and Personal Care Ingredients. This sub-segment includes companies in flavors, fragrances, and nutrition. They incorporate surfactants, preservatives, emollients, conditioning polymers, enzymes, and fragrance compounds into products involved in home goods, personal care, food and beverage products, and nutrition. This sub-sector benefits from relatively stable demand, long customer relationships, and technical formulations that increase switching costs. Scale and innovation enhance economics, and pricing discipline influences margins.
Public companies include: International Flavors & Fragrances (IFF), Symrise, Givaudan, and Croda.
Electronics and Semiconductor Chemicals. These are high-barrier-to-entry products with rigorous purity specifications and significant qualifications for their use. Demand is tied to wafer-fab equipment cycles and other technology cycles. The production process typically requires deep process know-how and the supply of ultra-pure inputs, both of which earn premium financial returns. Customers tend to be sticky, and cyclicality is relatively low. Intellectual property development supports competitive advantages.
Public companies include: Entegris (ENTG) and DuPont (DD).
Performance Materials and Advanced Materials. These are specialized engineering plastics, composites, and silicones. Nylons, PBT, and PC blends, epoxies, and carbon fiber matrices. They serve the automobile manufacturing, electronics, medical, construction, and energy industries. A product’s value depends on its weight, thermal and electrical performance, durability, and regulatory compliance. There is often a risk of supply chain constraints, but margins tend to be durable.
Public companies include: Hexcel (HXL), Huntsman (HUN), and Wacker Chemie.
Rubber and Tire Chemicals. Synthetic rubbers are the largest part of this sub-sector. They rely on the supply and price of butadiene and styrene feedstocks. Additives include antioxidants, accelerators, and process oils. Tire demand is the ultimate driver of price, which is influenced by automobile production, miles driven, and freight activity. A producer’s profitability depends on petrochemical feedstock prices and capacity additions.
Public companies include: Cabot (CBT), Orion S.A. (OEC), PCBL Chemical, and Lanxess (LNXSY).
Part III: The Current Downturn and Prospects for a Recovery
As the global chemical industry works through one of its worst downturns in decades, sales volumes have declined for several years, utilization rates have fallen below 80%, and margins across a broad swathe of producers are hovering around cash cost. For many producers, conditions are akin to a deep recession, even though broader GDP continues to grow.
The downturn has caused earnings of the more cyclical chemical companies to decline for three years in a row, with their stock prices following suit. Expectations of continued earnings weakness keep many of the stocks at multi-year lows.
This business and stock price performance begs the question of whether cyclical chemical companies represent an attractive buy at a low point of their cycle. And if so, how should an investor time an investment? Should they take the plunge now or wait for a macro recession to push chemical stocks even lower?
With full acknowledgement that the downturn has longer to go and chemical stocks are likely to remain weak, I believe equity valuations in a large part of the sector are sufficiently attractive to buy now for a multi-year holding period.
The fact of the matter is that downcycles end; this one will, too, like all the cycles that have preceded it. The inevitable upturn will deliver far higher stock prices and outsized returns for those who invest today, in the depths of the downturn.
Investors seeking to position for an upturn should understand the supply-and-demand factors that led to the current downturn, what will drive the transition to an upcycle, and where to look for opportunities throughout the sector.
Chemical Value Chains
When selecting stocks, investors should view the chemical sector not as a single entity but as a set of “value chains” with their own supply-and-demand dynamics.
Chemicals move across a manufacturing chain that adds value at each step. Starting from raw materials, the industry’s products are developed into base chemical building blocks, then intermediates, then polymers, and lastly, formulated and specialty products. Formulated/specialty products are then sold to end users. There are dozens of core platform value chains. The further down a chain you go, the more specialized and less commodity-like the companies tend to be, and the greater the number of companies that exist to add value from precursor chemicals.
The diversity of value chains makes the chemical sector unique among cyclical commodity sectors. For one, the moves of a single commodity do not determine sector-wide economics the way energy producer results are heavily influenced by oil and natural gas prices, and copper or gold mining results by metal prices.
A chemical operation’s economics are dictated first by the particular value chain in which the company resides and second, by where it stands on that chain.
The existence of multiple value chains means that industry economic cycles differ across chains, as each has distinct supply/demand dynamics, logistical requirements, customer behavior, return characteristics, and so forth.
This isn’t to say that GDP recessions don’t depress earnings in the chemical sector. Of course, recessions lower earnings, and as such, remain a risk. However, a macro recession is not necessary to trigger a downturn in a chemical value chain. Furthermore, a GDP upturn isn’t necessary to spur a recovery in a value chain. Chemical value chain downturns and recoveries can and do occur independently of macro recessions. So investors can sit on their hands waiting for a macro recession to arrive and completely miss out on participating in a full cycle that could deliver outsized returns by buying in the downturn and selling during the recovery.
Factors Driving the Downturn
Today’s downturn in the chemical sector is clearly not being driven by a classic GDP recession. Instead, it’s the result of a nasty combination of overbuilt global capacity, weak industrial end-markets in Europe and parts of Asia, and a long destocking cycle that has reduced orders below end-use demand. The result has been a prolonged downturn that feels like a recession within the industry, even though the broader economy continues to grow steadily.
Just as a GDP recession wasn’t necessary to cause the downturn, a GDP upswing won’t be necessary to drive a recovery. Historically, chemical downturns have ended when inventories in a value chain have normalized and high-cost capacity has been rationalized. Demand does not have to be strong; it simply has to tick higher from the depressed levels specific to a value chain during the downturn. In fact, in the early stages of a chemical recovery, demand is significantly below mid-cycle levels. One of the reasons timing a bottom is so difficult is that recoveries begin during times of still relatively weak demand while supply is still adjusting downward. There is no obvious “all clear” signal, such as a visible surge in demand.
Global Demand Weakness
Demand has been weak across various chemical value chains for various reasons. Tepid industrial demand in major economies has reduced activity in several demand-driving sectors, including construction, autos, electronics, packaging, and consumer durables. This demand weakness has affected various chemical value chains in different ways and to varying degrees. Still, most have seen their sales volumes decline significantly over the past two to three years.
European demand has been particularly bad. The contraction of Europe’s manufacturing base in recent years has reduced demand for polymers, intermediates, coatings, and engineering plastics. At the same time, European chemical producers have suffered an industrial crisis brought about by high energy costs, unfavorable policies, and weak manufacturing activity, all of which have eroded the industry’s competitiveness on the global stage.
In North America, where the macro backdrop is better relative to other regions, higher interest rates and slower housing activity have weighed on value chains for nylon, isocyanates, PVC, and packaging-linked products.
In China, a drawn-out property bust and weak heavy-industry activity have cooled demand for construction-related and freight-dependent value chains.
Another important cause of weak global chemical demand has been an unusually long restocking phase. During Covid and its immediate aftermath, chemical end users over-ordered and built excess inventories in response to supply-chain chaos and rising prices. However, once conditions normalized, buyers flipped to a hyper-conservative posture, drawing down inventories and ordering only what they needed. This behavior persisted much longer than the typical quarter or two seen in a typical recession. The result is that apparent demand has fallen below actual end-use demand for an extended period, amplifying the downturn in volumes and capacity utilization.
Persistent Oversupply
This downturn has been unusually stubborn because the global chemical industry massively overbuilt capacity during the last cycle, particularly in olefins, as covered above.
While olefins are likely to be mired in a downturn for years, other value chains face varying supply situations. In some, new production capacity continues to ramp, reinforcing pressure on trade flows and export prices. Even as demand stabilizes and destocking runs its course, the sheer amount of capacity, especially in Asia, caps pricing power and keeps margins low.
Until enough high-cost capacity exits the system—or demand grows long enough and fast enough to absorb it—the industry will remain in a low-return state. For example, the vinyl and polyester chains are in this group. In other chains, however, supply rationalization has been ongoing for years, and inventories are closer to normalizing.
What Will Spark an Upturn?
The industry’s own adjustment process will end this downturn.
First, inventories across the various chemical value chains need to be normalized. In many chains, this process is well underway. After several quarters of aggressive destocking, order patterns are gradually reverting to more normal behavior, even as demand remains weak.
Second, production capacity must be rationalized. Rationalization can occur in various ways. High-cost assets are shuttered, marginal projects are delayed or cancelled, balance-sheet-strained operators ratchet back on capex, high-growth companies shift to capital preservation, and the industry consolidates. The extent of supply rationalization varies across different value chains, but the process is clearly advanced, particularly among the most stressed commodity producers.
Third, end-user demand will have to grow modestly from a depressed base. Demand tends to grow along with GDP. It will receive an additional boost once destocking is complete. Even if global industrial activity muddles through with low-single-digit growth, chemical producer revenues and margins will stabilize. Any growth will result in positive operating leverage and higher earnings. Even a slight improvement in the volume environment, combined with a smaller base of production capacity and normalized customer inventories, is enough to lift capacity utilization and margins for the survivors. Once utilization and margins rise, a new upcycle can begin.
The Path Ahead
The recovery from this downturn is unlikely to be “V-shaped.” It will more closely resemble a long, uneven climb out of a trough, marked by gradual improvement with sharp divergence between winners and losers.
Global Volumes
On a global basis, volumes are likely to grow modestly over the next few years. A combination of lower interest rates, slowly improving housing and auto markets, and normalized inventory behavior should support low-single-digit demand growth in many chemical value chains.
Given the cyclically low conditions in which many value chains currently operate, modest growth should be enough to prevent conditions from deteriorating further. Even modest growth from today’s depressed capacity utilization levels is likely to translate into meaningful operating leverage, especially for companies that have structurally lowered their costs and rationalized their product portfolios during the downturn.
Pricing and Margins
A recovery in pricing and margins will lag the volume growth, particularly in commodity chemical products traded globally. Olefin chains are the poster child for this dynamic. With so much capacity in Asia, olefin margins will likely remain under pressure for years, while export prices will remain highly competitive.
Other overbuilt, trade-exposed chains will undergo a similar pattern. The initial phase of the recovery is therefore more about volume stabilization and cost absorption rather than a rapid snap-back in prices and margins. Over time, as capacity remains low and demand grinds higher, pricing power will slowly return. However, this is likely to be a multi-year process rather than a quick reset. Some value chains are better positioned to exercise pricing power than others, even among pure commodity producers.
Regional Divergence
There will be stark regional divergences among chemical producers. Producers in the U.S. and the Middle East benefit from structural feedstock advantages and access to global markets. Consequently, they are poised to emerge from the downturn stronger as high-cost European assets are closed or repurposed.
Asia will remain the swing region in many commodity chemicals. New capacity in China will continue to set the marginal barrel in olefins and several other bulk chemical value chains. Investors should expect trade flows and market shares to continue shifting in favor of low-cost regions.
Europe will continue to lose competitiveness in the global chemical market. High-cost European producers are structurally disadvantaged compared to their U.S. and Middle Eastern competitors, which benefit from lower-cost feedstock and less onerous regulations. Energy price spikes and policy uncertainty in Europe have forced several producers to cut utilization, idle production facilities, consider permanent closures, or relocate their operations to countries where they can regain competitiveness. European chemical producers will be forced to migrate toward specialty chemicals, formulations, and niche value chains where they can justify higher costs with innovation, service, and customer proximity. Falling European production is one of the main supply-side factors set to balance various chemical chains in the longer term.
Corporate Strategy
Corporate strategy among chemical producers will reflect the new reality. For one, the growth-at-scale era is probably over. Management teams now emphasize profitability, resilience, and selective growth rather than total volume growth.
Capex plans are being pruned, discretionary “green” projects are being pushed out or rephased, and capex decisions are being viewed through the lens of balance-sheet capacity rather than growth expectations.
Mergers and acquisitions will focus on portfolio upgrades instead of size. Companies will continue exiting structurally challenged commodity assets and add higher-returning specialties. The companies that execute this pivot with discipline are likely to compound value as the cycle turns.
Where to Invest in the Sector
The industry will emerge from this downturn leaner and meaner than it has been in many years. A new upcycle will bring improved margins and higher returns on capital. For several years, industry players are likely to remain disciplined before memories of the downturn fade and more aggressive producers start to build out capacity.
Investors should favor low-cost, feedstock-advantaged producers in supply chains that are regionally constrained, as well as formulation/specialty businesses with genuine pricing power. These franchises are most likely to emerge from their respective value chain recessions with greater market share, stronger balance sheets, and enhanced earning power.
An investor should also focus in areas where demand growth can fill capacity over time. As long as capacity utilization remains cyclically low—as is likely in olefins—returns to shareholders will remain depressed. Producers with high costs and weak balance sheets are higher risk than lower-cost, stronger competitors. However, the survivors among these producers also possess the greatest upside torque to a recovery.
Structurally higher supply may persist in many chemical value chains for some time. Others appear to be on the cusp of a recovery, where the volume and destocking shock has largely run its course. Despite divergent fundamentals across value chains, the prospect of structural oversupply in some chains has worsened investor sentiment toward the sector as a whole, including value chains with stronger recovery prospects. The indiscriminate selling of chemical stocks has created attractive opportunities. Investors should look to invest in low-cost, regionally advantaged, and niche franchises where mid-cycle earning power is being mispriced off trough conditions.
As for what investors should avoid, top of the list is any value chain characterized by structural oversupply. Investors should also avoid high-cost European commodity chemical operations unless they can demonstrate the ability to shift toward higher-margin products.
Lastly, a macro GDP recession is all but certain to reduce chemical demand. Lower demand will cause earnings and stock prices to fall across the sector. However, well-positioned companies in value chains that are already in advanced stages of their downcycle will experience less severe conditions during a recession and undergo more robust recoveries once economic growth returns. Given the risks posed by a recession, investors should favor companies with strong balance sheets that can survive further deterioration in end-market demand.
While recessions are always a risk, market valuations for many chemical producers are currently so depressed that I believe investors can still earn attractive returns over a three to five year holding period, even if a recession intervenes. The key will be to hold positions in the companies most likely to survive, and to avoid investing in the weaker names.
With the cycle mechanics in place, the most useful next step is to ground them in precedent—how prior downturns resolved, and what signaled the inflection.
Part IV: Lessons from Past Chemical Cycles Applied to Today’s Stocks
Many investors are waiting for the onset of a macro GDP recession before investing, even though prices are at bargain levels. They’re doing so to sidestep a selloff that may happen during a recession, or to time their investment at the bottom in anticipation of the subsequent upturn.
Although a recession may happen and likely push chemical stocks lower, investors should consider initiating a position in chemical stocks now.
Recessions are only clear in hindsight and are nearly impossible to predict accurately. Investors waiting for a recession before buying these stocks might miss out on the profits to be had in the eventual recovery.
Second, the industry has already experienced a brutal multi-year downcycle that has impacted the supply side in a macro recessionary manner.
Third, cyclical chemical stock prices are so low that even if they fall further during a recession, the long-term returns they will generate are likely to be satisfactory.
Fourth, and most importantly, the industry’s historical pattern has been to decline and recover in the absence of a macro recession. In fact, each value chain within the industry has its own unique cycles.
My previous article covered the key economic factors that cause downturns and recoveries. This article will present historical examples of chemical cycle downturns and recoveries, both of which occur on a timetable distinct from the broader GDP changes. Once investors realize how some of the harshest chemical downturns have been resolved within the value chains themselves—often while headline macro data is neutral or only slightly positive—they might consider taking the plunge into some beaten-down chemical stocks today.
Titanium Dioxide: Overbuild, Environmental Crackdown, and Forced Discipline
Titanium dioxide is a particularly volatile chemical value chain. The market’s cycles since 2011 show how bad conditions can get within the titanium dioxide chain, even as global macro GDP expands, and how an upturn can begin without a GDP increase.
In 2011, the titanium dioxide market experienced a spike in prices after severe supply rationalization in response to the 2008-2009 recession. The industry reacted predictably to higher prices: it expanded capacity. This time, China took the lead.
Also predictably, the capacity buildout went too far. While the global economy continued to grow, the excess capacity created in 2012 and 2013 caused a sharp drop in titanium dioxide prices in 2014.
The industry downturn worsened in 2015, with operating rates dropping to the mid-60%. Prices declined sharply, making 2015 one of the worst margin years in decades for titanium dioxide producers.
From the peak of the titanium dioxide cycle in 2011 through the lows of 2015, global GDP grew steadily. The industry’s downturn and eventual stabilization were part of an intra-sector adjustment process.
In this case, the adjustment process was triggered by a glut in major producing regions, which caused a decline in global titanium dioxide prices. In China, prices dropped below producer cash costs, forcing formerly expansionist producers to adopt supply discipline.
Adding to the Chinese industry’s woes were stricter environmental enforcement measures. These measures were implemented to address rising pollution levels resulting from the low-cost production process favored by Chinese titanium dioxide producers.
Chinese producers aiming for rapid expansion in response to rising prices adopted a cheaper but problematic “sulfate” production process. This method is older, simpler, and relies on widely available technology.
The alternative method, the “chloride” process, is more expensive and technologically advanced. This process yields a higher-quality product that commands a premium price.
The problem with the rapid growth of the sulfate process is the pollution it causes. The process produces large amounts of acidic liquid waste and other harmful byproducts, including carbon dioxide. Global regulators have cracked down on sulfate plants that couldn’t afford upgrades to cut pollution. They have generally supported replacing the sulfate process with the chloride process. Today, about 55% of titanium dioxide is made using the sulfate process, mostly in China. Newbuild capacity, both inside and outside China, mainly uses the chloride process.
In 2015, about 98% of Chinese titanium dioxide was produced through the sulfate process. The pollution issue was addressed with regulations such as discharge permits, mandatory inspections, and pollutant tax systems for producers using the sulfate process.
Chinese authorities also stopped approving new sulfate plants and required older ones to relocate or shut down. These measures impacted the Chinese industry but had only a minor effect on overall Chinese titanium dioxide production. Consider that in 2015, China produced a total of 2.7 billion tons of titanium dioxide annually. Brokerage reports at the time estimated that only 112,000 tons of the country’s sulfate production was shut down.
Nevertheless, the reduction of capacity and the outlook for fewer newbuild projects helped pave the way for a market recovery.
While Chinese production retrenched during the 2014-2015 downturn, high-cost Western titanium dioxide production capacity was exiting the field. Older European and North American sulfate plants were curtailed or permanently closed. Weaker assets were shuttered, and producers redirected their focus toward selling higher-value titanium dioxide grades to enhance returns.
The supply adjustment process continued through 2016 while demand remained steady. Demand from coatings and plastics end-users didn’t boom, but the supply reduction amid stable demand helped global inventories normalize, and Chinese exports slowed from manic levels during the boom.
The market’s recovery began in earnest in 2017. That year, titanium dioxide prices and producer margins increased to mid-cycle levels. Not the levels seen during the 2011 euphoria, but levels at which the surviving assets could earn their cost of capital.
Throughout the entire cycle, titanium dioxide producer stocks mirrored the market’s progress. Over the 2014 to 2017 cycle, Tronox Holdings shares plunged by 90% before staging a full recovery, as shown below.
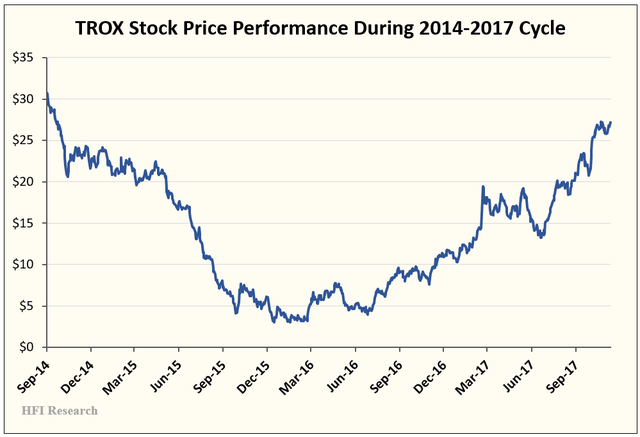
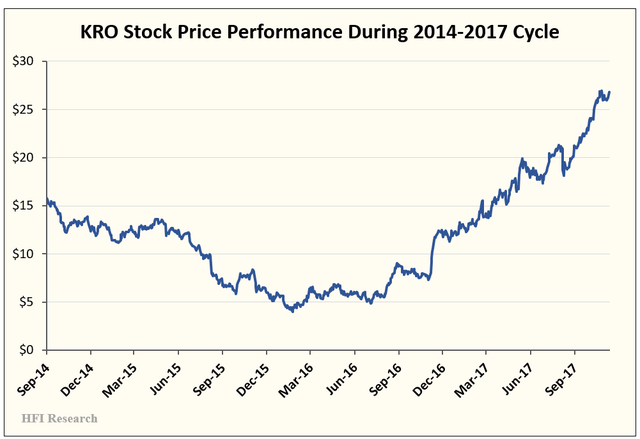
Meanwhile, Kronos shares fell 75% before rebounding and then surged 474% from their lows during the 2017 upcycle.
The lesson from the titanium dioxide cycle is clear: the cycle turned not because of an acceleration in global economic growth, but because enough capacity had exited the market while modest volume growth quietly absorbed the remainder. Economic growth in the major global demand centers over this period remained steady, as shown below.
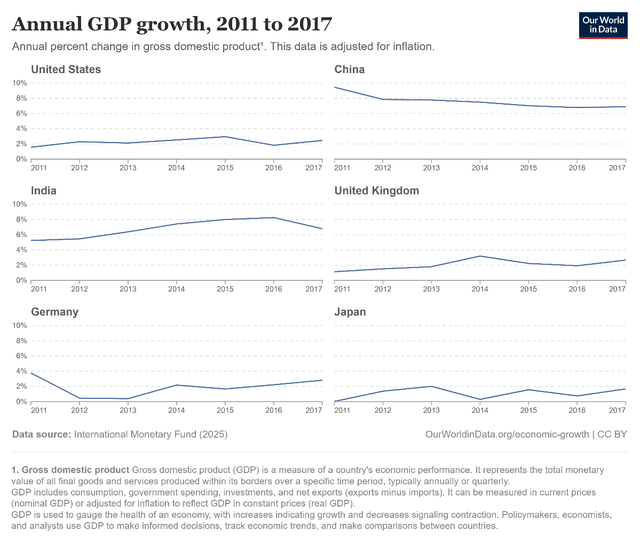
Source: Our World in Data.
Investors who sat on their hands due to concerns about a looming recession missed out on the opportunity to earn outsized returns over a multi-year holding period. The key was to hold, focus on intrinsic value over price, and avoid getting too emotionally involved in the dramatic short-term swings to which titanium dioxide stocks are prone.
Nitrogen Fertilizers: The Export Retrenchment Playbook
The nitrogen fertilizer value chain experienced a similarly unique cycle. In the mid-2010s, the global nitrogen supply complex expanded capacity across ammonia, urea, and UAN. New projects came online, and U.S. producers increased their investments in both brownfield and greenfield projects to displace imports.
By 2016, the outcome was familiar. Spot prices for key nitrogen products plummeted, marginal producers couldn’t cover their cash costs, and nitrogen-related stocks behaved as if the farm economy had fallen off a cliff, even though the demand backdrop was nowhere near a 2008-style collapse. The 2016-2017 dip in U.S. nitrogen fertilizer prices is shown below.
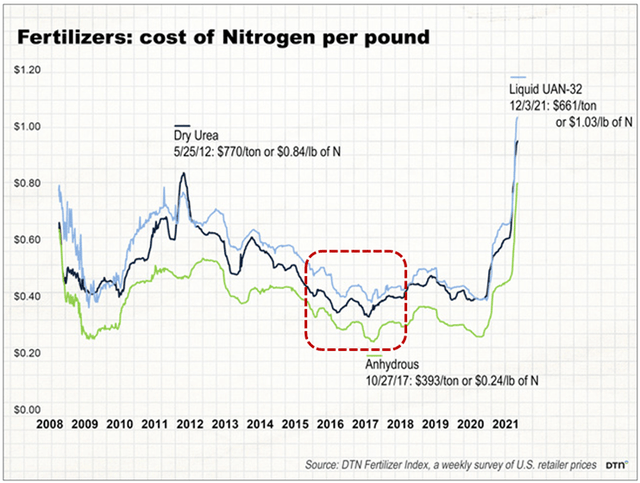
Source: Elaine Kub, “High Fertilizer Prices: History and Future,” Progressive Farmer. Dec. 15, 2021. Red-dotted circle added by author.
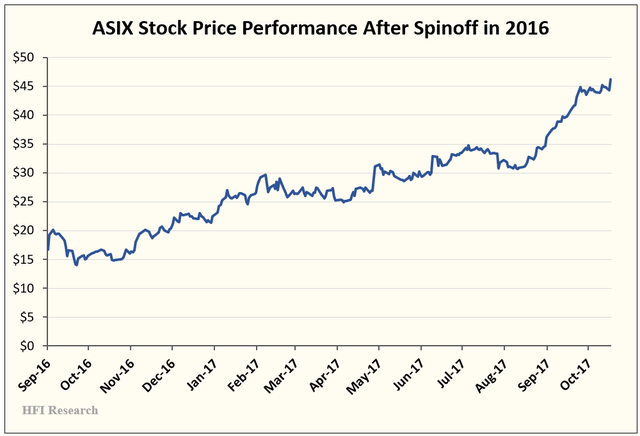
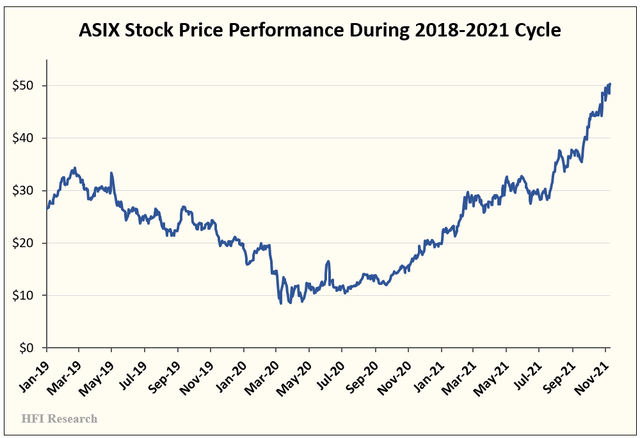
AdvanSix (ASIX) made its debut as a standalone public company into this storm, with its October 2016 spinoff from Honeywell (HON). The company has significant exposure to nitrogen through its production of ammonium sulfate, a widely used nitrogen-based fertilizer.,
Like the titanium dioxide market, the nitrogen market did not need an official macro recession to be stabilized. Its adjustment mechanism was a retrenchment in global exports. As nitrogen prices in China fell below marginal cash cost, Chinese urea exports declined. Higher-cost Chinese producers were forced to reduce exports because their economics no longer supported pushing volumes into the seaborne market.
The recovery that ensued provided a tailwind for ASIX’s business results and stock price in its debut as a public entity.
Once again, the nitrogen market recovery was not driven by a significant demand surge or a massive agricultural boom. It was driven by steady, unexciting demand, combined with fewer tons dumped onto the market by the swing exporters. These exporters removed uneconomic capacity from the export pool.
Meanwhile, in the U.S., domestic capacity ramped up as imports fell and global trade flows reshuffled to reflect the new cost curve. ASIX’s stock price rebounded as its ammonium phosphate business improved amid market adjustments.
The situation highlights that when low-cost production along a chemical value chain is concentrated in a specific region, such as China or the Middle East, the key signals for the cycle are not GDP but export volumes, netbacks for marginal producers, and the willingness of swing producers to flood the market despite poor economics. This was true in past examples, and it is still true today.
Nylon and Engineered Resins: Demand Shock Plus Overbuild
ASIX’s other main business segment, its nylon 6 production, has experienced its own unique cycles since the company came public.
When oil prices plunged in 2015 and into 2016, the prices of key nylon feedstocks also collapsed. Meanwhile, weak textile demand caused a margin squeeze for many producers. The pricing and demand downturn for nylon 6—also known as “polyamide 6” or “PA6”—is shown in the chart below.
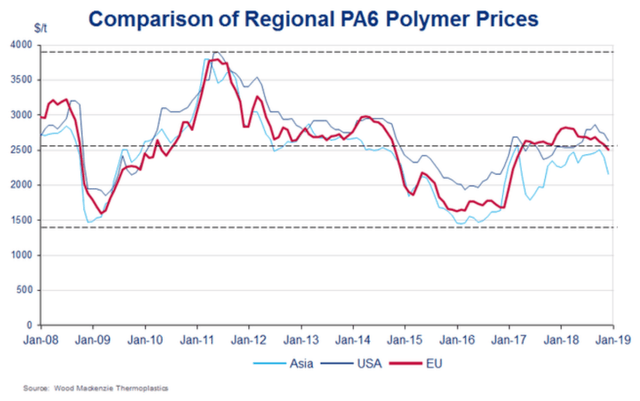
Source: Wood Mackenzie, Domo Chemicals, “The past, future and present of the polyamide industry.” Jan. 4, 2019.
Heading into 2017, nylon 6 demand firmed amid rising automotive demand. The market grew tighter, and prices shot higher.
Then in 2019, two adverse shocks hit the market in succession. First, regulatory changes to emissions testing in Europe disrupted auto production and supplier ordering patterns. Second, expansion projects already underway in key intermediates did not stop as demand wobbled.
The third shock was delivered by the Covid downturn in 2020. This was the most severe. Global auto production fell off a cliff, freezing nylon-6 demand.
The outcome was a deep sector-specific recession characterized by awful spreads between products and their feedstocks, aggressive price cuts, and producers forced to reconsider what “mid-cycle” prices and margins could realistically be. Not surprisingly, the downturn pummeled ASIX’s financial results. Its stock price followed suit.
A marked pickup in auto demand did not drive the recovery that began at the mid-2020 lows. Instead, the adjustment process involved normalizing automobile build rates from low levels, digesting the projects already in the pipeline, and adopting a much more cautious approach to future capacity expansion. The industry realized that its former growth assumptions were too optimistic and that its capital intensity had to come down.
Tying Historical Precedents to Current Conditions
Today, chemicals are in a deep profit recession driven by persistent oversupply and weak pricing power, not a collapse in volumes. China is playing the familiar role of serial overbuilder and exporter across titanium dioxide, intermediates, nylon, olefins, and other products. Europe is being forced to rationalize as the high-cost producer, as high energy and carbon costs shove plants off the cost curve. End-market demand in housing, autos, and consumer durables is soft but hardly apocalyptic.
History shows that the cure for the current downturn is already embedded in the system: the destruction of marginal capacity, the cancellation of growth projects, and a gradual rebalancing of trade flows. The bad news is that this process is painful. The good news is that a macro shock is not required to start the healing.
Titanium dioxide and similar intermediates are experiencing classic titanium dioxide dynamics, characterized by heavy overbuilding, concentrated Chinese capacity, and significant environmental and regulatory pressure. The path out will look like the last titanium dioxide cycle, featuring closures of smaller Chinese producers, supply rationalization among high-cost Western assets, and modest demand growth playing its usual role. This time, the market will benefit from broad tariffs on Chinese products. Reduced Chinese supply to major importers will bolster the competitive position of the three non-Chinese producers that dominate half the market. The key will be to watch where enforcement tightens and where capacity that was assumed to be permanent starts to disappear.
The parallels between the previous nylon 6 cycle and the current one are obvious. At present, the auto and construction end markets are soft but not collapsing. Chinese capacity and exports have added incremental supply pressure to the market’s softness. The fix will be a combination of demand normalization, the selective exiting of capacity, and underutilization outside China. The pain is already visible in spreads and nylon 6 producer earnings. Notably, a formal recession did not trigger this downturn. Producers simply must reduce capex and remove marginal assets from operation. As they do, the market will rebalance.
A nylon 6 recovery will depend on demand returning to normal in autos and construction, as well as selective capacity shutdowns outside China. It will also require pricing discipline among U.S. producers. A new boom won’t be necessary to trigger a recovery, just a rebound from low activity levels and more cautious capital spending.
What to Watch on Supply
Investors in the chemical sector should monitor changes in capacity and capacity utilization, as well as capex plans among global producers. It will be important to determine whether announced closures in Europe and marginal Asian regions are actually occurring and whether they’re not mere talking points on quarterly earnings conference calls.
Investors will also want to make sure new projects are being outright canceled rather than pushed back a year. They should track whether management teams are truly pivoting from growth narratives to balance sheet repair and cash preservation. When management teams and boards of directors stop emphasizing their secular growth stories and start behaving as if capital is scarce, the likelihood increases that the cycle will resolve on its own.
Investors in chemical producers in the midst of a cyclical downturn should also monitor export volumes and exporter netbacks. The core issue will be whether the volume of Chinese exports flowing into key demand regions is tracking higher, beginning to roll over, or in decline. Additionally, they should determine whether netbacks for Western exporters are stabilizing and improving, or whether these market participants continue to fight for low-margin orders in competitive markets.
Any signs of tariffs, anti-dumping cases, or other trade barriers that alter the economics of dumping are also relevant. For titanium dioxide and nitrogen 6, the implementation of tariffs will signal whether a more typical industry retrenchment is underway in the chemical chains where swing exporters dominate the marginal barrel or ton.
Regarding demand, investors should not simply label it as “weak” or “strong.” Instead, they need to assess whether a chemical value chain cycle is deteriorating or stabilizing. Have order books stopped getting worse? Are signs of restocking replacing hand-to-mouth purchasing behavior? Is there any evidence that customers are accepting price increases in parts of the value chain? All these factors are more important to a cycle’s progress than the latest macro GDP print.
Importantly, chemical stock prices will turn higher before the fundamental upswing is evident in the data. The market will begin to price in the cyclical inflection from downcycle to upcycle when it believes growth capex is effectively dead, enough capacity has been removed, and most of the earnings damage is behind the sector.
Conclusion
Investors waiting for a macro GDP downturn before buying well-positioned chemical stocks at their current bargain prices are ignoring the mechanics that drive the chemical value chain cycles. Many need more pain for the marginal producers, more canceled projects, and more discipline from management teams that spent the last cycle believing their own growth decks. The key for investors is to determine how advanced a value chain is in its adjustment process.
Investors should identify chains where the adjustment process is in later stages, but stock prices don’t reflect this reality. They should invest in the companies best positioned to survive the downturn and thrive in the subsequent upturn. They should also have a grasp on these companies’ normalized earning power during recovery. Everything else is noise—even the stock price. The focus should be on securing a bargain purchase price, not precisely timing a recovery.
We’ve made our picks over the past few weeks and covered some of our new holdings in our articles. We remain on the hunt for attractive prospects. Investors seeking to play a potentially highly profitable capital cycle should consider joining us in initiating positions in their favorite chemical names now. For those interested in going deeper, Chemours, AdvanSix, and the Titanium Dioxide pure-plays are discussed below.
Part V: Chemours: A Capital Cycle Play with Big Upside
Chemours (CC) was formed on July 1, 2015, as a spinoff of DuPont’s (DD) more cyclical businesses. Chemours operates in three businesses: Thermal & Specialized Solutions (TSS), Titanium Technologies (TT), and Advanced Performance Materials (APM). In 2024, the company generated $5.8 billion in sales and $786 million in Adjusted EBITDA. This year, it is on track to earn approximately $750 in Adjusted EBITDA. It has an enterprise value of $5.6 billion. Its Adjusted EBITDA run-
Chemours Overview
Chemours shares have been on a steady decline since 2023, as shown below. The shares are currently priced at a discounted valuation characteristic of a cyclical trough.
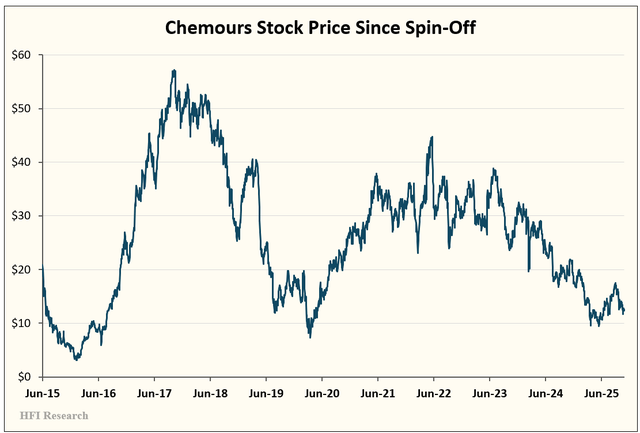
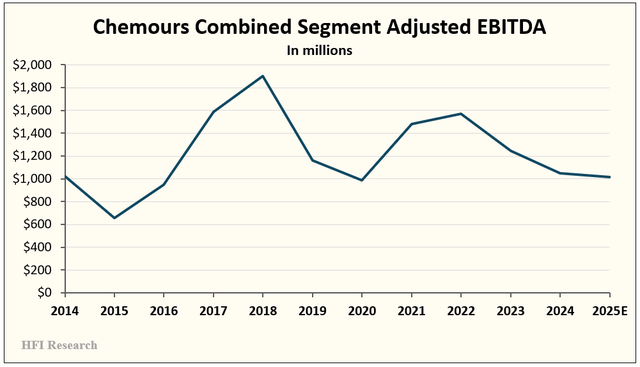
The selloff has coincided with the decline in Adjusted EBITDA. This year’s estimated $750 million is down nearly half from the $1.4 billion generated in 2021.
The decline was driven by the ongoing three-and-a-half-year downturn in Chemours’ two cyclical operating segments. These segments have been hit by weak domestic housing and construction markets, Chinese overcapacity, and, most recently, tariffs. The three segments’ annual Adjusted EBITDA contribution since 2014 is shown in the chart below.
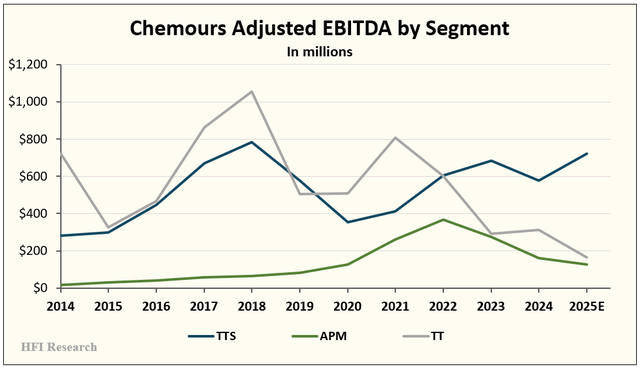
When combined, Chemours’ cyclicality is evident.
Given the strong likelihood of a recovery in Chemours’ fundamentals over the next three years and the significant upside potential in its shares amid such a recovery, the time is right for aggressive investors to consider Chemours’ stock for long-term purchase.
Long-term investors in the company must be familiar with its operating segments, their EBITDA generation potential, and their challenges.
Thermal & Specialized Solutions (TSS)
This segment represents Chemours’ refrigerants and thermal-management portfolio. Its core brands are Opteon refrigerants and foam blowing agents, as well as legacy Freon hydrofluorocarbon (HFC) and chlorofluorocarbon (CFC) products. TTS’s end markets are air-conditioning and refrigeration for automobiles and buildings, foam insulation for buildings, and aerosol propellants for niche applications.
The TSS segment is currently Chemours’ profit engine, with strong margins that I believe are both insulated from cyclical forces and are sustainable. The segment’s demand drivers are climate change regulations coming into effect, air conditioning replacement cycles, and new construction.
This segment is a leading beneficiary of a movement by governments to force a refrigerant technology transition away from HFCs and to refrigerants with low global warming potential. In the U.S., the AIM Act is phasing down the production and consumption of HFCs. The leading replacement has been hydrofluoroolefins (HFOs), and Chemours, along with Honeywell, holds a patented duopoly with its Opteon HFO product.
In the third quarter, TTS generated $560 million in sales, a 20% year-over-year increase. The increase was driven by 8% higher volumes and 11% higher prices. The Adjusted EBITDA margin came in at a historically healthy 35%. An 80% increase in Opteon sales drove the performance. Sales of the product now account for more than 75% of TSS segment sales. The impact of Opteon’s growth is illustrated in the table below, which depicts TTS’s third-quarter results.
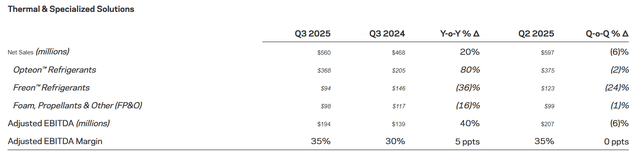
Source: Chemours’ Q3 2025 Earnings Press Release, Nov. 6, 2025.
Clearly, Opteon’s growth is more than offsetting the shrinkage in Chemours’ legacy Freon and foam volumes, as expected.
Titanium Technologies (TT)
Chemours’ Titanium Technologies segment houses its Ti-Pure titanium dioxide pigment business. Titanium dioxide is a whitening agent and opacifier in paints, cosmetics, and other goods. Chemours is the second-largest producer of titanium dioxide in the global market, which is dominated by four firms. This segment is extremely cyclical, and its downcycle has been responsible for crushing Chemours’ Adjusted EBITDA. However, I believe the titanium dioxide market is near its cyclical trough, and drill more deeply into the topic in a later section below. As the cycle turns upward, it will drive most of Chemours’ Adjusted EBITDA recovery over the coming years.
The TT segment’s demand drivers include pigment demand from the paints and coatings, plastic, paper, automotive, architectural, and construction industries.
In the third quarter, TT generated sales of $612 million but only $25 million in Adjusted EBITDA, representing a 4% margin, due to an 8% decline in global titanium dioxide prices and a 2% decline in the segment’s sales volumes.
Advanced Performance Materials (APM)
This segment is Chemours’ high-end fluoromaterials portfolio. Its main products are Teflon fluoropolymers and coatings, Viton fluoroelastomers, Krytox specialty lubricants, and Nafion ion-exchange membranes.
Its products are used in semiconductors and advanced electronics, automotive applications, and energy transition applications such as hydrogen electrolysis and fuel cells.
APM is less cyclical and enjoys sustained higher margins. However, it is Chemours’ smallest Adjusted EBITDA contributor and is currently being negatively impacted by sluggish industrial end-user demand.
In the third quarter, the segment generated $311 million of sales and $14 million of Adjusted EBITDA. Volumes were down 15% year-over-year.
Investment Thesis
Chemours is a basic long-term capital-cycle play. Its investment thesis is comprised of three main parts, discussed in turn below.
Part 1: HFO Demand Growth
The first part of Chemours’ investment thesis pertains to its TSS segment. The U.S. is undergoing a large-scale transition from HFCs to HFOs. HVAC regulations began requiring the use of HFOs on January 1, 2025. Light automobiles are also already mandated to use HFOs. Medium and heavy-duty automobiles are required to switch by 2028, and industrial HFO uses are being phased in through 2028.
The switch to HFOs will boost TTS Adjusted EBITDA for years. Chemours’ HFOs are priced multiple times higher than its legacy Freon product. For example, auto makers pay $75 to $80 per kilogram of HFO versus $15 to $35 per kilogram of the legacy product. Royal Refrigerants, an online retailer, lists a 25-pound tank of Opteon for automotive use at $890, or $35.60 per pound. It lists a 30-pound tank of automotive Freon at $338, or $11.27 per pound. The improved pricing on HFO translates into more than a 20% increase in Adjusted EBITDA margin for the TTS segment.
As HFOs are more widely adopted and/or as macro demand for the product increases, Chemours will benefit from the additional Adjusted EBITDA. Chemours should be able to grow its TSS revenue at a high single-digit percentage rate. The segment’s Adjusted EBITDA is likely to grow at a rate more than twice that.
Also notable is that as Chemours’ Freon sales have declined, the company has been left with an inventory oversupply of lower-priced product. This has created a temporary drag on the company’s financial results. That drag is dissipating, which will help improve comparable quarterly results going forward.
I estimate that Adjusted EBITDA margins from Opteon sales are in the low-40s%, which is high for the chemical industry. Adjusted EBITDA will therefore receive a significant boost as sales volumes increase.
Assuming a conservative 5.0% annual sales growth from the TTS segment over the next two years, and that the segment generates a 36% Adjusted EBITDA margin, its EBITDA contribution in 2028 would be $830 million.
Part 2: Titanium Dioxide Recovery
As I discuss below, I believe the titanium dioxide market is poised for a cyclical recovery. The TT segment’s Adjusted EBITDA contraction is responsible for the lion’s share of Chemours’ Adjusted EBITDA decline over recent years, so a recovery will likely drive Chemours’ combined Adjusted EBITDA significantly higher.
The TT segment also experienced unexpected downtime due to production outages in the U.S. and Mexico. These outages have been resolved.
The TT segment is working through internal cost reductions that management has billed as structurally reducing costs by $125 million. However, cost savings will likely exceed that amount by a significant margin. Management expects that these initiatives, combined with Chemours’ technological advantages in titanium dioxide production, will make the company one of the lowest-cost producers globally, based on production cost per ton.
Chemours needs only a modest swing in the titanium dioxide cycle to realize a significant boost in the TT segment’s Adjusted EBITDA. Assuming TT revenues revert to a mid-cycle level of $2.5 billion and the company achieves its 10-year average Adjusted EBITDA margin of 20%, the segment will generate $500 million in Adjusted EBITDA. As the cycle inflects higher, Adjusted EBITDA will increase further. In fact, Adjusted EBITDA increases can exceed TT’s historical recovery trends if the segment’s cost-reduction initiatives prove successful.
Part 3: “Other” (An APM Recovery & Data Center Cooling Technology)
A cyclical recovery in Chemours’ APM segment’s end markets will also contribute materially to Chemours’ Adjusted EBITDA recovery over the coming years.
In the third quarter, APM generated $311 million in sales and earned $14 million of Adjusted EBITDA, for a 5% margin. Volumes fell 15% from the previous year. Since 2014, APM’s Adjusted EBITDA margin has averaged 12%, so an improvement in volumes and Adjusted EBITDA stands to add more than $100 million to Adjusted EBITDA annually, for a total normalized segment Adjusted EBITDA contribution of approximately $200 million.
Data center cooling technology is more of a wild card in Chemours’ investment thesis. Nevertheless, it is important because of the significant value it would represent for the company if widely adopted.
For decades, Chemours has demonstrated its ability to innovate, roll out the innovations at scale, and profit as they are commercialized. The company’s newest focal point for innovation is its data center cooling technology.
Chemours has developed a proprietary fluid for two-phase immersion cooling in data centers. Since data center processing speed is directly correlated with heat levels, continued advances in processing will drive increased needs for data centers to dissipate heat. In fact, rising costs for heat reduction will become a major limiting factor on data center growth. Immersion cooling is a promising cooling technology in which data center hardware is submerged in a non-conductive fluid that absorbs heat more efficiently than air.
Chemours is a leader in developing these fluids through its expertise in HFOs. Only it and Honeywell control the patents needed to scale up this immersion cooling technology.
The issue with this technology stems not from its viability, which is proven, but rather from the timing of its implementation. Data centers must be specifically designed to accommodate the technology, so the challenge for a wide-scale rollout will be to partner early with data center owners and developers. At the moment, it appears that a rollout isn’t likely until 2028. As a result, the technology’s economics and long-term potential remain a mystery. Still, Chemours has partnered with digital infrastructure providers and manufacturers to prepare for a rollout.
I won’t take a stab at rendering an Adjusted EBITDA estimate for Chemours’ data center cooling business due to all the unknowns. Instead, I’ll regard the business as a valuable call option to the company’s intrinsic value. What is clear, however, is that the effort has considerable upside potential for Chemours, with minimal downside.
PFAS Liabilities and Other Risks
The ugly part of Chemours is its “per- and polyfluoroalkyl substances,” or “PFAS” liability. This should be front and center for any investor in the company.
PFAS is a class of chemicals known as “forever chemicals” because they don’t break down easily. DuPont began using PFAS in the production of Teflon in 1946. By the 1960s, DuPont knew the chemical was toxic to animals and accumulated in human blood. DuPont’s West Virginia manufacturing plant discharged PFAS into the air and water in the Ohio River Valley, the source of drinking water for more than 70,000 people.
Chemours was saddled with part of DuPont’s PFAS legal and financial burden when it was spun off from DuPont. As such, it is responsible for shouldering a portion of the remediation and other costs.
In 2021, Chemours, DuPont, and DuPont’s agriscience spinoff, Corteva (CTVA), entered into a settlement to resolve legal disputes and established a cost-sharing arrangement to support future PFAS liabilities. The terms of the settlement are spelled out in this press release, a key part of which is excerpted below:
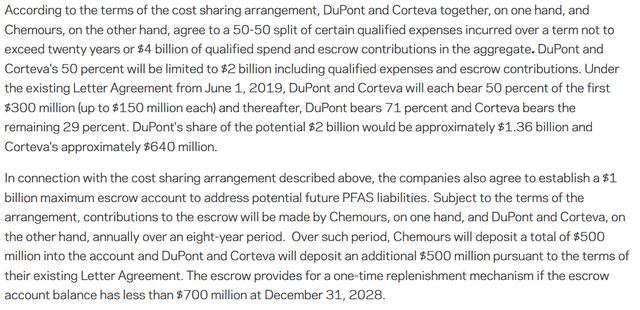
Source: Chemours Press Release, Jan. 22, 2021.
The most recent PFAS development occurred in August, when Chemours, DuPont, and Corteva agreed to an $875 million settlement with the State of New Jersey over PFAS and other environmental claims. Chemours will pay 50% of the approximately $500 million present value of the settlement over 25 years.
In a separate case, a federal judge ordered Chemours to stop unlawful PFAS discharges from its Washington Works facility into the Ohio River, highlighting ongoing reputational and compliance risk.
The greatest uncertainty regarding PFAS litigation stems from personal injury and landfill-related claims if regulators pursue waste operators and manufacturers. There is no reliable way to estimate this potential liability at the moment.
PFAS is therefore an overhang on Chemours’ stock price, and potentially also on its capital allocation. Its most recent financial statements estimate a PFAS environmental remediation liability of $607 million and an accrued litigation liability of $207 million, for a total liability of $814 million as of September 30. In my analysis, I have assumed an obligation of $1.4 billion, which I believe is conservative.
Another risk to Chemours stems from the lapse of its refrigerant patents. Most of the patents that protect its Opteon business will remain in force into the early 2030s. The company is working on new formulations to extend its protection, but there is no guarantee of success.
Chemours also faces execution risk if it continues to add HFO production capacity as planned and demand fails to pan out as the company expects.
Valuation
The Chemours investment thesis hinges on the company’s Adjusted EBITDA margins inflecting upwards over the coming years, as illustrated in the chart.
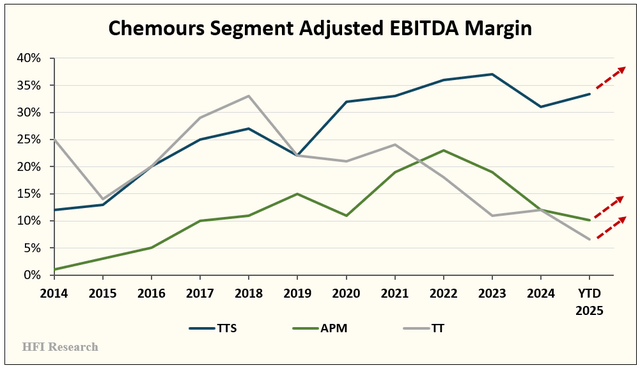
The TTS segment margins should increase from additional high-margin HFO sales, while the TT and APM segment Adjusted EBITDA should increase more significantly as their respective cycles turn.
I don’t know when APM and TT’s cycles will turn with any precision, but I’m highly confident that, first, they will turn, and second, that Chemours’ stock will move higher well in advance of the upturn. The return upside from Chemours’ current depressed stock price is simply too large for the shares not to move aggressively upon the first glimmer of a sustained recovery.
Chemours is currently trading at an EV/Adjusted EBITDA valuation of approximately 7.5-times, at the high end of its historical range.
Using the Adjusted EBITDA estimates for 2028 for each operating segment, as discussed in my investment thesis above, I expect Chemours to earn roughly $1.5 billion in Adjusted EBITDA before corporate expenses. Applying a 7.0-times EV/Adjusted EBITDA ratio and assuming $3.5 billion of net long-term debt, a PFAS obligation net present value of $1.4 billion, $250 million of corporate overhead, and 150 million shares outstanding, Chemours shares are worth $27 per share, which implies 125% upside from their current price of $12.
In a bull scenario that assumes robust growth of the TTS segment and cyclical-high Adjusted EBITDA from the APM and TT segments (specifically, TTS’s Adjusted EBITDA reaches $925 million, TT reaches $800 million, and APM reaches $250 million), corporate overhead of $250 million, net long-term debt of $3.5 billion, and a PFAS liability of $1.4 billion, Chemours’ Adjusted EBITDA would be $1.7 billion. At a slightly lower EV/Adjusted EBITDA valuation of 6.0-times to account for a cycle-high discount, Chemours’ stock would be valued at $36, for 200% upside.
In a downside scenario that assumes 2028 Adjusted EBITDA of $1.2 billion, a 6.5-times EV/EBITDA multiple, $3.5 billion in net long-term debt, and a $2.5 billion PFAS obligation, the shares would trade at $14, still above today’s price of $12. The margin of safety between price and value that exists in an adverse scenario is one of the reasons I like the shares below $14.
Chemours investors should also keep in mind that the shares have further upside if the immersion-cooling initiative pans out. For perspective, an additional $200 million of Adjusted EBITDA would increase Chemours’ valuation to $35 per share, and $44 per share in the bull scenario sketched above.
Conclusion
The Chemours thesis has some “hair,” to be sure. Shareholders must gauge the PFAS risk and its impact on the company’s valuation. However, the issue has weighed on Chemours’ market valuation in the past. It continues to do so, and even if it persists, it’s unlikely to prevent the shares from rallying amid a cyclical recovery. Consider, for example, that in the 2017-2018 timeframe, Chemours shares traded above $50 at a 6.5-times EV/EBITDA valuation on $1.4 billion of Adjusted EBITDA.
This time around, I believe a price above $30 is achievable in the next three years, for a compound annual total return of 37% for investors buying today at $12. Such a return should be more than satisfactory for aggressive investors who have the patience to hold through the inevitable volatility in the share price. Given these returns, I believe investors should consider buying Chemours shares today.
Part VI: AdvanSix: An Opportunity to Buy at Cyclical Lows
AdvanSix (ASIX) was spun off from Honeywell on October 1, 2016, to create a company that could focus on pursuing its unique growth strategy. ASIX occupies a low-cost position in several niche chemical products. The company’s products face an oversupply and weak demand, which is removing capacity. Prices are currently unsustainable, and ASIX is positioned to thrive once conditions improve.
The stock has trended lower since hitting its last cyclical peak in 2022.
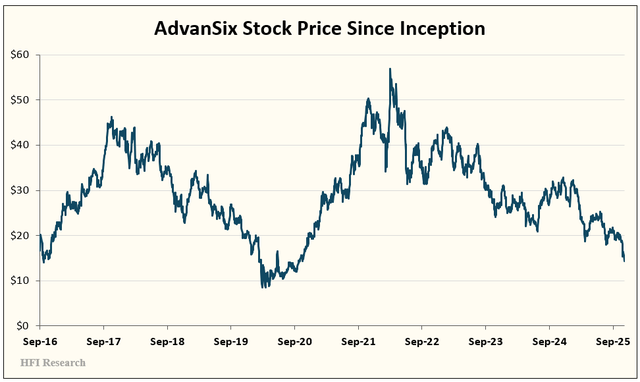
Stocks like ASIX generate the highest returns when they’re bought at cyclical lows, when industry conditions and investor sentiment are in the dumps. That’s where ASIX is today, which makes its stock an attractive long-term buy.
ASIX Overview
ASIX operates an integrated chemical manufacturing chain with five production sites across the U.S. The company converts cumene, ammonia, sulfur, and other feedstocks into nylon 6 resin, caprolactam, ammonium sulfate, and various phenol and acetone-based intermediates. Through its vertical integration, it captures value at each step of the production chain, lowering unit costs and improving margins.
Nylon 6 & Caprolactam
Nylon 6 and caprolactam account for approximately 41% of ASIX’s revenue. The split is 23%/18% between nylon and caprolactam. Plant nutrients account for 30% of revenue, while various chemical intermediates account for the remaining 29%.
Approximately 90% of ASIX’s sales take place in the U.S. Its customers operate across U.S. industry in construction, fertilizer, agrochemicals, plastics, solvents, packaging, adhesives, and electronics. Its U.S.-centered operations provide an additional competitive advantage from lower transportation costs and logistical advantages relative to global competitors selling in the U.S. ASIX’s U.S. weighting renders it exempt from the reciprocal tariffs that have negatively impacted its domestic competitors, most of which are large, diversified chemical companies.
ASIX’s products are derived from the chemical chains illustrated in the graphic below.
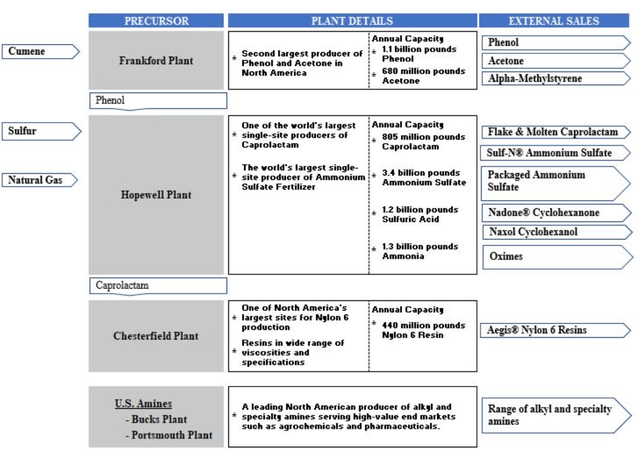
Source: AdvanSix 2024 10-K.
Nylon 6 is used to make fibers for textiles, automotive parts, carpets, clothing, and engineering plastics such as gears and bearings. Its strength and heat resistance make it an effective electrical insulator, while its durability makes it suitable for packaging.
Caprolactam is the key feedstock to nylon 6. ASIX is the global low-cost caprolactam producer, which confers a durable competitive advantage as long as end markets are not glutted, as they are today. The caprolactam market is consolidated, with the top three producers, Fibrant, BASF, and Sinopec, holding more than 30% market share.
As in other chemical segments, global supply capacity for nylon 6 and caprolactam has expanded significantly in recent years, with China leading the charge. At the same time, global demand has been weak. The combination of rising supply and tepid demand led to price declines. Low prices for both caprolactam and nylon 6 have driven margins and capacity utilization lower since 2023. ASIX provided the following data on the nylon market in its third-quarter earnings call presentation.
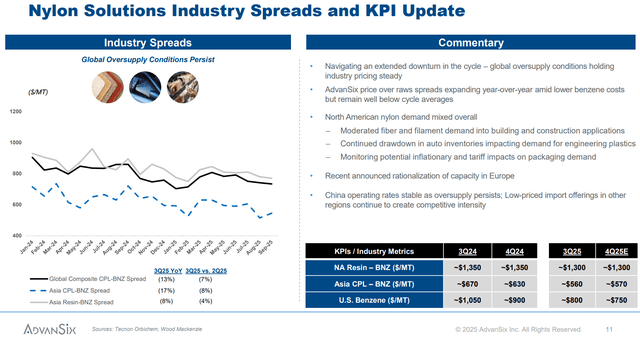
Source: AdvanSix Q3 2025 Earnings Presentation, Nov. 7, 2025.
The removal of high-cost supply will drive an initial recovery. The recovery will progress as capacity utilization rates increase.
The outlook is more constructive over the longer term. Nylon 6 and caprolactam are expected to grow at a mid-single-digit rate through the early 2030s, driven by higher demand for auto parts, plastics, electronics, and textiles.
Ammonium Sulfate
The Raschig process by which ASIX produces nylon 6 throws off significant volumes of ammonium sulfate, which the company sells as fertilizer. Ammonium sulfate is nitrogen-rich, providing plants with the nitrogen and sulfur they need to grow.
Ammonium sulfate’s near-term outlook is brighter than nylon’s, as end markets are not glutted. Ammonium sulfate is also expected to grow in the mid-single-digit percentage range over the coming years, driven by higher demand from agriculture. Agricultural demand from year to year depends on crop prices and planting intensity.
Sulfate demand has remained robust even in recent quarters. ASIX is currently transitioning its product toward “granular ammonium sulfate,” which is easier to spread, slower-releasing, and has higher sulfur content than common substitutes. Due to its various benefits, the granular product is sold at a premium.
By the end of 2025, ASIX will have transitioned 72% of its ammonium sulfate production into higher-margin granular form. The company has dubbed the transition to granular its “SUSTAIN” program. The program is aimed at increasing the company’s granular ammonium sulfate capacity by 200,000 tons, which fetches a premium of $75 per ton. The premium stands to increase ASIX’s mid-cycle Adjusted EBITDA by more than $15 million annually.
ASIX’s SUSTAIN program has consumed most of its growth capex in recent years. The project is slated for completion in 2026, and capex should decline in 2027 and beyond.
Chemical Intermediates
In addition to ammonium sulfate, ASIX’s nylon 6 manufacturing process throws off various chemical intermediates that the company also sells. These products include phenol, acetone, and other co-products. Growth from these chemical intermediates is expected to track in the low single digits over the coming years.
ASIX benefits from structurally higher acetone prices and margins attributable to U.S. antidumping tariffs. Imports have declined from 230,000 tons in 2018 to 64,000 tons in 2024, driving acetone-propylene spreads from $0.10 per pound to a sustainable range of $0.15 to $0.20 per pound. The larger spread stands to add approximately $30 million to ASIX’s mid-cycle Adjusted EBITDA.
Undergoing a Cyclical Downturn
To appreciate the extent of the downturn in which ASIX finds itself, consider that in 2022—which can be used as a benchmark for a high-margin year—ASIX generated $1.9 billion in revenue and $308 million in Adjusted EBITDA, for a margin of 15.9%.
Conditions deteriorated dramatically beginning in 2023. That year, a 22% decline in selling prices amid flat volumes sent revenues down to $1.53 billion. Adjusted EBITDA fell to $154 million, for a 10% margin. In 2024, revenue was flat while Adjusted EBITDA declined to $142 million, resulting in a 9.4% margin.
The downturn has persisted in 2025. In the first nine months of the year, ASIX reported $1.16 billion in revenue—down 2% from the 2024—and $132 million in Adjusted EBITDA, for a margin of 8.8%. Moreover, margins have trended lower. In the third quarter, ASIX’s Adjusted EBITDA margin declined further, to 6.6%. The culprit of the margin decline was lower nylon 6 volumes. Looking ahead, the fourth quarter is the company’s seasonally weakest. Prices remain low, so margins will remain weak.
ASIX’s capex has been high in recent years to fund its SUSTAIN program investments. Capex is slated to remain high in 2026, then decline in 2027 and presumably thereafter, as shown in the slide below.
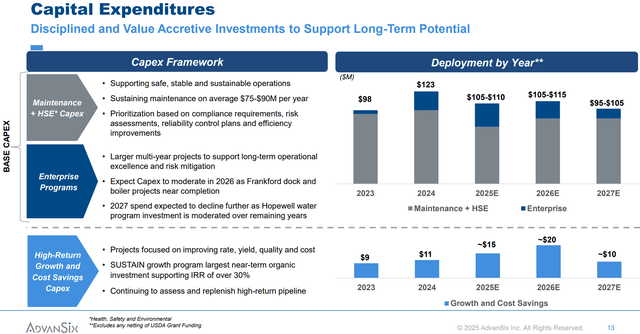
Source: AdvanSix Q3 2025 Earnings Presentation, Nov. 7, 2025.
Once ASIX completes its growth projects, it will benefit from increased operating cash flow and lower capex, boosting free cash flow. The higher profit margins, returns on capital, and free cash flow resulting from ASIX’s recent capex hold the prospect of pushing the company’s profitability above previous cyclical highs over the coming years.
Despite the higher capex, ASIX has remained free cash flow positive in 2025. The $32.3 million in free cash flow it has generated year-to-date, after adjusting for working capital changes, is equivalent to $1.20 per share.
ASIX’s balance sheet is strong, with $250 million drawn on its revolving line of credit and equity of $824 million.
Attractive Investment Characteristics
ASIX shares trade at a 4.5% dividend yield at their current price of $14.40. The dividend is sustainable even at today’s market conditions, which are characteristic of a cyclical low. At its current trailing-twelve-month Adjusted EBITDA of $142 million, the company should be roughly cash flow neutral in 2026, assuming the $110 million of capex indicated in management’s guidance. The company’s $0.16-per-share quarterly dividend should be safe barring a further deterioration in end-market conditions.
The company’s competitive position is superb, albeit in a pure commodity market. ASIX benefits from its position as the leading global low-cost producer of caprolactam and Nylon 6. It derives its competitive advantage from its integration of the entire nylon 6 chemical production chain. ASIX’s competitive advantage is durable because its foreign competitors are unable to replicate its production configuration, logistics, and cost advantages. The upshot is that ASIX occupies a dominant position with BASF in U.S. caprolactam and nylon 6 production. The company’s status as a low-cost producer enables it to remain profitable at lower prices than its competitors while also running at higher capacity utilization rates.
ASIX is also competitively advantaged as a low-cost ammonium sulfate producer. It owns and operates the largest production facility in the U.S.
The company derives another competitive advantage from low natural gas supply costs. Natural gas is a raw material in the production of caprolactam and ammonium sulfate, as well as a source of energy for the company’s production facilities.
At the moment, the ammonium sulfate market is relatively healthy. The segment will serve as ASIX’s profit center as the domestic nylon 6 market works off its oversupply.
ASIX’s relatively small size in its industry and its attractive, sustainable, low-cost position in niche chemical markets in which producers earn attractive full-cycle returns on capital make it an attractive acquisition candidate. If the stock stays at its current price, I believe an acquisition at a significant premium is likely.
Valuation
Given ASIX’s trailing-twelve-month Adjusted EBITDA of $142 million and an enterprise value of $770 million, its shares currently trade at 5.5-times EV/Adjusted EBITDA—at a low point in the nylon 6 cycle. This low multiple fails to discount any improvement in the company’s financial results going forward, despite the likelihood of a cyclical recovery.
On a normalized mid-cycle Adjusted EBITDA of $200 million, ASIX trades at an EV/Adjusted EBITDA multiple of 3.9-times. A proper valuation at that point would apply a 6-to-8-times multiple, for a stock price of $30 to $45 per share. The lower bound of this value range is equal to the company’s book value per share and stands more than 100% above the current stock price.
I estimate that ASIX can generate cycle-high Adjusted EBITDA in the $250 to $300 million range. On that figure, the stock trades at a 2.8-times EV/Adjusted EBITDA.
Cycle-high Adjusted EBITDA is also consistent with earnings per share of $4.70 and free cash flow per share of $5.10. Applying a ten-times multiple puts the cycle-high share price at around $50. Such a price is consistent with ASIX’s previous cyclical high price achieved in 2022. That year, the company earned Adjusted EBITDA of $308 million and diluted earnings per share of $5.92.
At five-times cycle peak Adjusted EBITDA, ASIX shares would trade at approximately $40, versus the current price of $14.30.
Another way to look at ASIX’s equity value is that the company’s book value per share stands at $30.45. Assuming it can earn a mid-teen return on capital—as it has in the past—then earnings per share would be approximately $4.50, which is also consistent with a mid-$40s share price at a ten-times P/E.
Risks
ASIX investors risk having to sustain a prolonged downturn in nylon 6. They should therefore be ready to endure lower prices as the nylon 6 cycle bottoms out. Importantly, the company’s heavy weighting in the domestic market, its products’ low-cost positions on their respective cost curves, and its strong balance sheet mean that it will survive the ongoing downturn and benefit disproportionately when the upcycle arrives.
The cycle will eventually turn. High-cost nylon 6 supply is currently operating at a significant loss. As such, it will have to be rationalized through facility closures, idling, and consolidation. Prices are so low that even low-cost producers—including ASIX itself—are moderating volumes and lowering their capacity utilization. Clearly, the current market dynamics are unsustainable for the industry, which makes an upturn all the more probable.
Among the other risks for ASIX investors would be an unexpected falloff in fertilizer demand and significantly higher-than-expected capex, which would reduce free cash flow.
Conclusion
ASIX shares will turn higher well before the recovery in its end markets is clear. Nearly every investor has AI at their fingertips, so the ability to detect a turn in the macro is more widely available than it’s ever been. The only reliable edge an investor can have is time arbitrage over the course of a capital cycle. Since the duration of the downturn is not knowable—its turn is only discernible in hindsight—owning shares in low-cost producers is paramount to a successful investment outcome. This is what an investor obtains with ASIX.
In capital cycle investing, the best times to buy are when the outlook is bleak. ASIX investors should adopt a three-year investment horizon and be prepared to hold until the recovery takes effect. Short-term paper losses are part of the process. But the massive returns on offer for those who can buy make them well worth the temporary inconvenience.
Now is a good time to buy beaten-down cyclical chemical names, and ASIX is one of the best.
Nylon is one expression of the cycle. Titanium dioxide is another—often more volatile, and often faster to reprice once supply finally tightens.
Part VII: A Titanium Dioxide Market Recovery Appears Imminent
The titanium dioxide market is in a historic downturn that has gone on for three-and-a-half years. Over that period, the negative cyclical forces have gone a long way toward reducing supply to today’s tepid demand conditions. In the process, they’ve set the stage for a recovery.
The titanium dioxide market’s brutal downcycle has forced significant changes, improving its macro outlook. The downcycle flushed out weak industry players, forced larger players to operate in a more disciplined manner, reduced producers’ inventories, brought about anti-dumping regimes in key importing regions, and curtailed production capacity to a point where even a slight demand uptick will drive titanium dioxide prices higher.
These and other market changes have laid the groundwork for a cyclical recovery over the next few quarters, assuming demand remains flat or improves. If the worst of the downturn truly is in the rearview mirror, the industry should enter the 2026 contract season with tighter supply and better pricing prospects than many headlines suggest. If prices or volumes show any indication of ticking higher, their stocks are likely to surge in anticipation of a recovery.
Temporary Factors Drove Third-quarter Weakness
Third-quarter results are in for the major titanium producers, Tronox, Kronos Worldwide, and Chemours. The results show that market conditions during the quarter were far weaker than these companies had expected earlier in the year. Notably, several of the most significant factors contributing to the weakness were temporary in nature.
For one, Venator’s insolvency caused it to liquidate its titanium dioxide at below-market prices. The surge in supply amid tepid demand led to prices declining more than expected. The situation was particularly acute in Europe, where Venator and Kronos have a significant presence. In their third-quarter earnings conference calls, the management of the major titanium dioxide producers alluded to the fact that this inventory liquidation will persist through the end of the year. Once it has run its course, however, the supply-demand picture will tighten, and prices are likely to rise.
Aside from Venator, other distressed global producers have dumped their titanium dioxide inventory onto the market regardless of price. Prices can recover once this excess supply is absorbed.
Each of the major market participants has slimmed down its inventory levels, consistent with late-cycle behavior in commodity cycles. Lower inventories tend to shorten the remaining duration of the downturn. Any uptick in demand in these conditions can cause prices to surge.
Another temporary negative factor that depressed the market in the third quarter was India’s stay of anti-dumping tariffs on titanium dioxide. The stay allowed low-priced Chinese producers to surge their exports to India. The supply surge weakened Asian titanium dioxide prices, with negative knock-on effects on the global market.
Fortunately, India’s stay was imposed by a court on procedural grounds. As such, it’s likely to be reversed over the coming weeks. India is the second-largest importer of titanium dioxide, so import tariffs will strengthen supply and benefit producers outside China.
Another temporary negative during the quarter was the downstream destocking by customers in the coatings industry. These customers cut their titanium dioxide orders deeper and earlier than usual. However, Tronox management indicated that order patterns have already begun to normalize in the fourth quarter. Once the working capital adjustment among downstream customers is complete, demand for titanium dioxide feedstock can improve.
The Supply Side Will Drive the Recovery
Commodity market recoveries begin when supply has fallen in line with or below demand. The titanium dioxide market appears to have reached this point.
The main factor behind the market’s recovery potential is the unprecedented amount of global production curtailments. Literally every producer of size has either permanently shut down or idled capacity. Furthermore, the production facilities in operation today have cut back on volumes.
All in all, several management teams have cited 1.1 million tons of production curtailments in a global market that stands at approximately 10.0 million tons per year. The supply adjustment bodes well for prices going forward. It gives me the confidence to state that a recovery isn’t a matter of “if,” but of “when.”
The second most important factor driving a recovery in the titanium dioxide market is the imposition of anti-dumping measures. These measures have been enacted in the U.S., the European Union, Brazil, Saudi Arabia, and elsewhere. The measures are intended to increase the industry’s competitiveness relative to Chinese competitors, which benefit from low coal-based electricity costs, lower labor costs, and more lax environmental regulations. Chinese producers also receive government subsidies that make them even more price-competitive on the global stage.
The anti-dumping measures are having a significant impact. In the U.S., Section 301 tariffs have reduced titanium dioxide imports to 90,000 tons per year in a market that consumes one million tons per year. Meanwhile, anti-dumping measures imposed by the EU, Brazil, and Saudi Arabia are set to protect a market that consumes a combined 1.2 million tons per year.
Anti-dumping measures put in place to date have eliminated approximately 800,000 tons per year of low-cost titanium dioxide from the global market. To illustrate their impact, Tronox included this slide in its investor presentation. While the measures don’t eliminate Chinese imports, they do significantly reduce them.
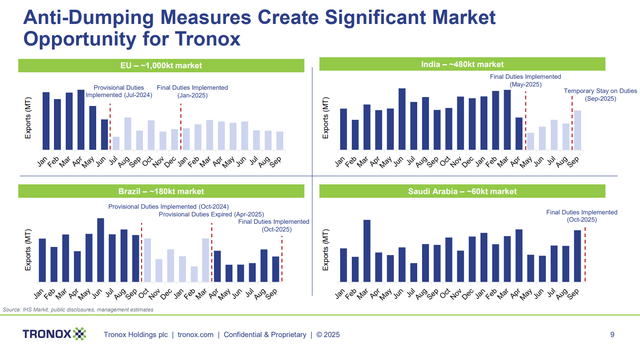
Source: Tronox Q3 2025 Earnings Presentation, Nov. 6, 2025.
Since the anti-dumping measures are all being applied at the same time, they’re putting a major dent into Chinese dumping. This will be a major factor in a titanium dioxide price recovery.
With fewer export channels, titanium dioxide inventories are piling up in China. Higher inventories are depressing domestic prices and forcing a supply rationalization that includes permanent closures of production facilities and consolidation among weaker producers. The reduction of low-cost supply will benefit the titanium dioxide market for years.
Another positive development that will hasten a recovery is Venator’s insolvency. Venator, which declared insolvency in May, had been the fifth-largest global titanium dioxide producer in a market where the top five producers accounted for more than 50% of global output. Venator’s exit whittles down the number of dominant producers to four. The removal of the fifth-largest producer will allow the remaining four to gain share. Kronos is particularly well-positioned. It is the best positioned to win market share from Venator’s exit from Europe and has acquired Venator’s 50% interest in the U.S. Louisiana Pigment Company.
Venator’s exit will reduce the urgency among the remaining major producers to undercut each other based on price. In effect, it’s a step toward oligopoly in the industry, just as trade measures are removing a large share of the lowest-cost supply. The market can enter 2026 with far more favorable competitive dynamics for producers than it entered 2025.
Another positive outcome from the downcycle has been that large titanium dioxide buyers increasingly favor larger producers as suppliers. After more than three years of reliability issues, insolvencies, and supplier plant shutdowns, buyers are committing to the “Big Three” outside of China, namely, Chemours, Tronox, and Kronos. These dominant producers are insulated against broader market turbulence through their partial or full vertical integration. They operate in multiple regions, can better meet customers’ product specifications, and can swing volumes across their various plants.
The shift toward the larger producers will enable them to emerge from the current downturn with greater market share and better line of sight regarding contract volumes and duration.
Altogether, these factors are likely to drive titanium dioxide prices higher. Even a low-to-mid-single-digit price increase will push the major producers’ operations into positive free cash flow territory. At that point, their survival will no longer be in question, and their stock prices should trade significantly higher.
Risks
These are among the most volatile stocks in the market, so investors should expect significant price swings. Positions should be sized to withstand the inevitable large selloffs, which I expect to be severe, yet temporary, before a market recovery carries the entire group much higher.
For Kronos and Tronox, dividends are at risk if the market doesn’t turn higher over the coming quarters. Buyers of these stocks should not count on the continuation of dividends.
From a fundamentals perspective, the largest risk is a decline in titanium dioxide demand from today’s already weak level. Several demand variables could cause volumes to decline and force further retrenchment among global titanium dioxide producers. Foremost among these risks are a falloff in U.S. housing activity and a deepening European economic contraction.
Lastly, a recovery could be put at risk if policies in importing nations dilute the impact of anti-dumping measures.
Conclusion
Titanium dioxide is a cyclical market that is possibly probing its cyclical trough. Investors looking to play a recovery from a deep cyclical downturn should consider the titanium dioxide producers. In order of risk, from lowest to highest, investors should consider Chemours, Kronos, and Tronox. The list is reversed in terms of upside potential from current prices. A basket approach, in which an investor holds all three at whatever weighting makes sense, is also worth considering.
The cyclical trough is the time when sentiment among market participants and observers is at its lowest, and headlines about the industry are the scariest. It’s also the hardest time to step up and buy. Nevertheless, I’m confident that it is only a matter of time before the titanium dioxide cycle inflects. When it does, long-term investors who can hold through the selloffs and make it to the other side will be amply rewarded with multi-bagger returns.
With the market backdrop set, we can move to a higher-beta expression of the same cycle, where company-specific actions can magnify the recovery.
Part VIII: Tronox: Improving Prospects in 2026 and Beyond to Drive Shares Higher
Tronox is a recovery play on the titanium dioxide market with added kickers from company-specific developments. I’ve followed the company’s ups and downs since 2012, and I believe this is a good time to initiate a long position.
Today, finds itself in one of its industry’s most protracted downturns. The downturn’s length is attributable to aggressive new Chinese competitors and tepid global demand. Tronox’s revenues have trended lower since 2021, tracking the downturn in the titanium dioxide market.
Historically, the company has exhibited some of the most extreme cyclical price swings of any company I know. The chart below illustrates how closely its share price follows the ups and downs of titanium dioxide prices. It depicts the market’s swings that occurred from 2010 to 2021.
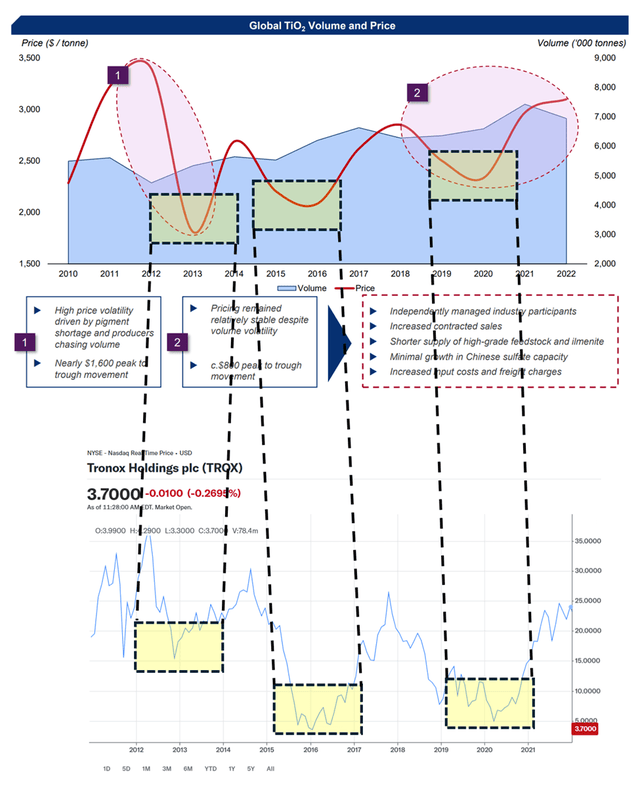
Sources: Venator May 2023 Investor Presentation, Yahoo! Finance Oct. 28, 2025. Black-dotted lines and highlights added by author.
Today, I believe Tronox is in another cyclical trough. While the duration of the trough can’t be known with any degree of precision, improvements within the company are set to boost EBITDA and cash flow in 2026, which, in turn, should support its stock price. By the time the titanium dioxide market shows signs of a recovery, I expect Tronox shares to be bid far above their current price.
Investment Thesis
Tronox’s investment thesis has three parts.
First, protectionist anti-dumping measures are likely to benefit titanium dioxide producers outside of China in 2026.
Second, Tronox’s cost reduction initiatives will boost EBITDA and cash flow in 2026. Third, the titanium dioxide market will recover once inventories are depleted and demand returns, driven by increased construction spending and growing GDP.
Third, after the company’s EBITDA and cash flow improve in 2026, I expect the titanium dioxide market to recover in 2027. Even a mild recovery will turbocharge the stock’s upside move.
I expect these factors to send Tronox shares more than 100% above their current price over the next two years, and even higher over subsequent years. Tronox is most appropriate for long-term holding, and investors must be prepared to stomach the inevitable volatility during their holding period.
Titanium Dioxide Market and Protectionist Measures
Titanium dioxide is the primary pigment used to whiten paints, coatings, and plastics. Its demand is tied to activity in construction, housing, automobile manufacturing, and to broader GDP.
The titanium dioxide market is dominated by four firms, which combined account for around 50% of the global market. These are the China-based LB Group, Chemours, Tronox, and Kronos. Smaller operators based in China and Europe account for most of the remainder of the market. Chinese production accounts for approximately 60% of total global production.
The titanium dioxide market is expected to grow significantly through 2030, as shown in the chart below.
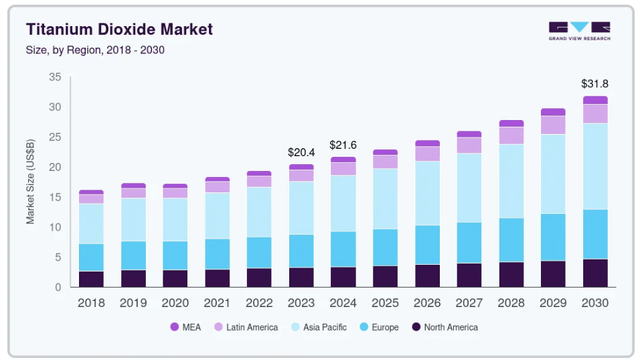
Source: Grand View Research.
LB Group, based in China, is the world’s largest producer of titanium dioxide. It has grown market share at the expense of its three Western competitors. Its low-cost electricity and labor, coupled with relatively lax regulatory requirements, give it a competitive advantage. However, increasing trade protection measures in the EU, Brazil, Saudi Arabia, and the EAEU (comprised of Russia, Kazakhstan, Belarus, Armenia, and Kyrgyzstan) have sought to level the playing field between the Chinese producers and their global peers. In the U.S., while titanium dioxide imports haven’t been targeted directly, they are subject to the 25% “Section 301” tariff overseen by the U.S. Trade Representative.
Most titanium dioxide tariffs have been enacted throughout 2025. The measures have already been effective. By May 2025, China’s titanium dioxide exports had already fallen by approximately 20%.
Additionally, titanium dioxide markets in consuming countries are set to improve, with lower supply amid stable demand set to increase prices. Before protectionist measures are implemented, major titanium dioxide buyers tend to front-load their purchases from low-cost producers that will be subject to tariffs. These purchase orders dampen demand after the protectionist measures are enacted. Eventually, however, they are likely to boost prices for producers outside of China. I expect the market to benefit from the measures in 2026 and beyond. If Chinese product has fewer export destinations, LB Group’s margins could come under pressure at home, further weakening its competitive position in the global market.
Cyclical Forces Will Facilitate a Recovery
Excess production amid international tariffs has caused excess titanium dioxide product to flow to the U.S and Japan. Even with tariffs, these countries’ producers can be undercut by Chinese imports, particularly in the standard rutile titanium dioxide grades. However, domestic producers of premium and specialty grades tend to face far less competition from foreign sources. Higher inventories have pushed prices lower. Tronox
The titanium dioxide market will recover in time. Cyclical forces are already at work. Most producers have idled their high-cost plants. Tronox idled its Botlek pigment site in the Netherlands, which accounts for approximately 8% of its production. Chinese producers have idled some capacity amid weak market conditions.
I don’t have any special insight into when this cycle will turn, but I am certain of two things. First, these stocks are best bought for long-term holding when the outlook is at its most grim. Second, the first indication that the market is improving will send these stocks surging, as investors jump on the “all clear” bandwagon.
When the cycle turns and titanium dioxide prices rise, Tronox benefits from being one of the few vertically integrated titanium dioxide producers. It sources approximately 85% of its raw materials used in titanium dioxide production internally.
Vertical integration has advantages and disadvantages in titanium dioxide production. The biggest disadvantage is that mining tends to be a low-return business. But the advantages are considerable. When titanium dioxide prices are high, the prices of the product’s feedstock, ilmenite and rutile, also increase. Raw material price increases put downward pressure on margins for non-integrated producers at the time when their margins should be approaching cyclical highs. Due to Tronox’s vertical integration, its margins and fee cash flow are poised to increase significantly more than those of its competitors during upcycles, facilitating debt reduction and dividend increases.
EBITDA Growth Likely Ahead
Tronox shares are typically valued in the market based on EV/EBITDA multiples. At its cyclically low EBITDA, it trades at 8.5-times EV/EBITDA. EBITDA guidance was revised lower in the company’s second-quarter conference call.
Tronox’s EBITDA is set to increase in 2026. In late 2024, management launched a cost-savings program intended to reduce operating costs by $125 to $175 million in 2025. As of Tronox’s second-quarter earnings conference call on July 31, management was confident it would meet the goal. The cost savings should translate into higher EBITDA in 2026, assuming titanium dioxide pricing doesn’t fall significantly from current levels.
Other factors are likely to boost 2026 EBITDA. Tronox is upgrading its mining operation by moving feedstock production from lower-quality to higher-quality mines in 2026. The switch will increase EBITDA by $50 million and reduce capex by approximately $100 million. Meanwhile, the Botlek plant idling will further reduce operating costs and capex by more than $20 million.
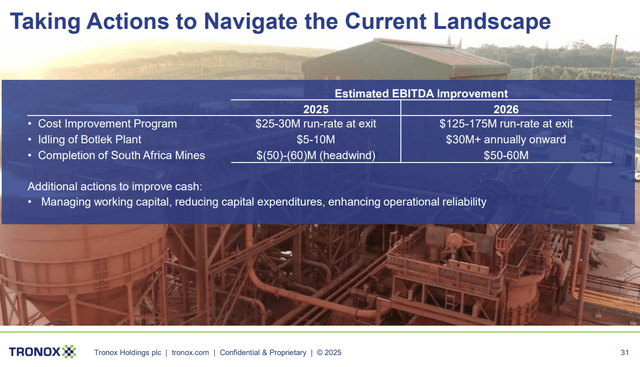
Source: Tronox May 2025 Investor Presentation.
Altogether, I expect Tronox to generate EBITDA of $600 million in 2026, a 38% increase from the $435 million in management’s 2025 guidance. At $600 million in EBITDA, Tronox’s current valuation would represent a 6.2-times EV/EBITDA, which is very low for a company with cyclically low EBITDA. Over the coming years, Tronox shares can benefit from significantly higher EBITDA and margin expansion.
Another way to view the stock’s current valuation is that virtually no improvement in the titanium dioxide market is priced into Tronox’s shares. This makes it even more likely that when the market turns, the shares will surge higher.
Risks
Tronox shares have significant risk. As such, they should be sized at a small level relative to a portfolio. The most significant risk stems from leverage.
The company’s net long-term debt stands at 4.8-times management’s guided full-year 2025 Adjusted EBITDA. This is high, though the EBITDA figure reflects a depressed titanium dioxide market. I expect it to recover beginning in 2026.
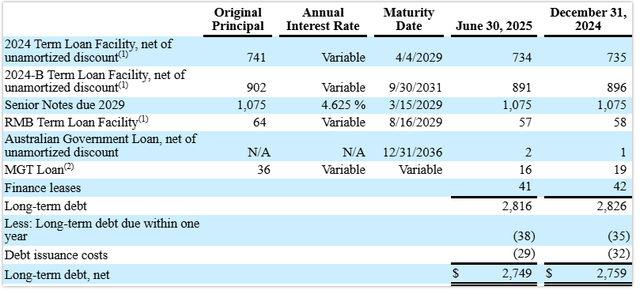
Source: Tronox Q2 2025 10-Q.
Tronox faces a maturity wall in 2029. If the titanium dioxide market hasn’t recovered by then, it could face difficulty refinancing its debt.
On September 15, Tronox priced a $400 million offering of 9.125% Senior Secured Notes due 2030. The notes were offered at par.
The main risk to Tronox shareholders stems from a global recession that sends titanium dioxide prices significantly lower. Tronox could be forced into bankruptcy. There is precedent for such an outcome, as the company declared bankruptcy in 2009.
Conclusion
Tronox has also seen some insider buying this year, which adds support to a recovery thesis. The company has already cut its dividend once this year, reducing the quarterly dividend from $0.125 to $0.05. I don’t expect additional cuts given the improving EBITDA outlook in 2026.
With a lot of bad in the rearview mirror—and priced into the stock—and a little good about to come in 2026, I believe Tronox shares are poised to outperform significantly. Looking beyond 2027, a recovery in its end markets could deliver multi-bagger returns. Investors should consider initiating a position now and adding to it on weakness.
Part IX: Kronos Worldwide: Set to Rebound from a Cyclical Trough
Kronos Worldwide (KRO) is experiencing a brutal downturn in the titanium dioxide industry. Lower sales prices and volumes have caused its earnings and cash flow to go negative for multiple quarters over the past few years, including the recently reported third quarter.
The downturn began in 2022, when higher feedstock costs for titanium dioxide producers coincided with weakening demand from major customers. Since then, Kronos and its peers have experienced declining and weak free cash flow.
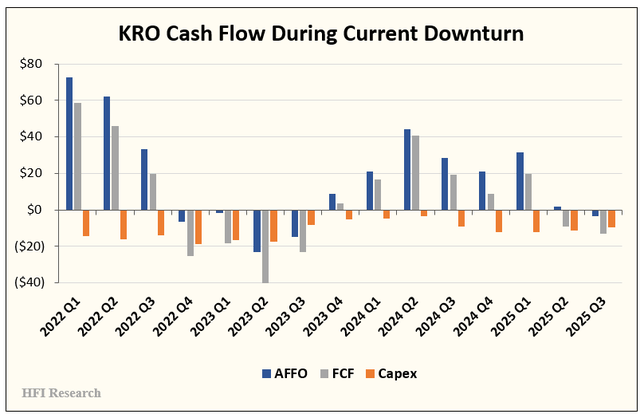
The weakness was caused by excess supply amid tepid demand. In this environment, KRO’s sales prices struggled to keep pace with rising per-ton costs.
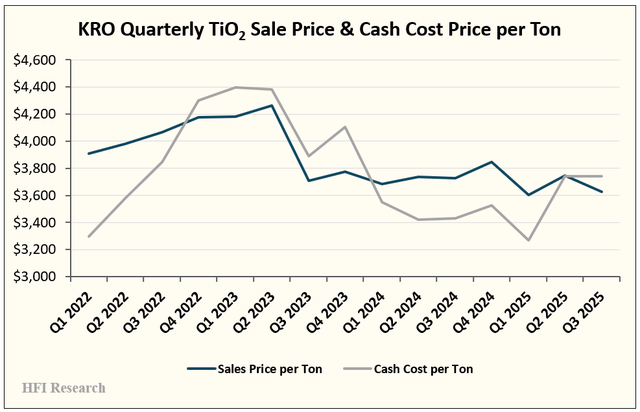
Operating conditions have intensified recently for the entire titanium dioxide industry, prompting additional retrenchment among producers during the third quarter. However, the clear takeaway is that current margins are unsustainable. It is only a matter of time until the market recovers.
Low prices have already led to unprecedented curtailments in global production volumes. The industry’s production capacity has declined. Titanium dioxide inventories are low. Anti-dumping tariffs have removed the primary source of low-cost supply. These and other factors are likely to usher in higher prices. Eventually, producers will have to increase their production volumes, at which point operating leverage will inflect higher.
I expect cyclical factors to usher in a cyclical recovery in 2026. Kronos is likely to enter that period with a strengthened competitive position and enhanced profitability potential relative to its peers. Recovering profits and cash flow will send its shares higher.
Third-Quarter Results Illustrate Trough-Like Operating Conditions
Third-quarter results illustrated the ugly effects of negative operating leverage. The company’s lower sales volumes and lower prices, amid its high fixed-cost structure, squeezed gross margins and cash flow.
EBITDA declined to close to zero. Year over year, it declined from $123 million to $0.6 million. The decline was mostly due to a large one-time gain in the third quarter of 2024 not being repeated, as well as an inventory cost drag unlikely to recur in future quarters.
Unabsorbed fixed costs were the largest non-temporary factor. These are the variable and fixed costs included in the cost of producing titanium dioxide, which grow larger as production capacity declines and less production is spread across a still-high fixed cost base. The breakdown of year-over-year EBITDA changes is illustrated below.
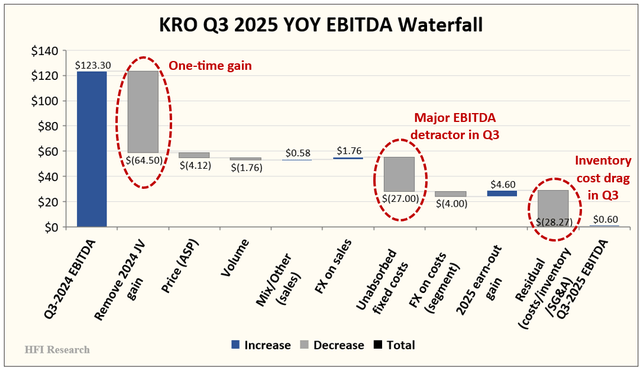
Large unabsorbed fixed costs will reverse from an EBITDA headwind to a tailwind as the company cuts fixed costs and increases capacity utilization. A lower fixed cost base and higher capacity utilization spread lower costs over more units.
Management attributed the company’s poor third-quarter results to significant excess supply in Europe and weak demand from the North American housing sector. These macro factors caused titanium dioxide buyers to hold off on building inventory. The inventory remained at the industry level, pushing down prices. In response to the weak demand and prices, Kronos idled production.
Titanium dioxide prices declined further over the subsequent months, partly due to one-time events such as Venator’s post-insolvency inventory liquidation. Consider that at the beginning of 2025, KRO’s average titanium dioxide selling prices were 2% higher than the year-ago level. After the tariff disruptions in April, conditions turned for the worse. Prices fell as titanium dioxide buyers postponed purchases until tariff uncertainty cleared. In the first nine months of 2025, weak demand led to a 6% year-over-year decline in titanium dioxide prices.
In the third quarter, lower prices and production volumes caused KRO’s operating cash flow, adjusted for changes in working capital, to fall to negative $3.5 million. After $9.5 million in capital expenditures during the quarter, free cash flow was negative $13.0 million. This ugly performance is typical for an industry approaching its cyclical trough.
I expect the company’s cash flow picture to improve over the coming quarters. Lower costs attributable to idled plants and reduced SG&A, coupled with a modest price improvement, will likely enable the company to generate flat to higher free cash flow in early 2026.
Buying Amid the Cyclical Trough
All it takes is a glance at KRO’s stock chart to determine where we are in the titanium dioxide cycle.
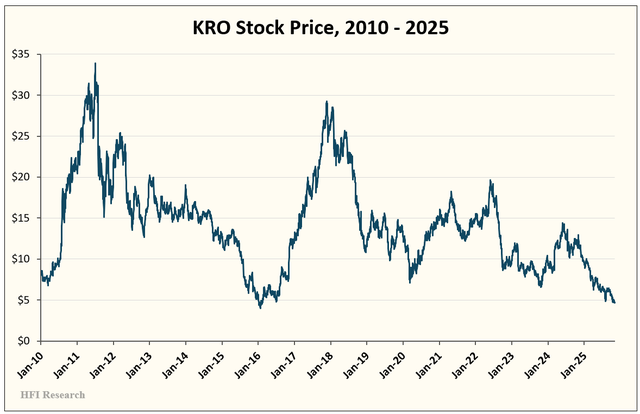
The three-and-a-half-year downturn begs the question of whether conditions will inflect from bearish to bullish. And if so, when?
I remain confident that the titanium dioxide cycle will inflect positively, just as it has for nearly a century. I don’t know precisely when, but the preponderance of data on the state of the industry in the third quarter points to an imminent recovery. I discussed the potential for recovery in the titanium dioxide market in my previous article.
Historically, KRO’s shares have rebounded off their cyclical trough after the company reversed its production capacity curtailments.
Kronos may be close to that moment today. In the third quarter, the company operated at 80% of capacity, significantly below its historical normal rate. For example, in the 2015 downturn, KRO’s capacity utilization bottomed out at 86% before the market recovered, and the stock quintupled over the next two years. During the next downturn, in 2020, KRO’s capacity utilization once again bottomed at 86%. In the more recent 2023 downturn, its capacity utilization bottomed at 65%.
The 2023 downturn is instructive. KRO’s stock turned higher once the company announced an increase in capacity utilization. In fact, the third-quarter earnings announcement was the catalyst that sent the shares surging higher.
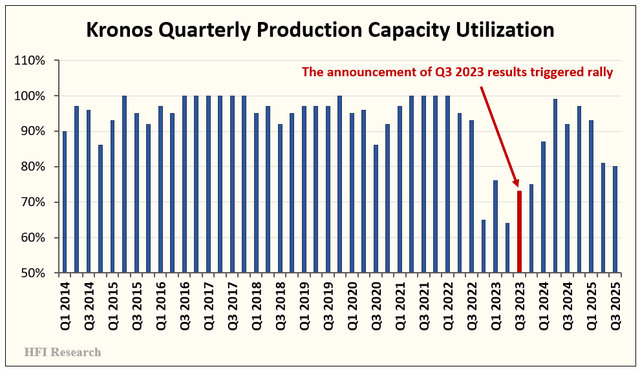
The chart below shows KRO’s stock price right before the third-quarter earnings announcement hit. Notice the rally that ensued afterward.
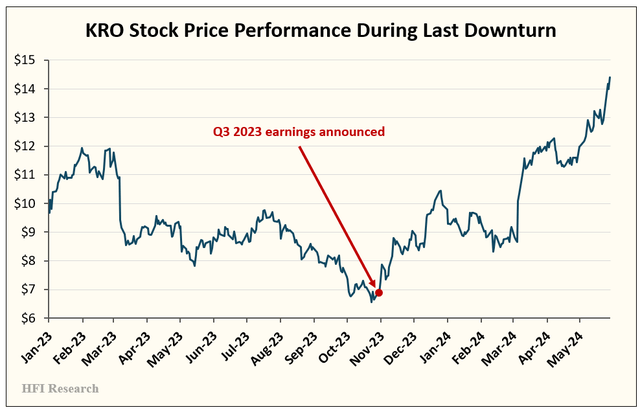
The same dynamic was at play in all past recoveries in Kronos’ stock, and I expect the next one to play out in a similar fashion.
In each case, recovering capacity utilization triggered a strong rebound in the stock price, as investors anticipated the implications of the operating leverage inflection on earnings and cash flow during a titanium dioxide market recovery. I expect a similar dynamic to play out again with Kronos at some point over the next few quarters.
Risks
Kronos shares are at risk from continued weakness in the titanium dioxide market. The company could cut its dividend if conditions don’t improve, so the shares should not be bought for their yield. Offsetting this risk is the fact that the entire titanium dioxide industry is under severe strain. Production is dominated by large players, all of whom are curtailing output.
Due to the risks, aggressive investors should consider a small investment in KRO. The shares clearly have multi-bagger potential, so even a small investment can have an outsized impact on a portfolio’s returns over the coming years.
Conclusion
Kronos and its peers in the titanium dioxide market are probing the troughs of the market cycle. These are the most difficult times to buy, but they can also be the most lucrative. Investors interested in a depressed cyclical play with big upside potential should consider Kronos shares. If conditions improve over the coming quarters, as I expect, the shares offer some of the greatest upside in the stock market.
Part X: Conclusion
The cyclical chemical sector is cheap today for reasons that are real. Many are still experiencing conditions of overcapacity, weak demand, and prolonged destocking. But the cure for cyclical pain is already underway. Inventories are normalizing, high-cost supply is exiting, capital spending is being cut, and operating leverage is beginning to reassert itself. These conditions typically mark the very early stages of an upswing.
Ultimately, success in cyclical chemical investing requires appreciation for the sector’s nuances. The chemical sector is not a single trade, but a collection of distinct value chains governed by cost curves and capital cycles. Understanding where each chain sits in its cyclical adjustment process helps clarify when a recovery is likely to begin, how durable it may be, and when to exit as margins peak. Investors who remain disciplined, focus on fundamentals, and endure the inevitable volatility can position themselves for substantial gains as the cycle turns.
Analyst’s Disclosure: I/we have a beneficial long position in the shares of ASIX, CC, KRO, TROX, EPD, GEL, CLMT, HON either through stock ownership, options, or other derivatives.
Hey - curious to hear your updated thoughts on the sector after recent earnings reports, in particular CC? Does weakness today, provide an opp to top up positions? Thanks