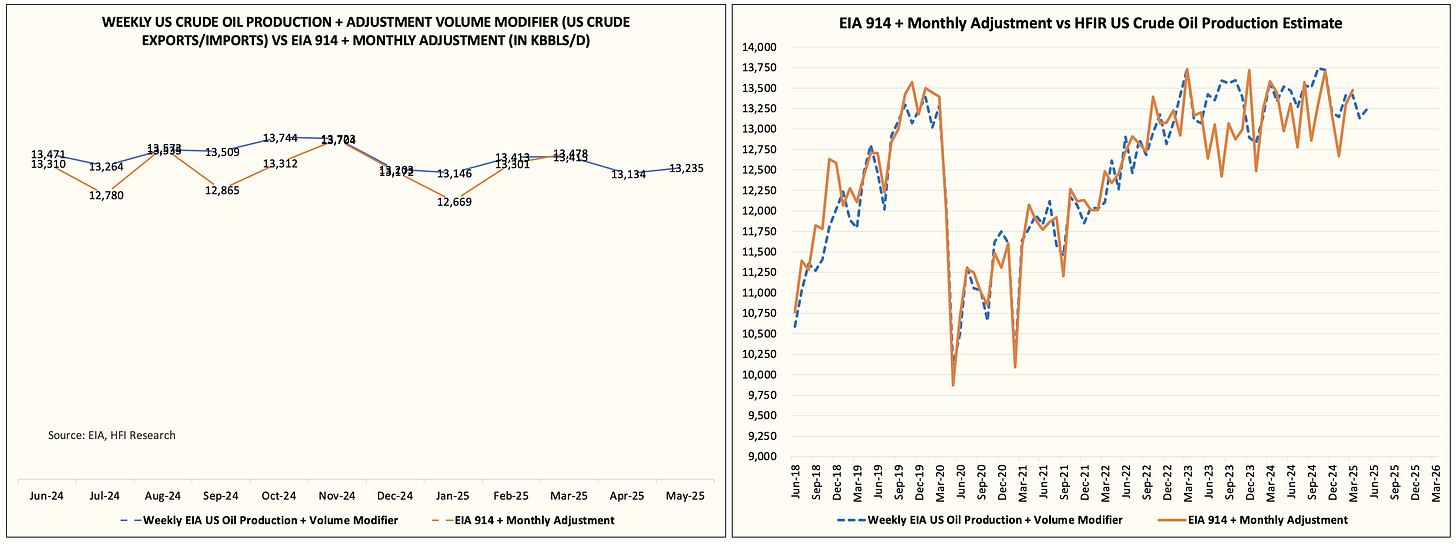
EIA reported an all-time high in US crude oil production for March 2025, clocking in at 13.488 million b/d. While some may take this as a sign of US shale's resilience amidst the oil price downturn, this is the last hurrah before the multi-month decline starts. EIA's reporting methodology also makes it susceptible to underestimation, followed by overestimation, as we will explain below.
But first things first, you can see that EIA reported March US crude oil production at 13.488 million b/d with -10k b/d in adjustment. This makes the effective crude oil production 13.478 million b/d.
This is ~63k b/d higher than our estimate of 13.415 million b/d.
According to our real-time data, the discrepancy in EIA's data came in February when it reported lower headline figures than we expected. Even after the revised data, the 13.24 million b/d for February was lower than the 13.413 million b/d we had. I suspect that some of the overstated headline production in March is to compensate for the understated production in February.
Editor's Note: This has happened frequently in the past. You can see the disproportional spike (orange line) following periods of under-reported production.
Looking at US crude oil production on a 3-month moving average basis, the Q1 average was 13.149 million b/d. January US crude oil production was impacted due to freeze-off (weather), while February was marginally impacted. In aggregate, Q1 US crude oil production is ~400k b/d below the consensus estimate and explains in large part why global oil inventories failed to build.
Looking Ahead
For the people unaware of the data, they will look at March US crude oil production and conclude that US shale is defying gravity when the reality is the opposite.
We are extremely confident that US crude oil production has already started to decline. EIA will likely report April's production at 13.25 million b/d with an adjustment of -300k b/d. Our real-time data shows 13.134 million b/d, but historically, there's ~290k b/d of condensate that does not get included in the crude oil production figure.
For May, the current average is 13.235 million b/d with effective crude oil production around ~12.95 million b/d. Last week's implied data showed a dip back to ~12.8 million b/d, and I suspect the weakness is just getting started.
Over the coming months, we expect US crude oil production to move down closer to ~12.7 million b/d.
How will we know we are trending in the right direction?
Simple.
We will know based on the weekly US crude storage estimates. Because we are able to estimate the weekly US crude storage change, anytime EIA reports a figure more bullish than our estimate, that's when you know US crude oil production is disappointing to the downside. Similarly, if EIA reports a crude storage figure higher than our estimate, then US crude oil production is surprising to the upside.
Let's use May as an example:
For May, we had 12.85, 12.9, and 12.9 million b/d as our US crude oil production input.
In the last 3 EIA weekly crude storage reports, we had the following:
May 9 week: +3.05 million bbls vs +3.454 million bbls (EIA)
May 16 week: -3.32 million bbls vs +1.328 million bbls (EIA)
May 23 week: +0.33 million bbls vs -2.795 million bbls (EIA)
Net: +0.06 million bbls vs 1.987 million bbls
Delta - 1.927 million bbls
Over 3 weeks, we were off by 0.09 million b/d.
Using the average production of 12.88 million b/d, implied US crude oil production was 12.97 million b/d.
The same methodology will be applied in the future weeks/months to validate whether or not we are right about the trajectory of US crude oil production. Subscribers will be able to see in real-time (via the weekly US crude storage estimates) where US crude oil production is.
Just the Start
Logically and intuitively, it shouldn't be a surprise to see US crude oil production trending lower. US shale oil producers are already cutting rigs and frac spread counts in size.
But this is just the start. In time, we should see both production respond meaningfully to the downside, with US crude oil production hitting ~12.5 to ~12.6 million b/d by year-end. Relative to the consensus estimate, this will be -1 million b/d, which will eliminate a large part of the surplus everyone's expecting for 2026.
So don't be fooled by the March headline figures, the weakness is just getting started.
Analyst's Disclosure: I/we have no stock, option or similar derivative position in any of the companies mentioned, and no plans to initiate any such positions within the next 72 hours.


