

It’s been a while since I’ve covered US crude oil production, but rest assured, I’ve been watching the data closely. With the Iran war backdrop, minimal changes (100k b/d here and there) in US crude oil production have very little importance to the global oil market. Unlike pre-war conditions when non-OPEC supply growth mattered, sadly, US crude oil doesn’t get the same love as it did before.
However, something alarming showed up in both the May and June EIA petroleum supply monthly data.
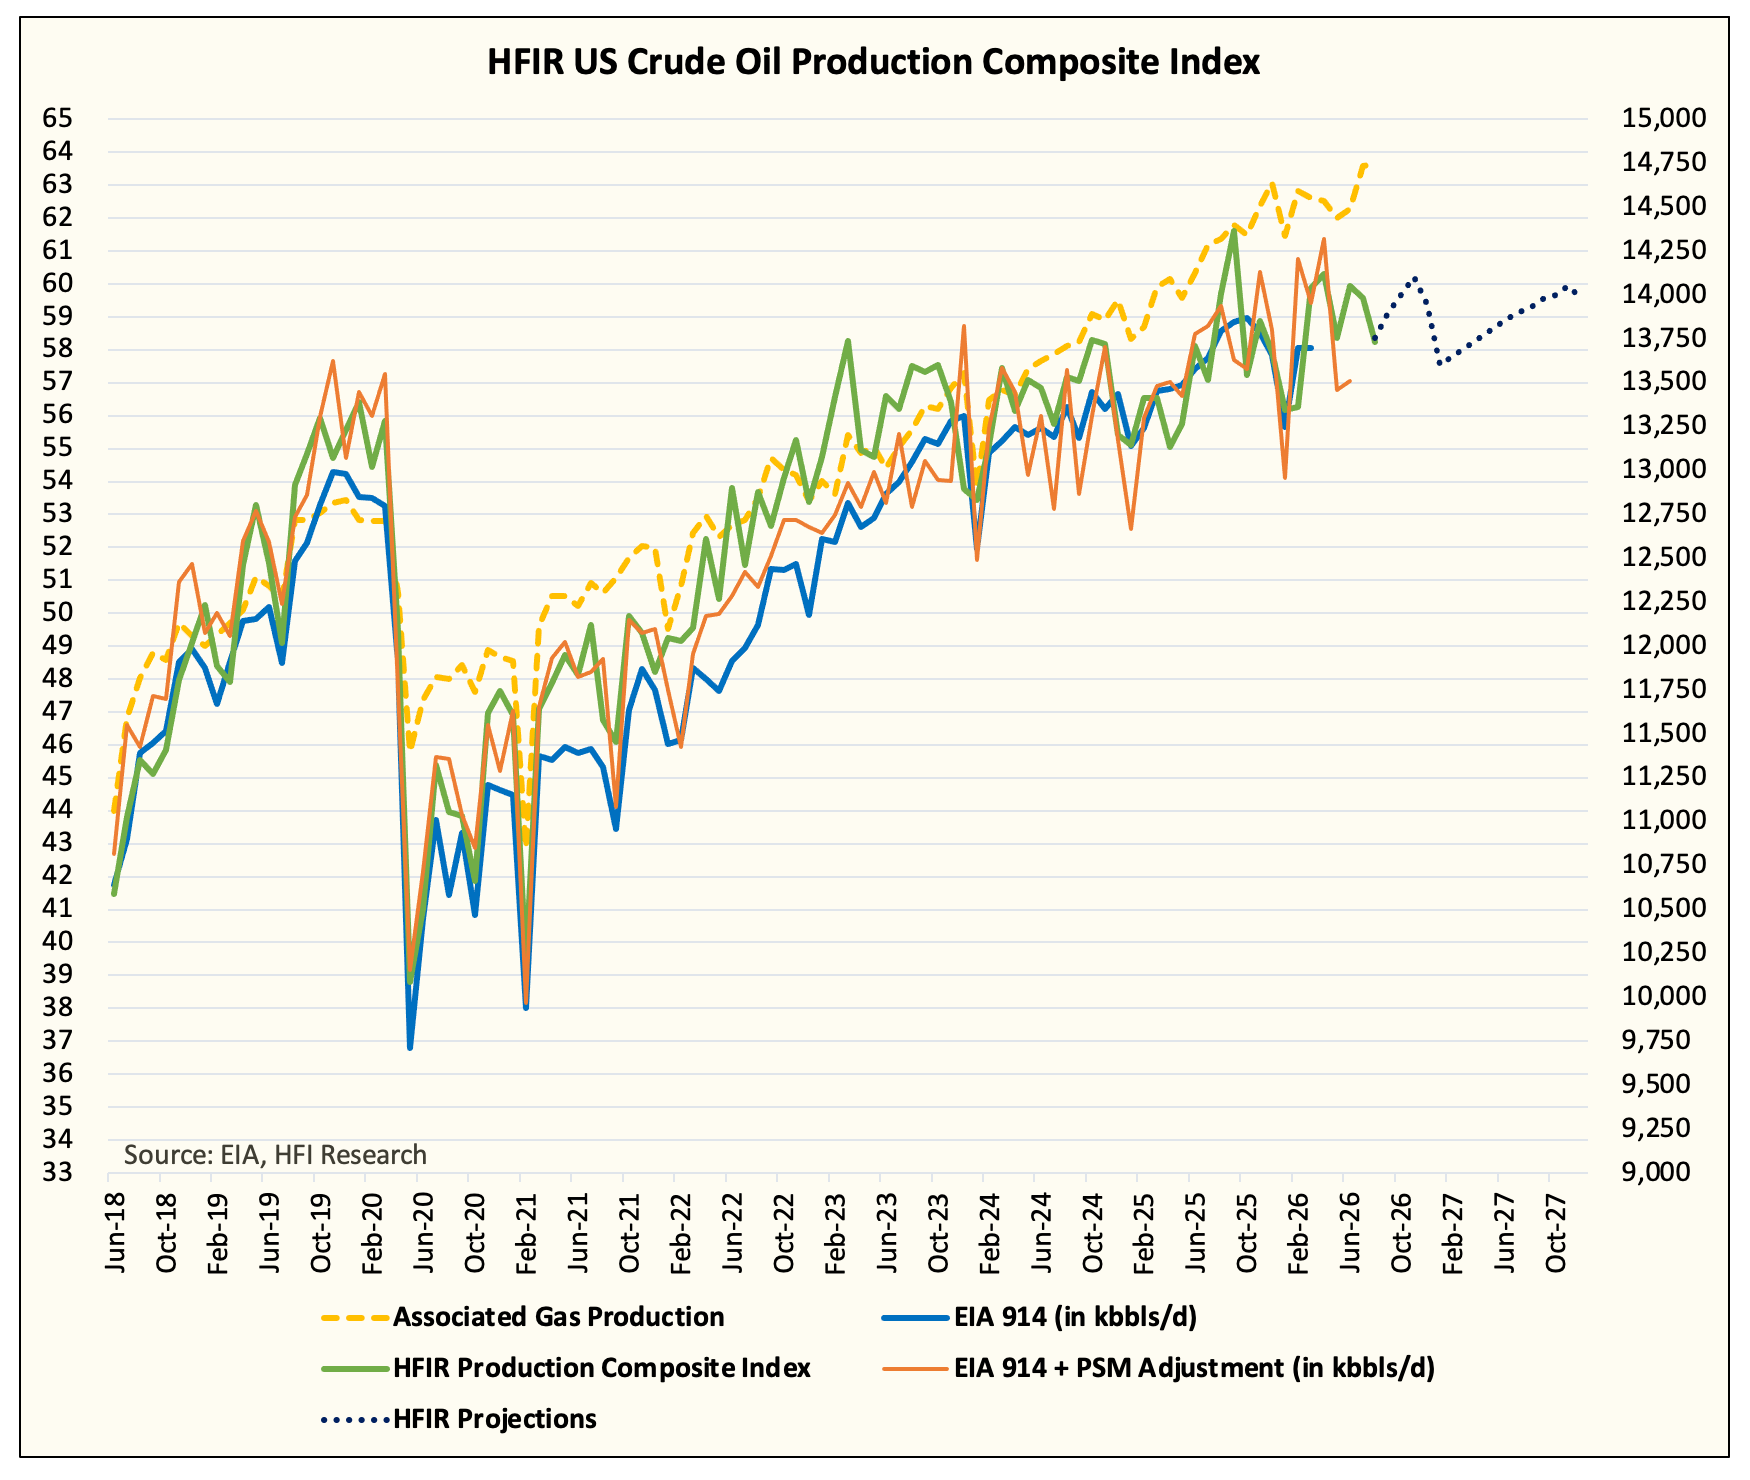
In April’s PSM data, US crude oil production registered a staggering 13.967 million b/d with a positive adjustment of 0.35 million b/d. This put the “real” US crude oil production figure at 14.317 million b/d.
But immediately in May and June, the “real” US crude oil production figure fell to 13.456 and 13.512 million b/d, respectively.
This puts the rolling 3-month US crude oil production figure at 13.76 million b/d.
Here’s where things get interesting...
The 3 months leading up to the end of 2025 averaged 13.836 million b/d.
We are currently down versus the end of 2025. This is with crude oil prices doing materially better than everyone’s expectations at the start of the year!
Wow, what’s going on?
Gas-to-Oil Ratio
We know from individual producer data that Exxon was a key driver of US crude oil production growth in 2025. In particular, the Delaware Basin was the No. 1 reason it showed meaningful growth in the Permian.
But that growth story may be behind us.
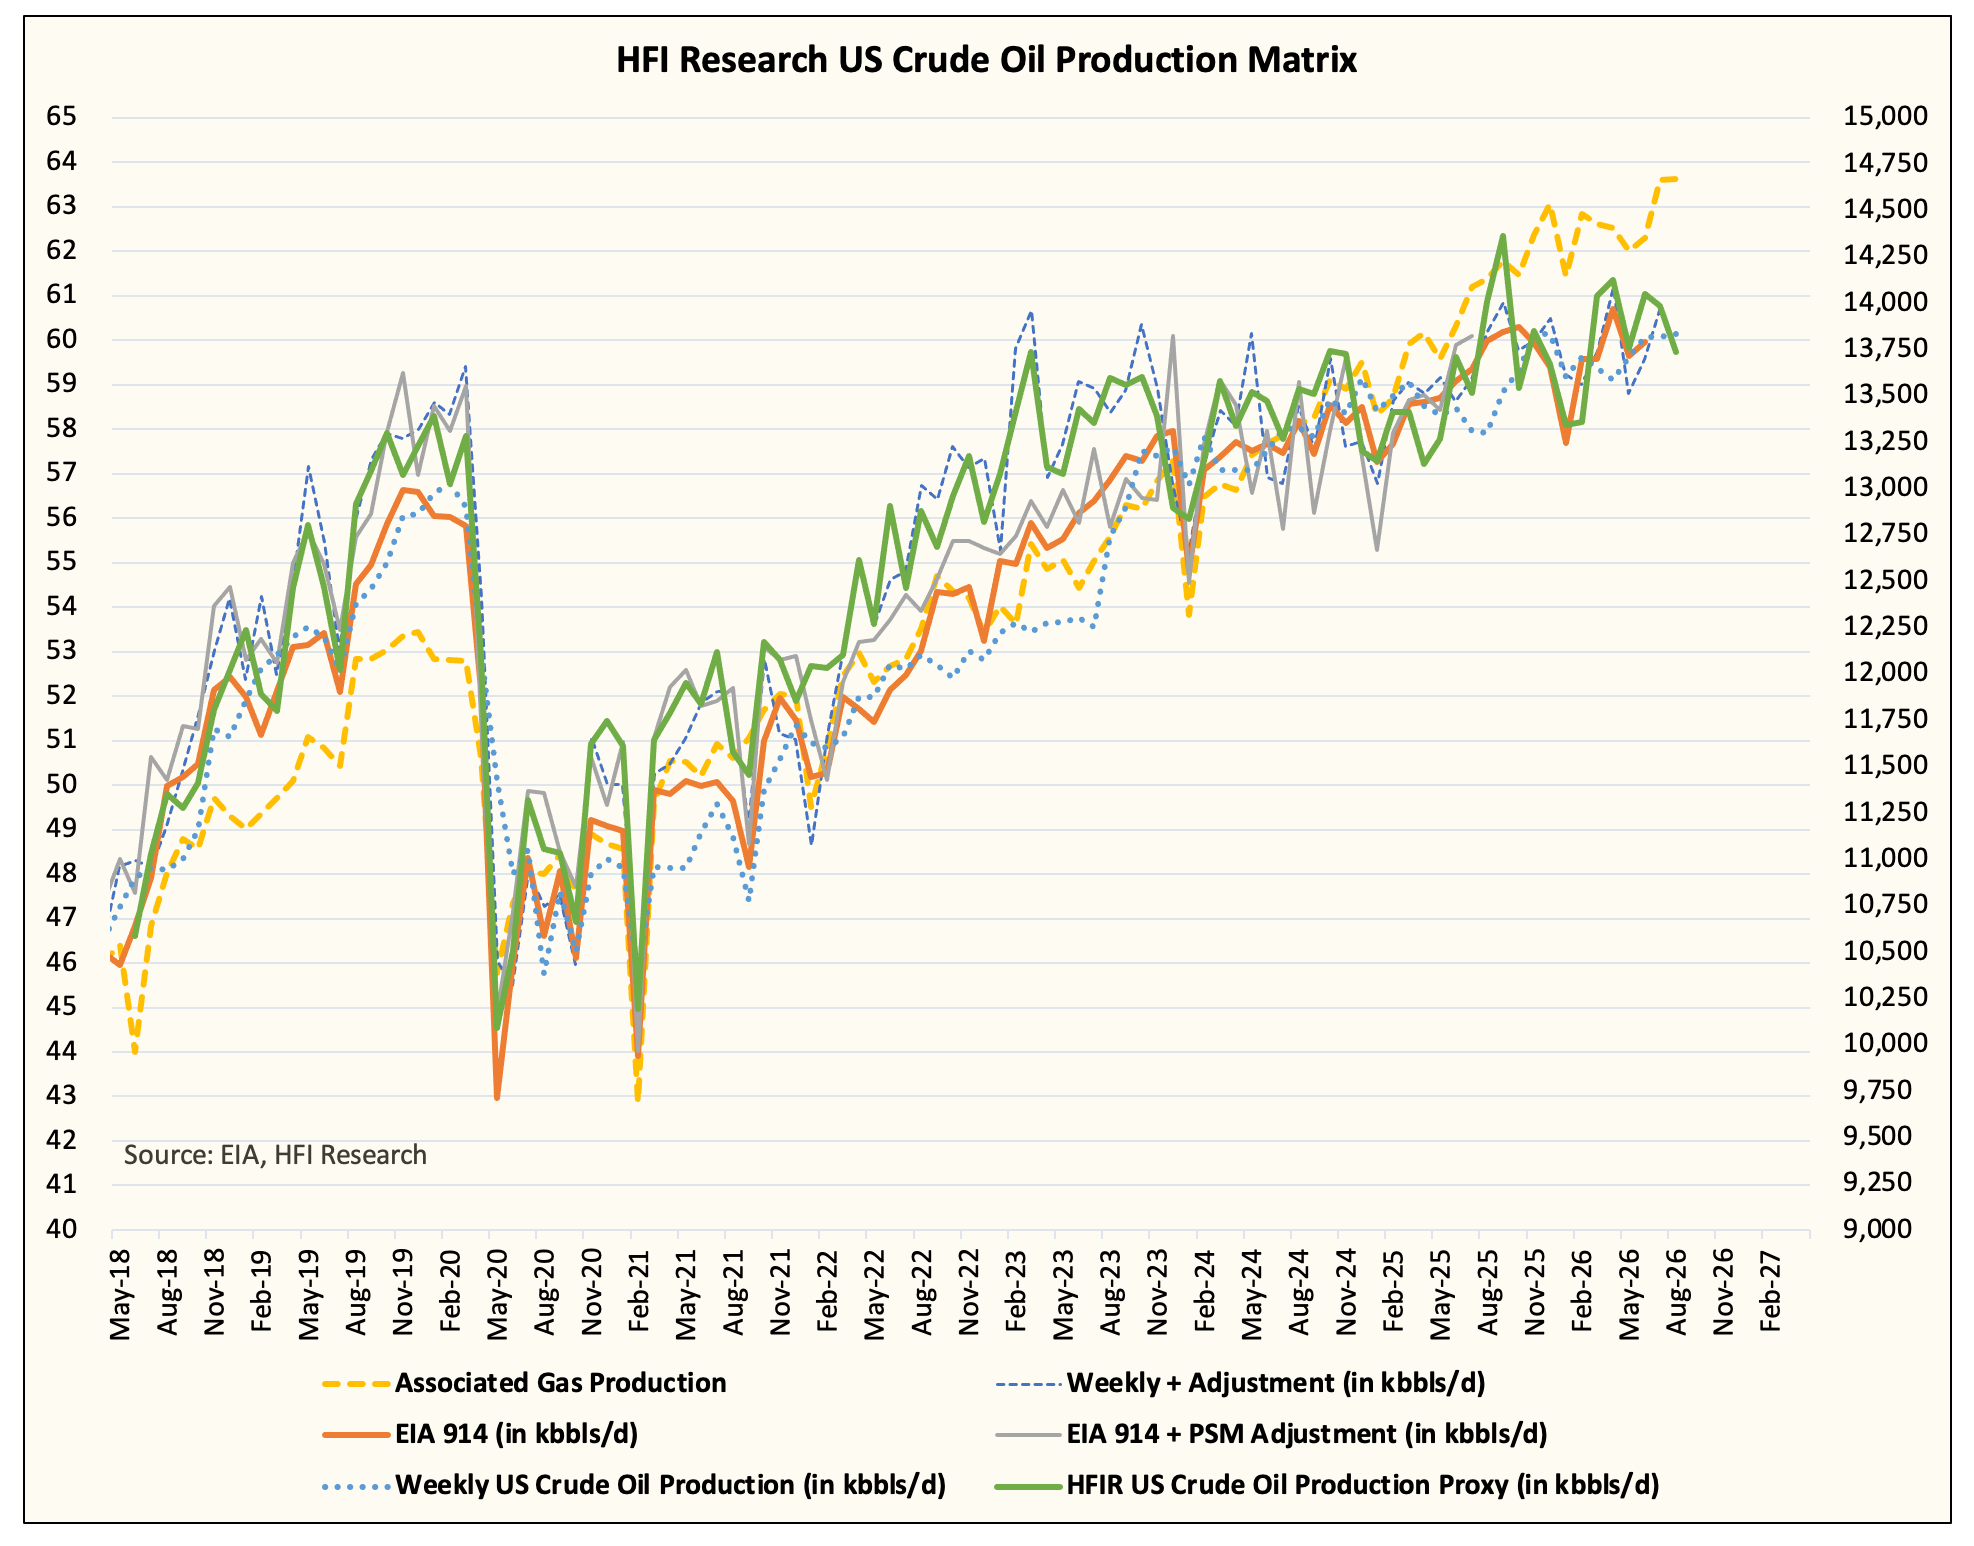
Looking at our more granular model, associated gas production growth is clearly outpacing crude oil production growth. EIA reported that June Lower 48 gas production averaged over ~112 Bcf/d, which is ~2 Bcf/d higher than our expectations for June.
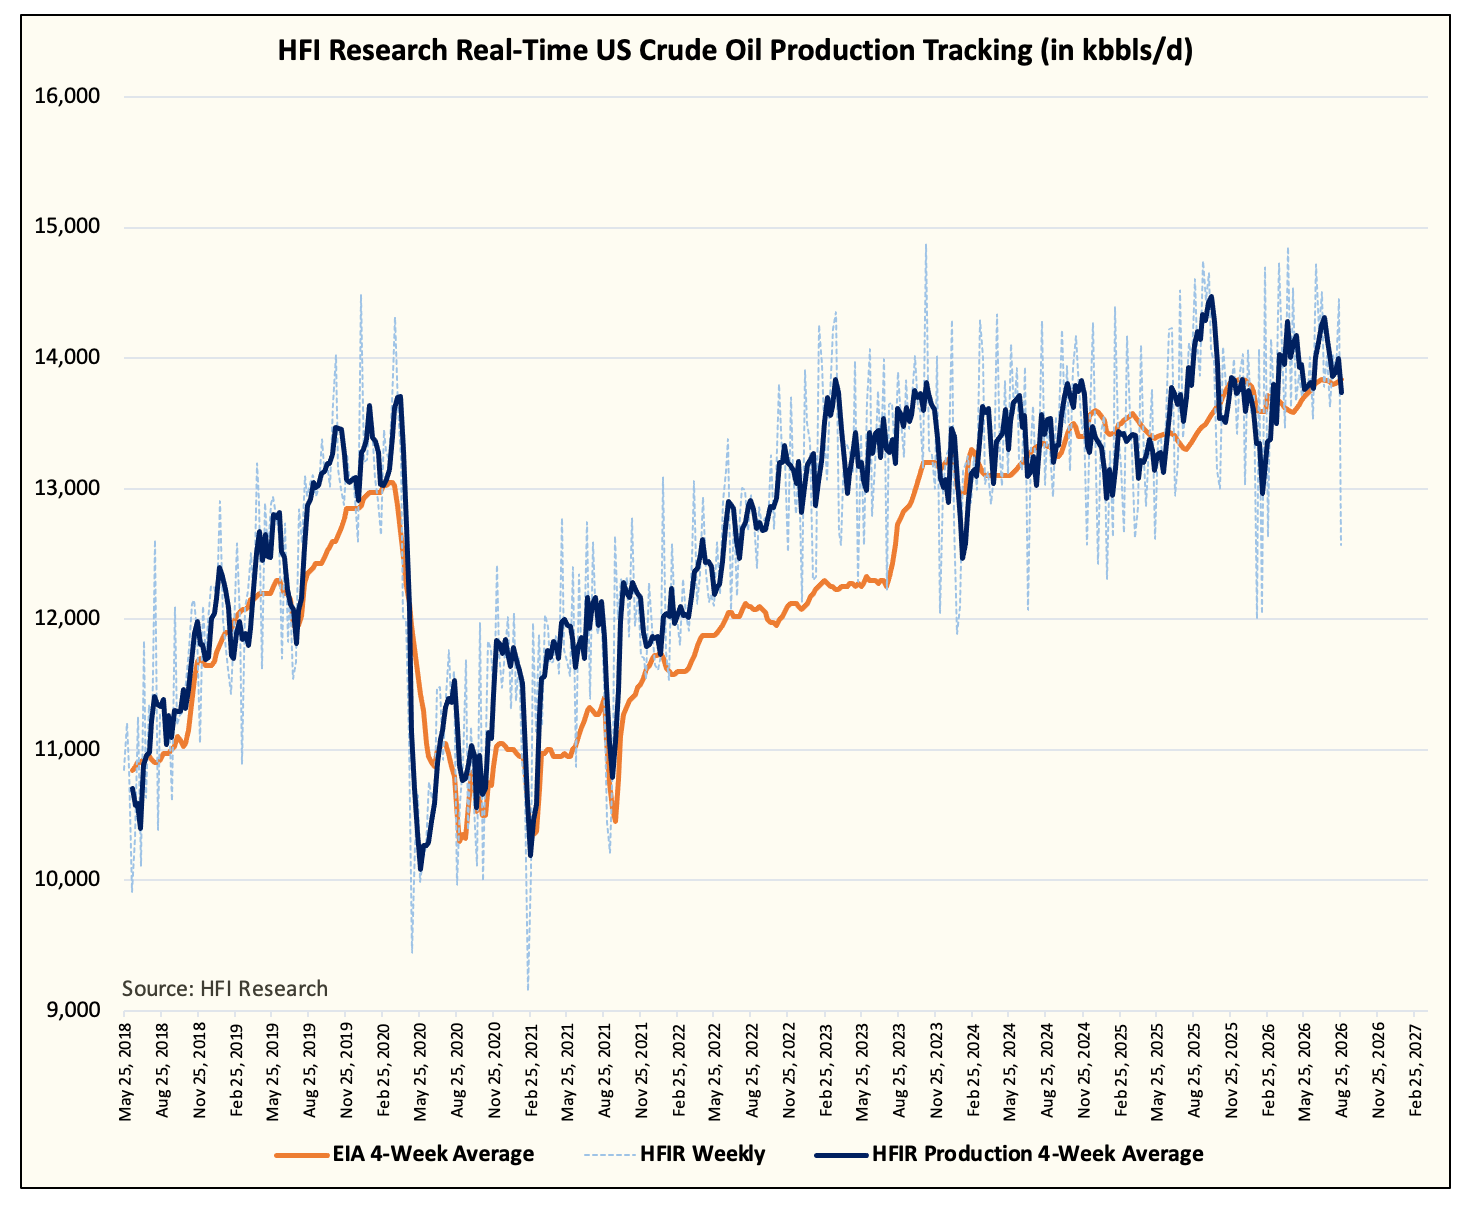
And using our real-time US crude oil production chart, it is evident that we have not seen any material growth since H2 2025. In fact, I would argue that we are actually rolling over despite my disbelief.
Now, could this be bad data?
Yes and no.
Yes in the sense that we should wait for more data to confirm the disappointing US crude oil production trajectory.
No in the sense that we’ve already had 8 months of data that’s showing a material slowdown in US shale.
I think with more Permian gas takeaway capacity coming online by the end of the year, I would want to see what happens to crude production. If we still see an overall flattish picture by year-end despite the oil macro backdrop, then we can be much more certain that the end of US shale is here.
But one conclusion we can already draw from the data we are seeing is that there’s not much growth left for the US.
In my forecast, I have ~14.1 million b/d for year-end, +350k b/d vs today.
Either way, this is a rounding error in the grand scheme of things compared with the supply disruption we are seeing in the Middle East. But the end of US shale production growth has an important ramification for the non-OPEC supply growth story.
We are near the end of it, not the beginning.
Analyst’s Disclosure: I/we have a beneficial long position in the shares of USO, UCO, BNO either through stock ownership, options, or other derivatives.
Predictions are hard to make, especially about the future. We may be nearing the post Hubble peak, but. Even if output plateaus it’s still a significant amount of world production. Besides, when will US automakers wake up and retool to Natty? Not paid for by Boone Pickens.
How does Natural gas increase when crude is falling? I thought that natural gas production was a by product of crude production form shale?