
(Public) US Crude Storage Outlook - Big Draw


For the week ending March 15, we have a crude draw of 6.07 million bbls. This week's report should report the highest crude export on record with tanker activities showing 5.3+ million b/d.
Relatively speaking, a crude draw of this size would be perceived bullishly as the 5-year average draw is around ~1.6 million bbls.
For this estimate, we have cautioned on the side of conservatism. Our preliminary figure on Friday was much larger showing a crude draw closer to ~9 million bbls. EIA may have miscounted some barrels from the previous week (~2.5 million bbls), so we think they may adjust it back in this week's report. As a result, if you see EIA reporting a larger draw than our figure, please do not be surprised.
Looking at our US crude storage projection going forward, we are trending in the right direction:

For the next few weeks, we are seeing lumpy crude exports/imports. Brent-WTI spread remains wide so we should expect US crude exports to remain strong. With refinery throughput now surprising to the upside last week, we have revised higher our draw estimates. Once US refineries exit maintenance by the end of April, crude draws should accelerate this summer and fall well below 2022.
More importantly for us, we continue to be fixated by the product storage chart.
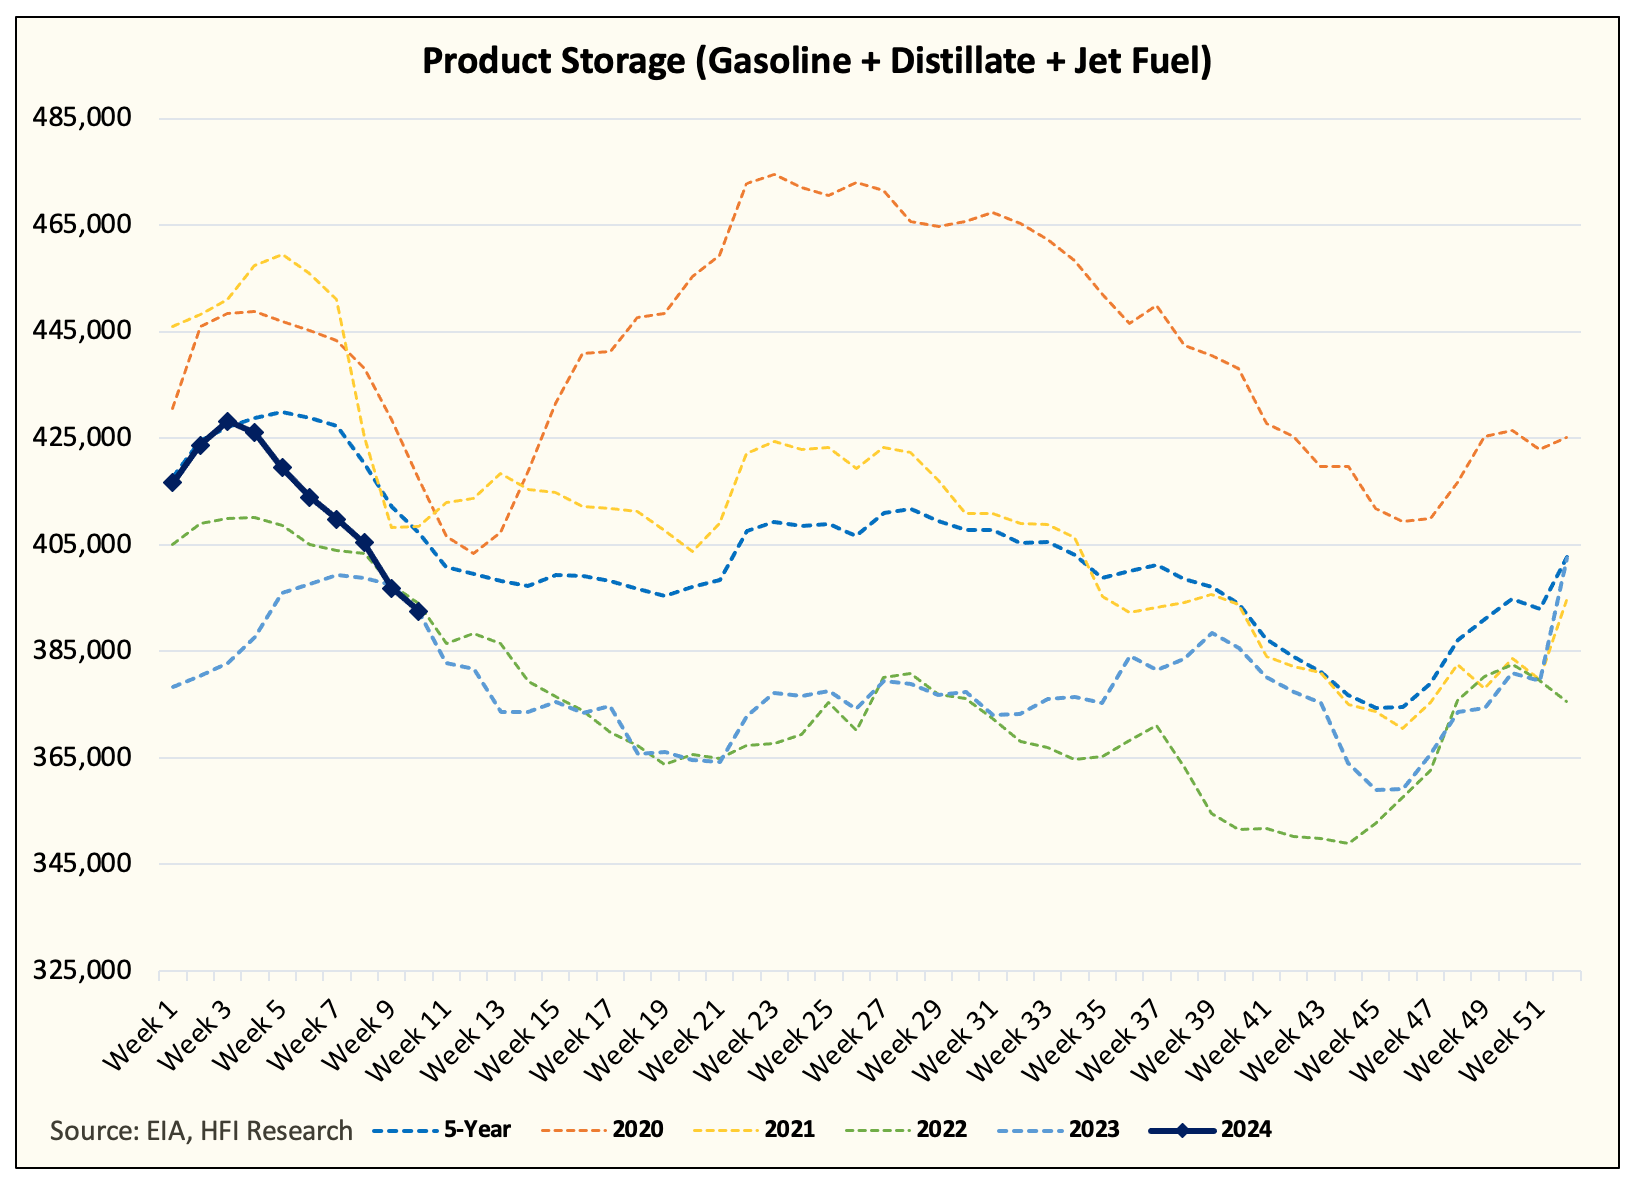
In our view, this is a far more important chart than crude. Any trader with access to tanker tracking activities can see that US commercial crude storage will fall, but with product storage now matching that of 2022/2023, it will be important for the bullish trend to continue.
If product storage falls in line with the last 2-years and crude storage draws accelerate, then we could easily argue a pricing environment closer to $85 to $90/bbl WTI.
By June, if the Saudis choose not to unwind the voluntary cuts, then it will open the possibility of a price spike. Our base case view is that it will unwind the production cuts as to prevent 1) political backlash and 2) slowing oil demand growth.
Let's see what EIA has to say, but directionally, I think it should be a positive report.
API vs EIA

API vs EIA running error is now ~2 million bbls above zero. We expect API to be more bearish than EIA.
For our estimate to be correct, API would report -3 to -4 million bbls. Any draw estimate higher than this implies EIA will report a larger than expected crude draw.