(Public) US Oil Production And There Are Far More Questions Than Answers
EIA PSM came out today for December and there are far more questions than answers. For starters, the EIA reported the highest ever "crude oil supply" figure in history. This is calculated by taking reported US oil production and adding both transfers to crude oil supply and adjustment.
13.315 million b/d (production) + 0.474 million b/d (transfers to crude oil supply) + 0.404 million b/d (adjustment) = 14.193 million b/d
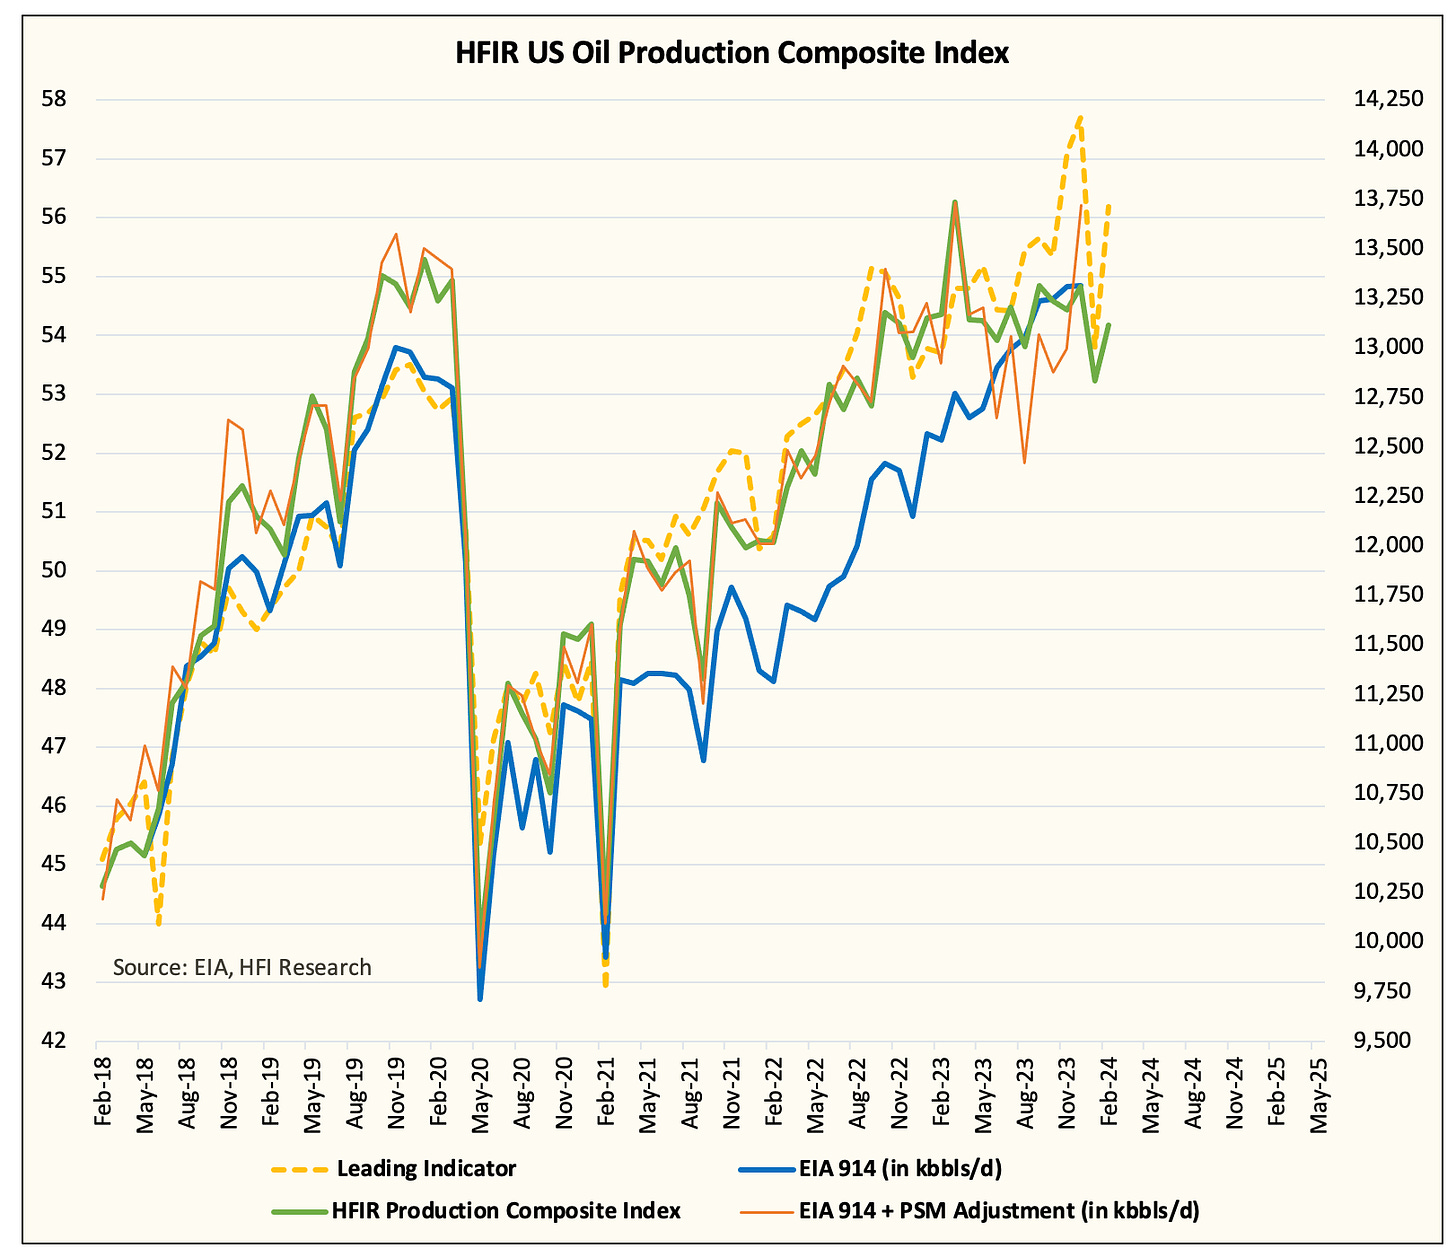
Comparatively speaking, this is so far off our estimate, that it's not even funny. You can see the large disparity this figure has created in our chart. (Note: We use production + adjustment.)
Now it's important to remind readers that EIA made a significant change in June 2023. It introduced transfers to crude oil supply to fight the persistently high adjustment figure. Following its lengthy study, it concluded that "blending" or transfers to crude oil supply was a key factor explaining why that is the case.
Since June, these are the following "adjustment" figures EIA reported in the monthly:
June: -200k b/d
July: +65k b/d
August: -632k b/d
September: -168k b/d
October: -373k b/d
November: -315k b/d
December: +404k b/d
The average from June to December is -203k b/d. In that same period, US oil production averaged 13.15 million b/d. The conclusion we've reached and published in last month's report was that EIA has been overstating US oil production.
But following this December PSM, there are more questions than answers. Why? Because if you take December's data on a standalone basis, you will arrive at 13.719 million b/d for US oil production!
Looking at various proxies and our real-time US oil production figure, this figure is not real. Similar to the frequent weekly spikes in our modified adjustment figures, this excess +404k b/d adjustment appears to be an anomaly.
In addition, what makes the December PSM more confusing is the following math. In the weekly EIA oil storage reports and compared to our weekly EIA crude storage estimates, this is what we have:
Our weekly estimates showed a total of ~8 million bbl draw in crude storage, while EIA weekly reported ~13.966 million bbls, and the monthly reported 12.989 million bbls.
If it was indeed true that US oil production was vastly higher than ~13.2 (the average we used), then the crude draw should have been significantly less. This was not the case.
Looking through the variables in the PSM in comparison to the weekly, imports were overstated (in the weekly), exports were understated (in the weekly), refinery throughput was understated (in the weekly), and transfers to crude oil supply was overstated by ~220k b/d (in the weekly).
All of these elements likely contributed to why the adjustment was positive in the monthly versus the weekly's negative adjustment.
This may all seem confusing, so here's the punchline...
Two key variables likely contributed to the positive adjustment in the monthly report: crude exports and transfers to crude oil supply. Because of the ever-increasing US crude export mix, blending tends to be a bigger factor as crude exports rise. However, in the December PSM, EIA showed an average of 474k b/d versus the weekly's 694k b/d. This difference coupled with the understated crude export in the weekly likely contributed to the material disconnect.
On the surface, it would appear that implied US oil production is far higher than reported, but we think this timing difference/blending element is the root cause. EIA's phase 3 is supposed to address this issue and next month's report will be when the new phase 3 kicks in. There will be more clarity as to how much is plant condensate and how much US oil production is actually crude.
Our analysis shows that implied US oil production is far lower than what the headline is reporting.
Looking at our production matrix, the spike looks to be an anomaly, and January PSM should correct this by showing a large negative adjustment.
As a result, we will need to take the average between December and January to figure out what "real" US oil production was.
Don't fret, the answer is in the data...
While this may all seem very confusing, it's actually far easier than you think. We publish our weekly crude storage estimates and you can easily benchmark our estimate to what EIA reports. Right now, we are using ~13 million b/d with ~710k b/d of "transfers to crude oil supply".
After adjusting for refinery throughput, if EIA's reported crude storage figure is more bearish than our estimate, then you know the "implied" US oil production figure is vastly higher. In contrast, if EIA's reported figures are lower than ours, then you know "implied" US oil production is lower.
This is why we are confident of our analysis here because the answer is in the data, and in this case, it's just the storage figure. So if the storage figures are trending better than we expect, then we know we are on the right track.
Conclusion
Record high "crude oil supply" in December is an anomaly, we expect January PSM to correct this with a large negative adjustment. US oil production is lower than what headline figures suggest, and our real-time US oil production figure pegs February around ~13.1 million b/d.
EIA's phase 3 data will start in February PSM, so there will be more clarity soon. Oil watchers won't have to wait long to see if our analysis is correct.
Analyst's Disclosure: I/we have no stock, option or similar derivative position in any of the companies mentioned, and no plans to initiate any such positions within the next 72 hours.


