

Oh, you know, it's just a casual 7% decline in natural gas prices.
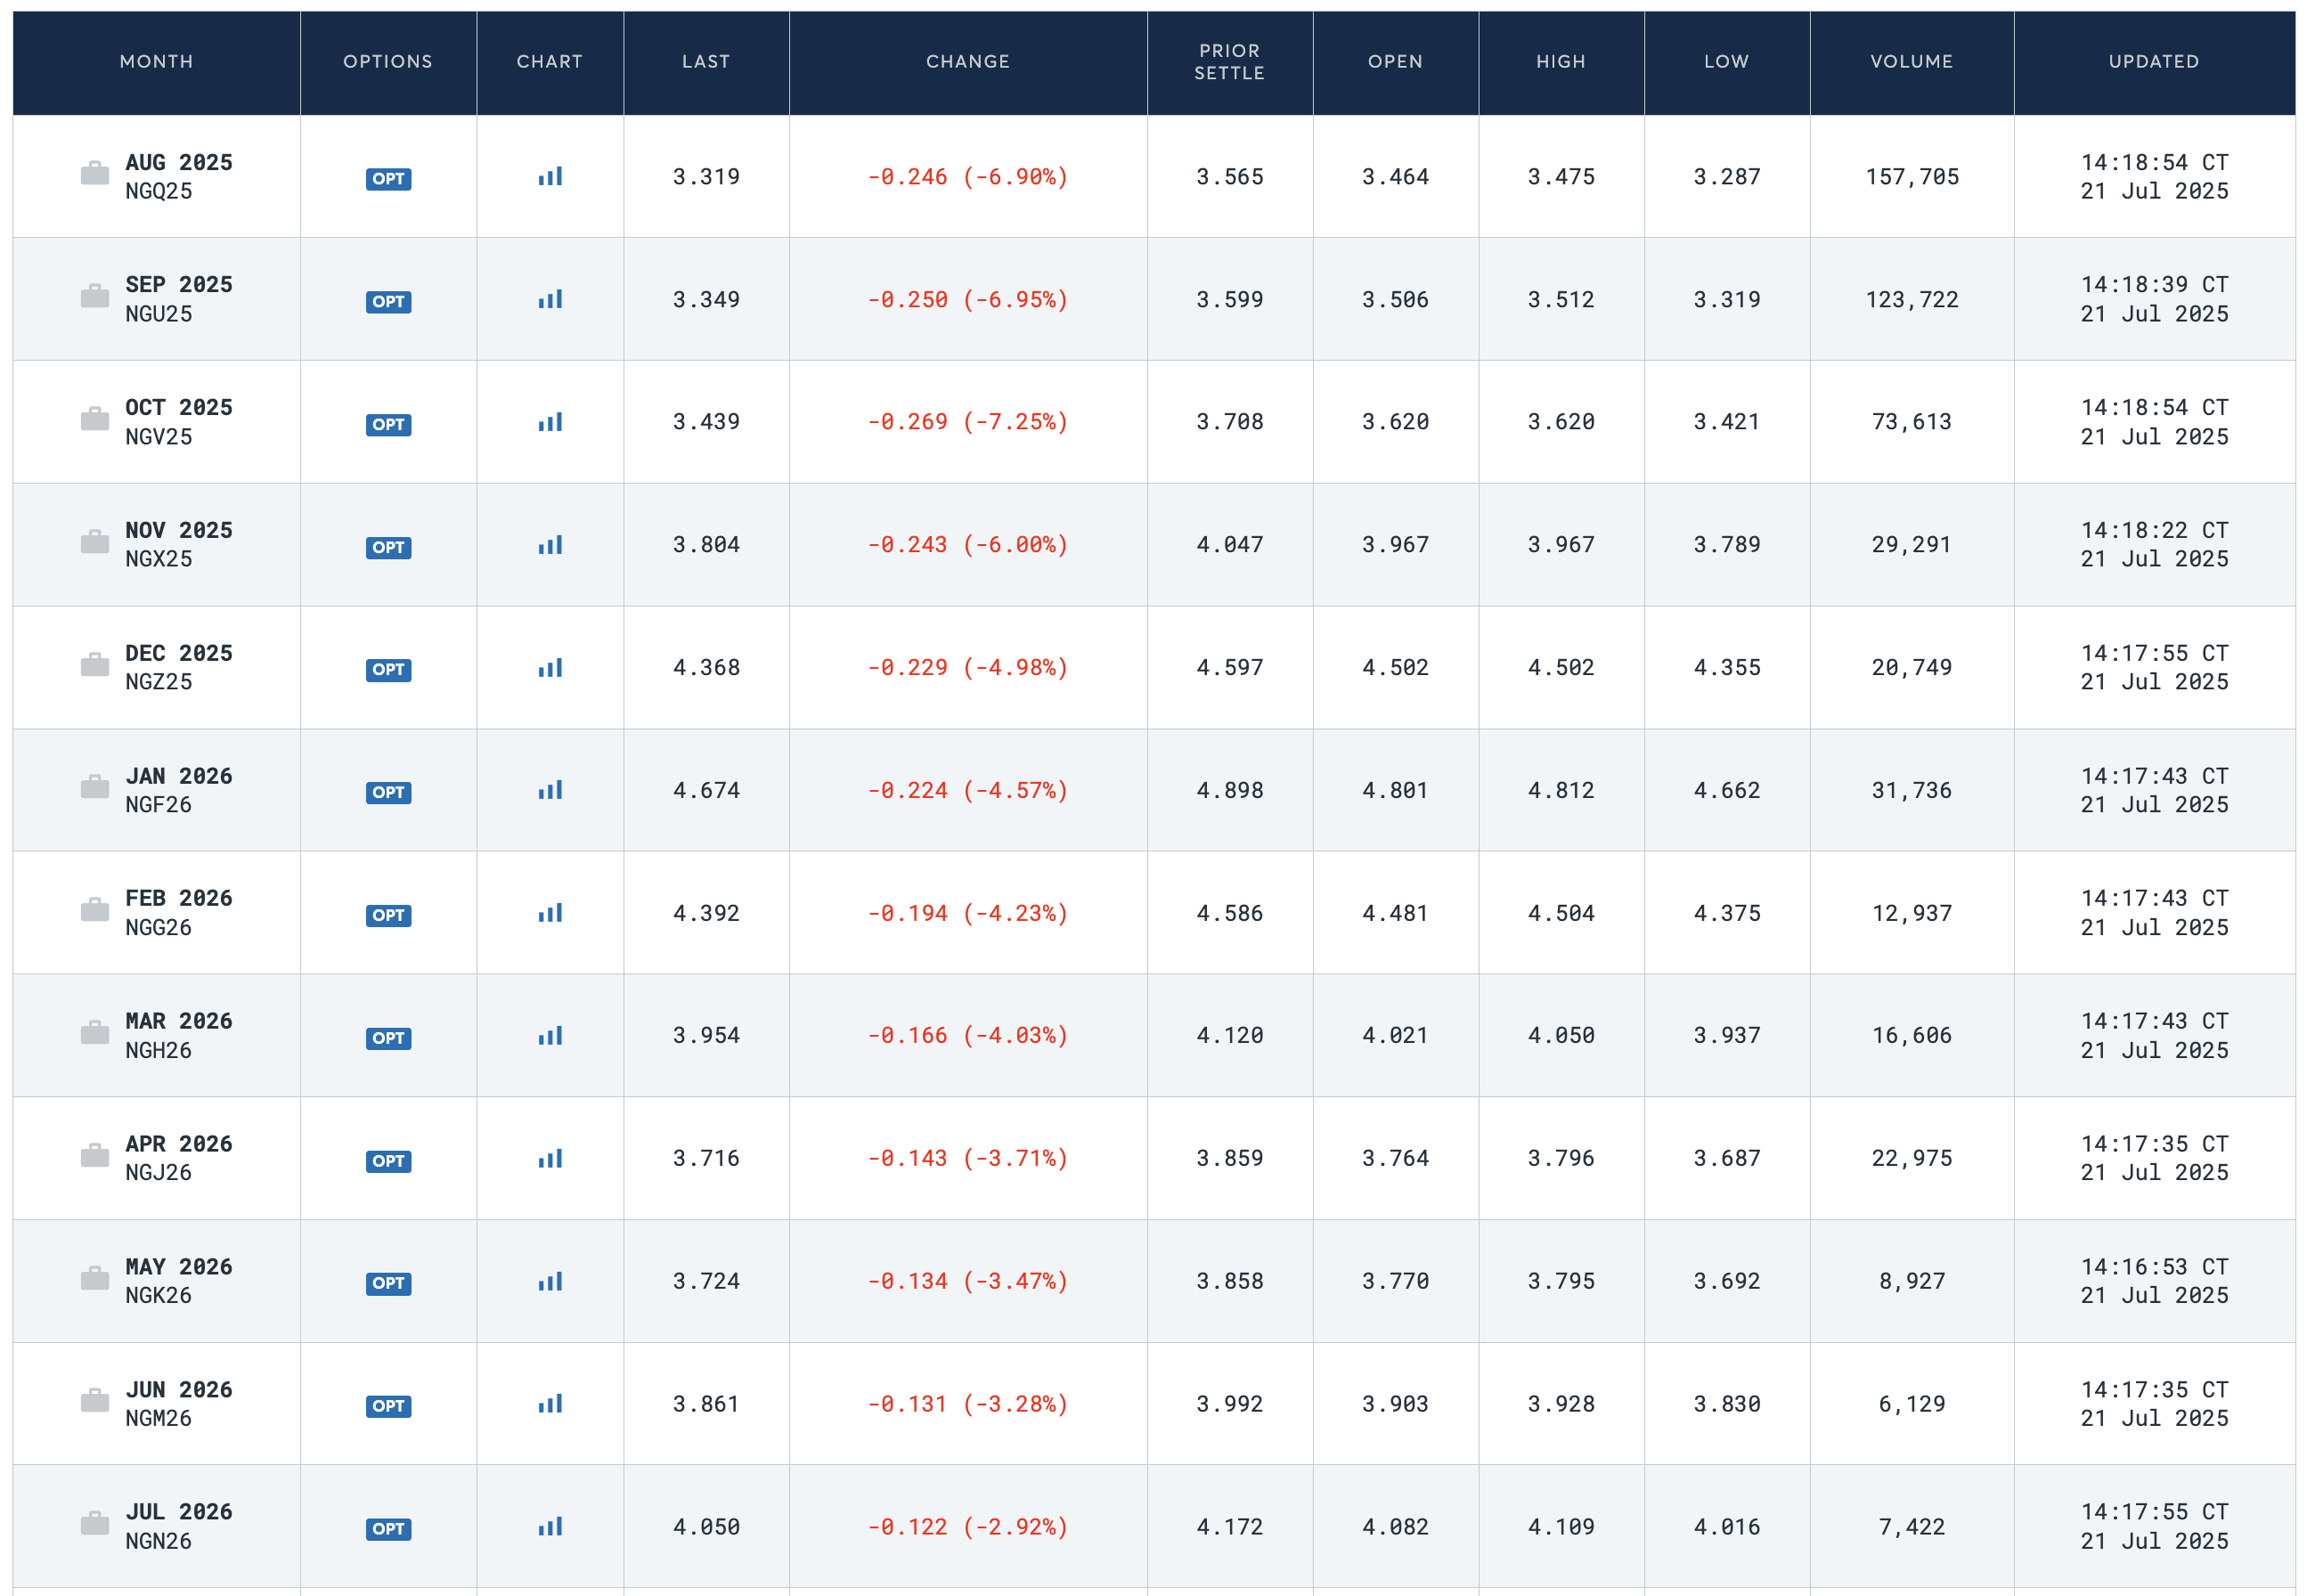
Source: CME
However, the selling today isn't just isolated to the prompt month; the entire curve is being pushed lower, as if natural gas prices are going to be permanently impaired.
What changed?
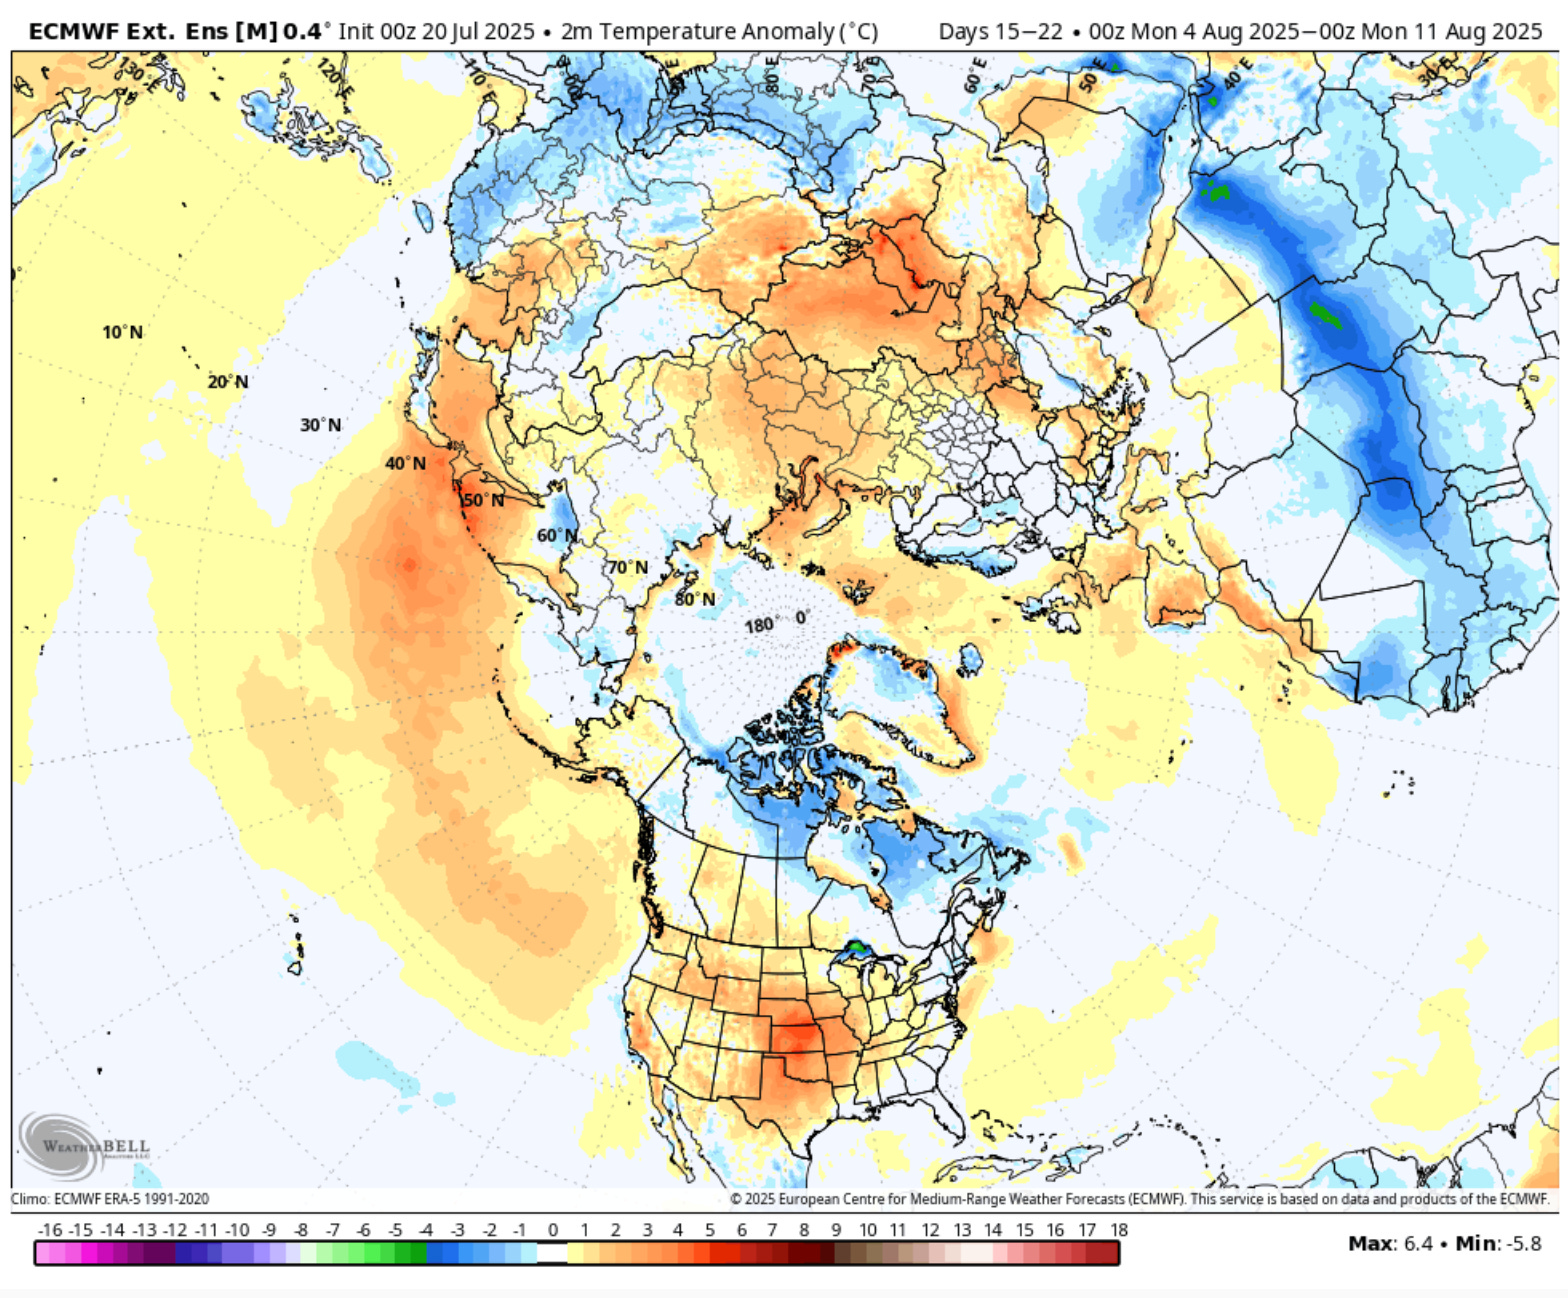
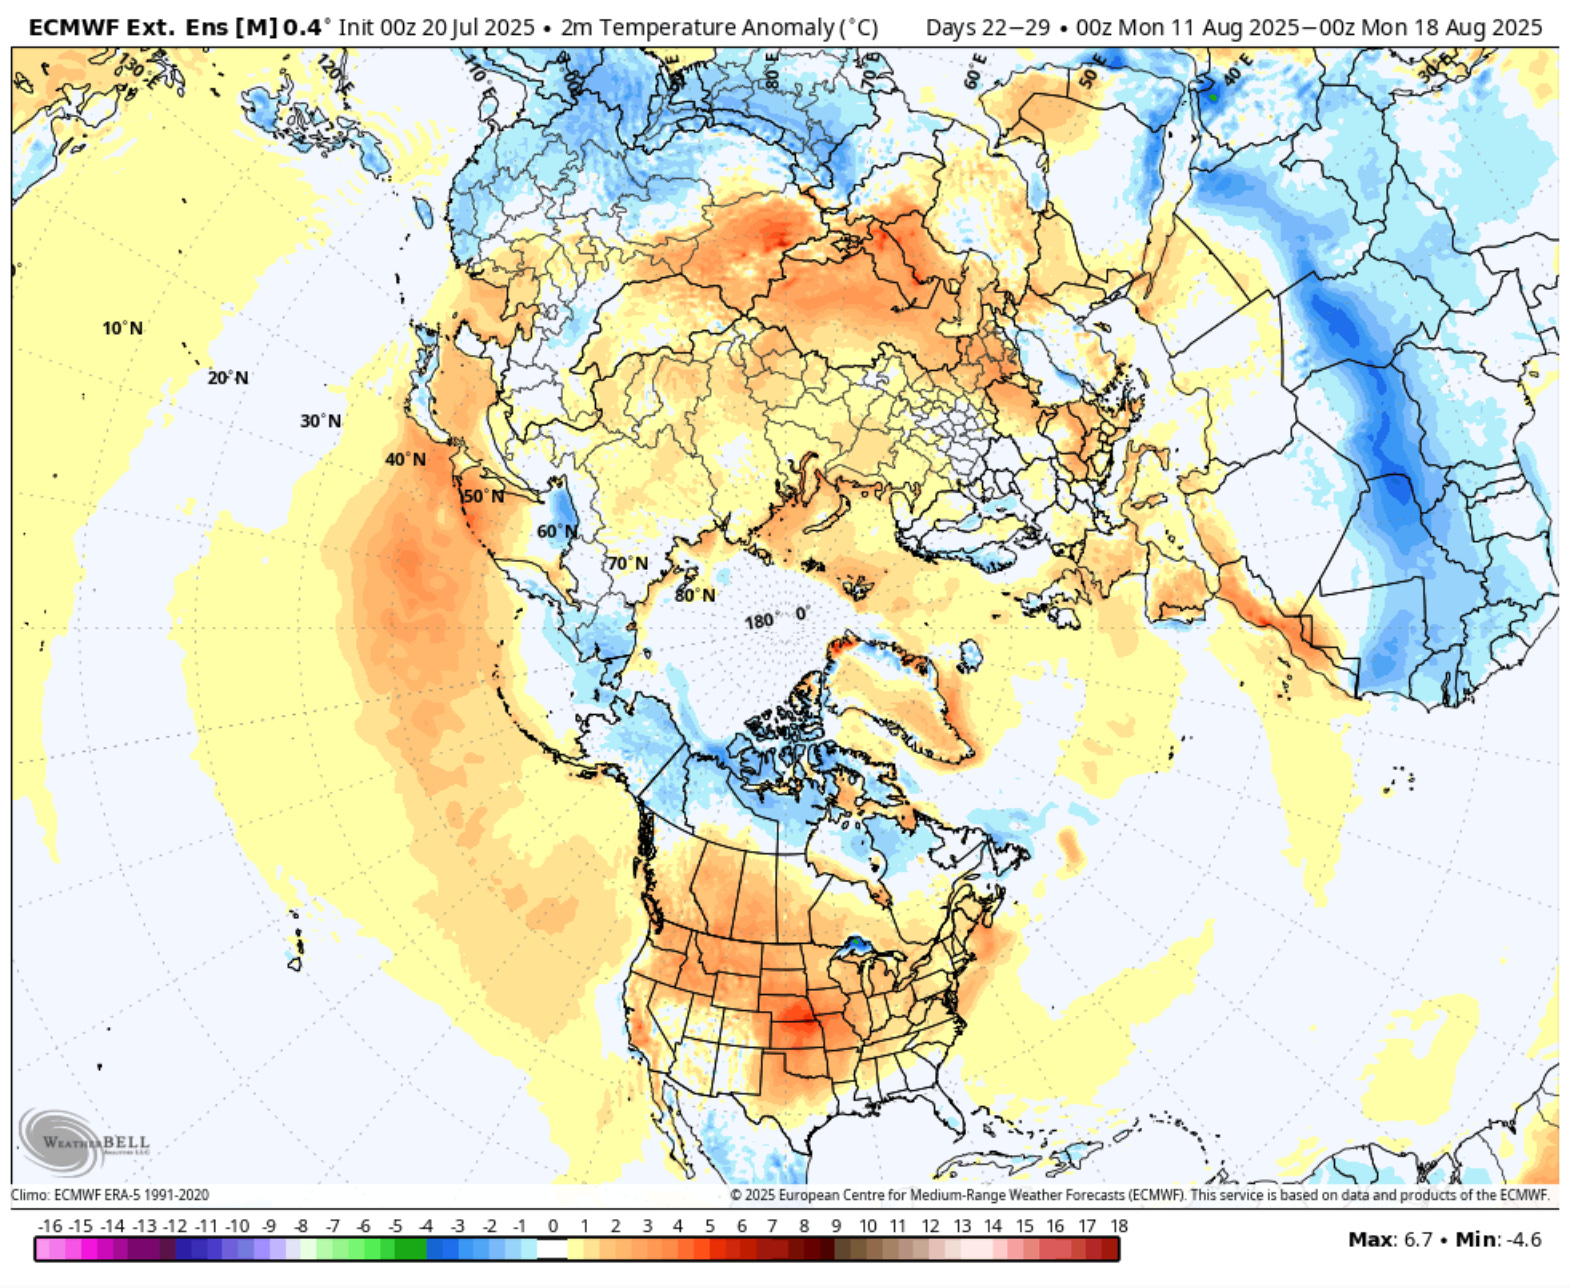
Weather models over the weekend trended cooler with the backend of the models losing cooling degree days. The warmth shifted from the South to the Northwest. In terms of the overall warmer-than-normal trend, that remains unchanged. The latest ECMWF-EPS weekly outlook still shows meaningfully warmer than normal weather in the South from the 15-29 day range.
15-22 Day
22-29 Day
But I suspect the sell-off today wasn't all weather-related. On Friday, Baker Hughes showed a sizable jump in natural gas rig counts. We are now starting to see rig counts increase in the Haynesville, which is a bearish signal for the bulls. As we noted in our last week's NGF, Haynesville is the swing producer region, so we will have to monitor activities there closely.
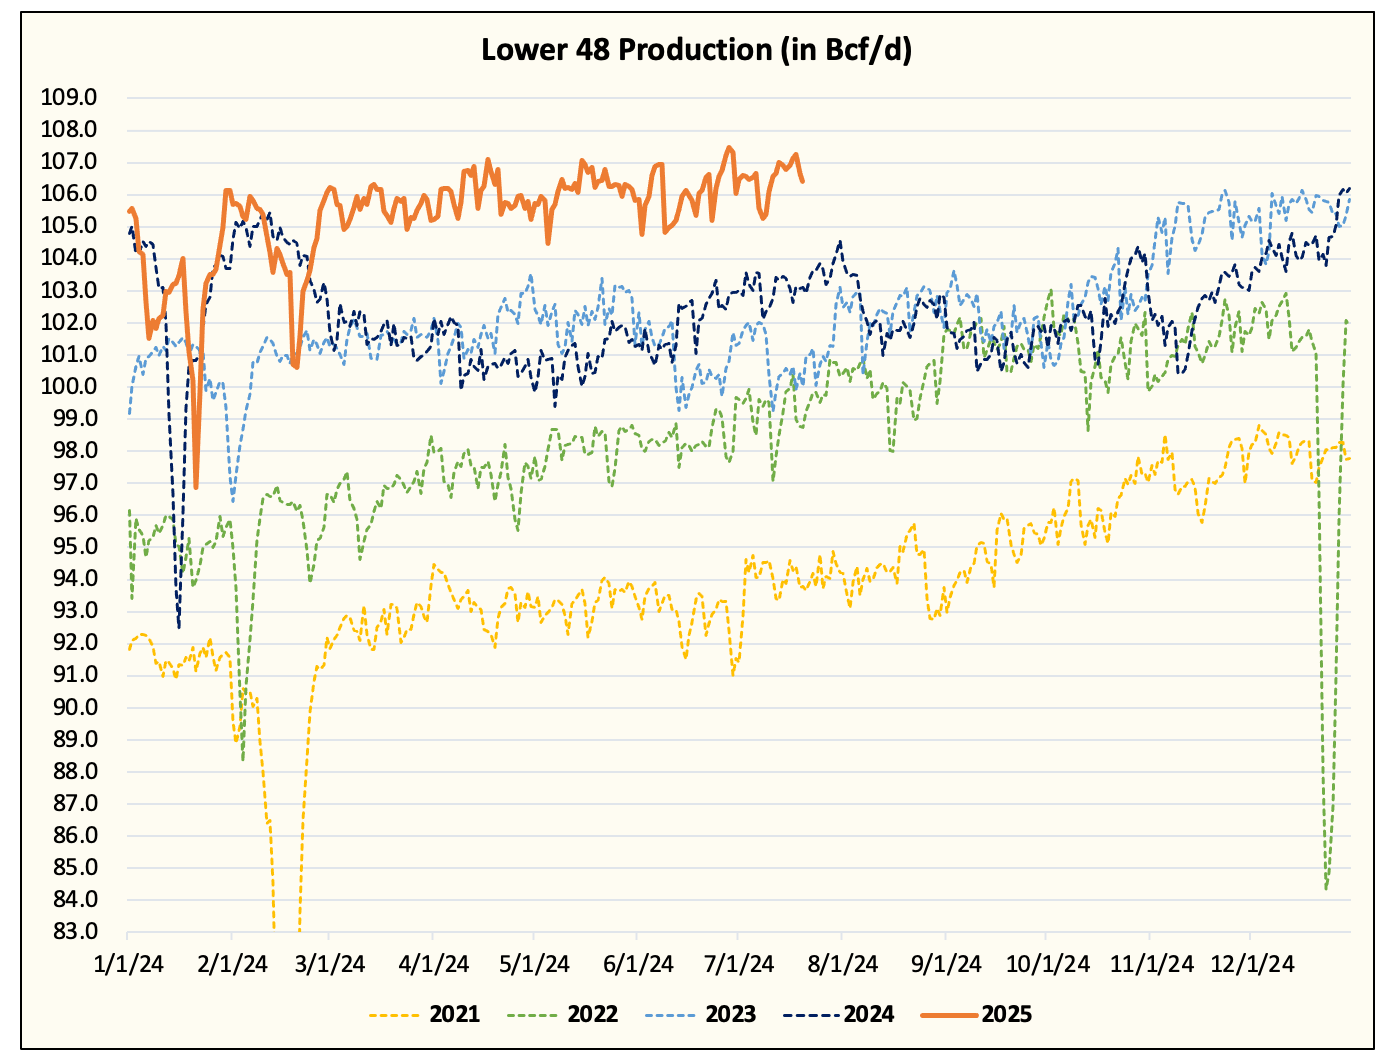
On the fundamental side, false reporting from Bloomberg's dataset on Lower 48 gas production also spooked some market participants. Bloomberg reported Lower 48 gas production at 109+ Bcf/d, while the data we are using from S&P (previously PointLogic) is showing an average of ~107 Bcf/d.
Lower 48 gas production did trend higher, but nowhere near 109 Bcf/d.
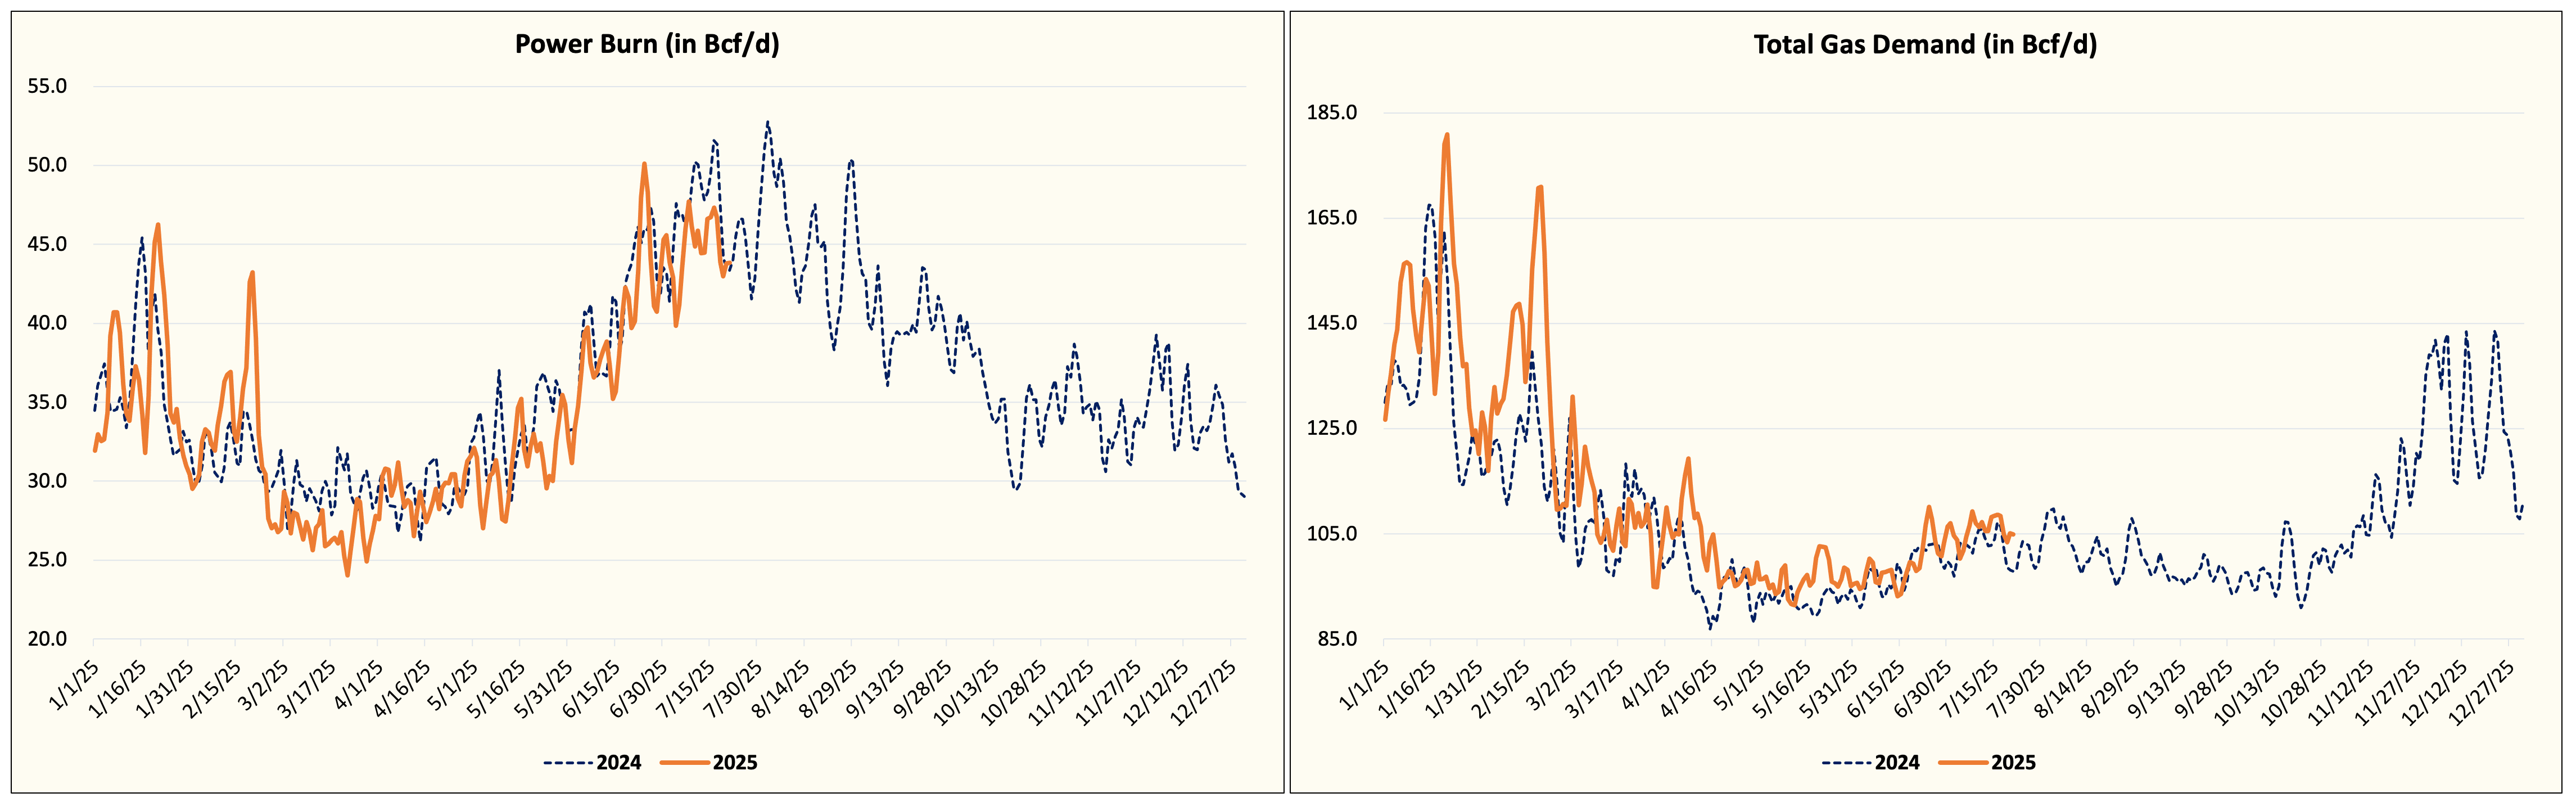
On the demand side, weak cooling demand continues to hammer power burn demand relative to last year. Elevated LNG feedgas continues to prop up total gas demand.
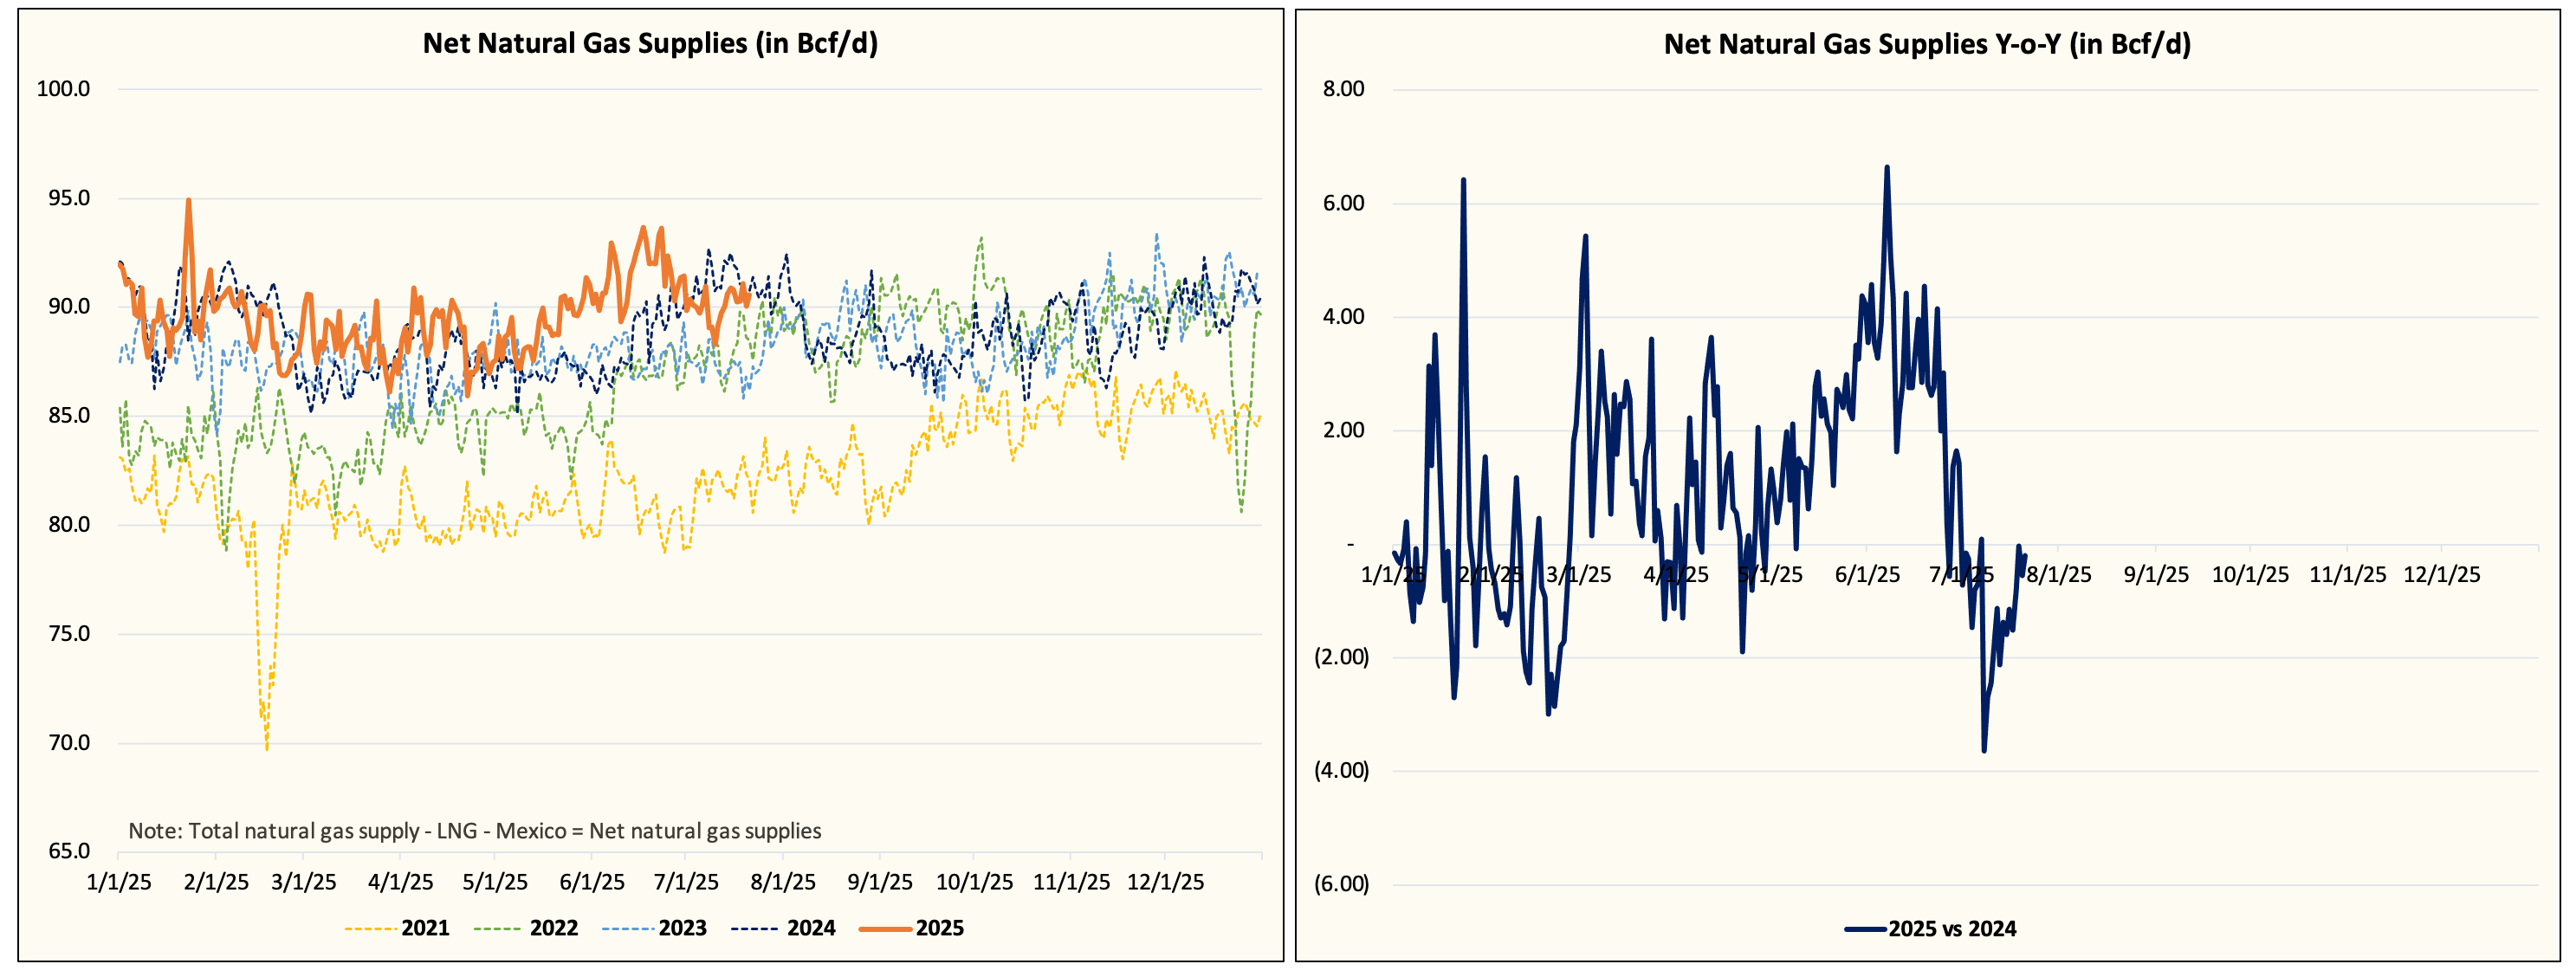
Net gas supplies remain lower y-o-y thanks to higher structural demand drivers, but that will start to wane as Lower 48 gas production started to meaningfully drop into September.
Looking at the projected natural gas storage injections, the implied balance we saw over the weekend was bearish.