
The Incoming Weather Setup And Why You Need To Pay Attention
For oil and natural gas.

This is an important update because the natural gas market is already starting to reflect the potentially bearish weather pattern that's coming on the horizon. But as I will explain below, there's a big caveat to what's ahead, so readers have to pay close attention to this to figure out where oil and natural gas are headed.

What happened so far?
For experienced energy traders, weather model roulette is real and judging by the price action in natural gas, new traders are also starting to learn just how real it is.
Last weekend, there was a lot of hype on X with people posting GFS operational models pointing to record cold. Veteran natural gas traders know better to follow GFS or GFS-ENS for that matter as both models have proven to be extremely unreliable over the years.
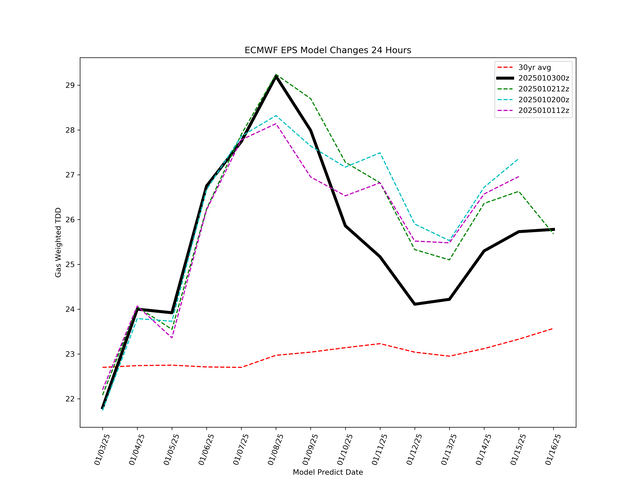
Looking at "King Euro" or ECMWF-EPS, the latest weather model update is far from "super" bullish.
ECMWF-EPS TDDs
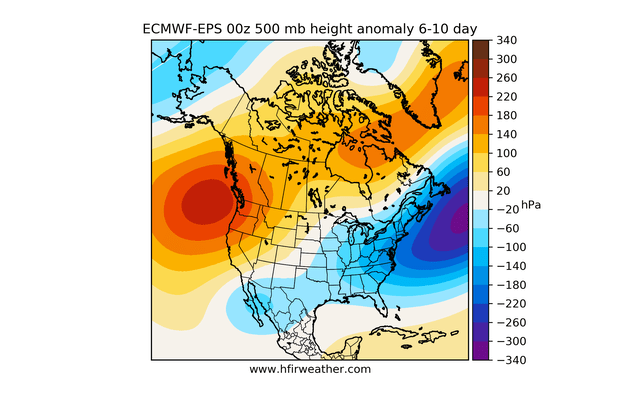
6-10 Day
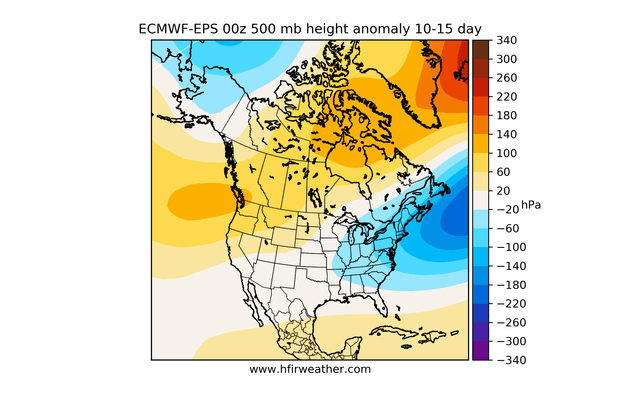
10-15 Day
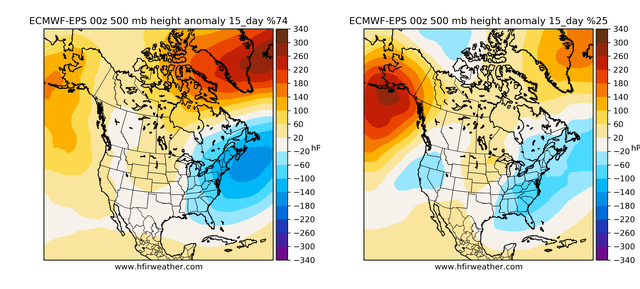
15-Day Cluster
What's happened is that if you pay close attention to the 6-15 day trend, the cold that we see in the Northeast doesn't get blocked out and turn into a polar vortex.
And in case you are wondering what it does look like, here's the 6-10 day outlook from last year's polar vortex event:
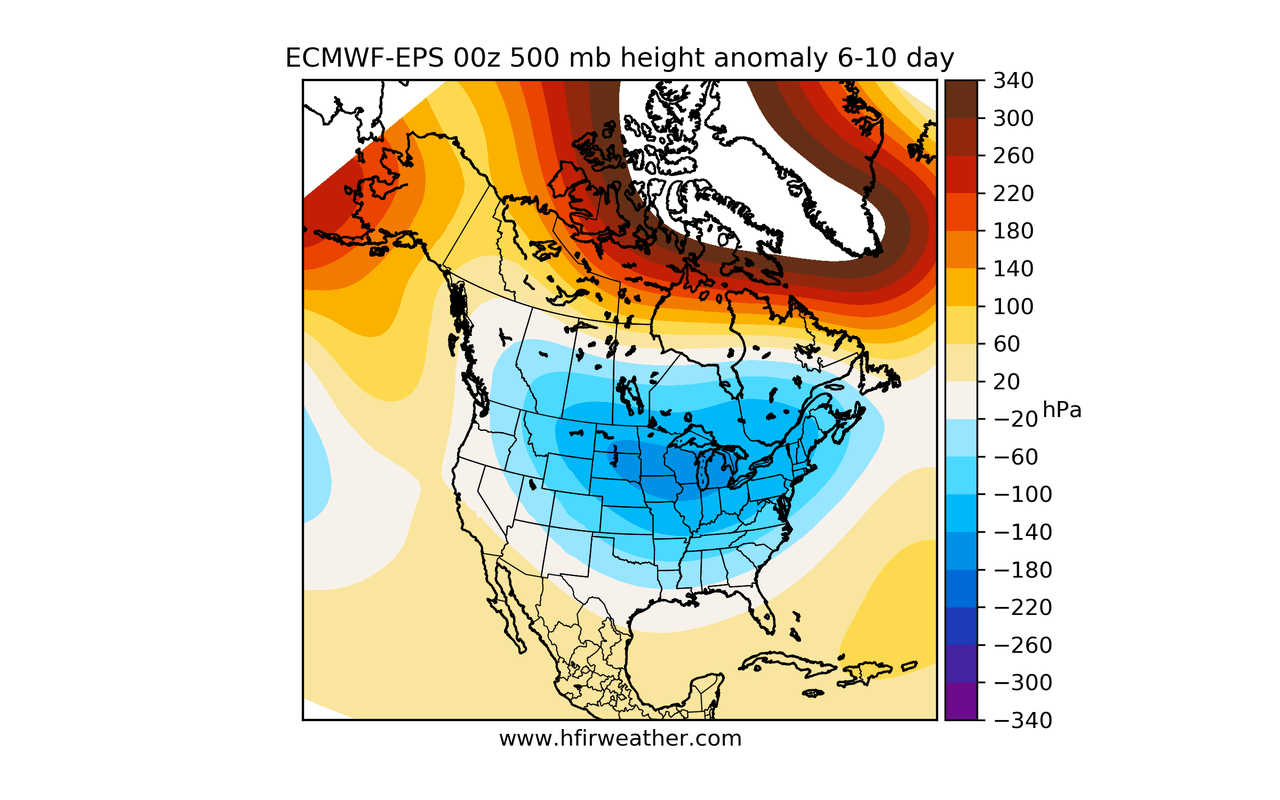
As you can see from this year's chart, the cold is trapped largely in the East, which boosts heating demand, but not enough to be considered devastating (to fundamental balances).
What does this mean?
As we wrote in our Monday NGF, the cold risk had been entirely priced in. The only way for natural gas prices to rally further was if the cold intensified and that was a low probability event. Now that the market has sold-off, is it time to go long again?