


Following the MOU announcement in mid-June, we saw a surge in vessels exiting the Strait of Hormuz.
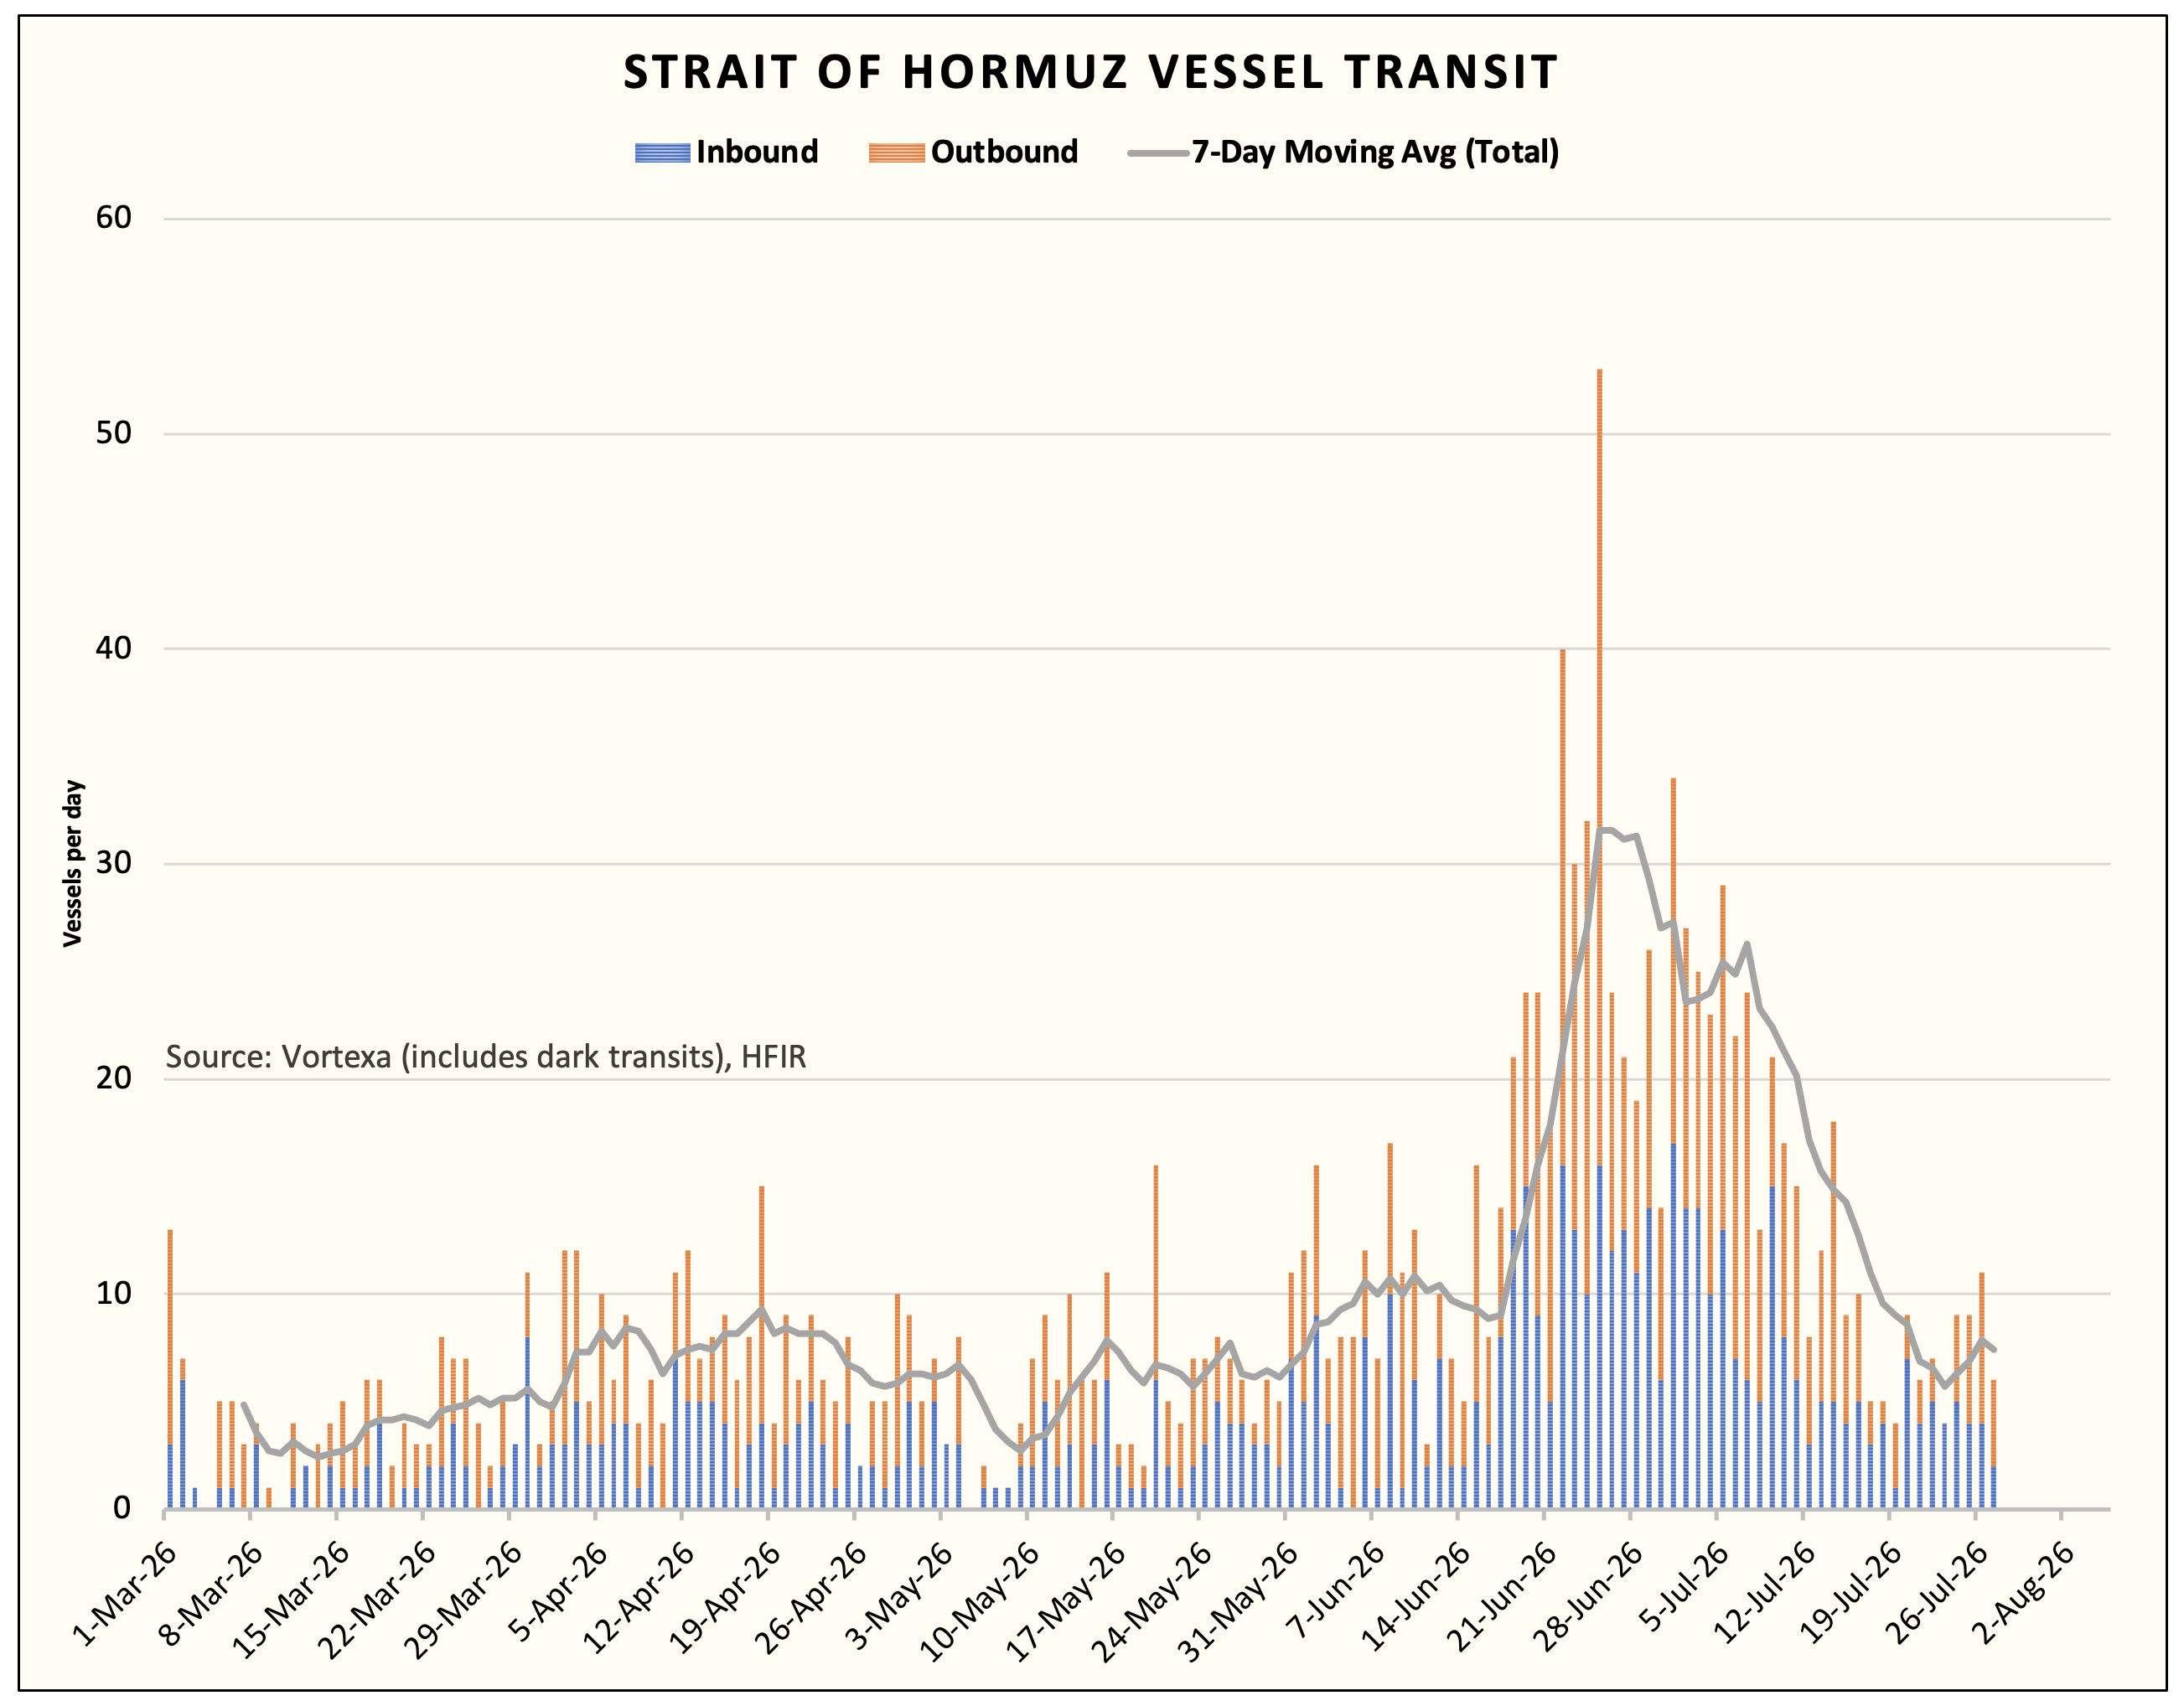
Third-party data providers like Kpler and Vortexa pegged the volume around ~150 million bbls. This initial surge coupled with higher crude loading from the Middle East (using the Oman lane) saw a surge in oil-on-water.
Floating storage, characterized by tankers idled for over 7 days, decreased to a low of ~85 million bbls, down ~100 million bbls. The decline began in mid-May and continued into early July before the escalation resumed. Floating storage is now back up to ~131 million bbls.
Higher floating storage especially in the Middle East is a signal that both the transit in the Oman lane and the post-war status quo are back.
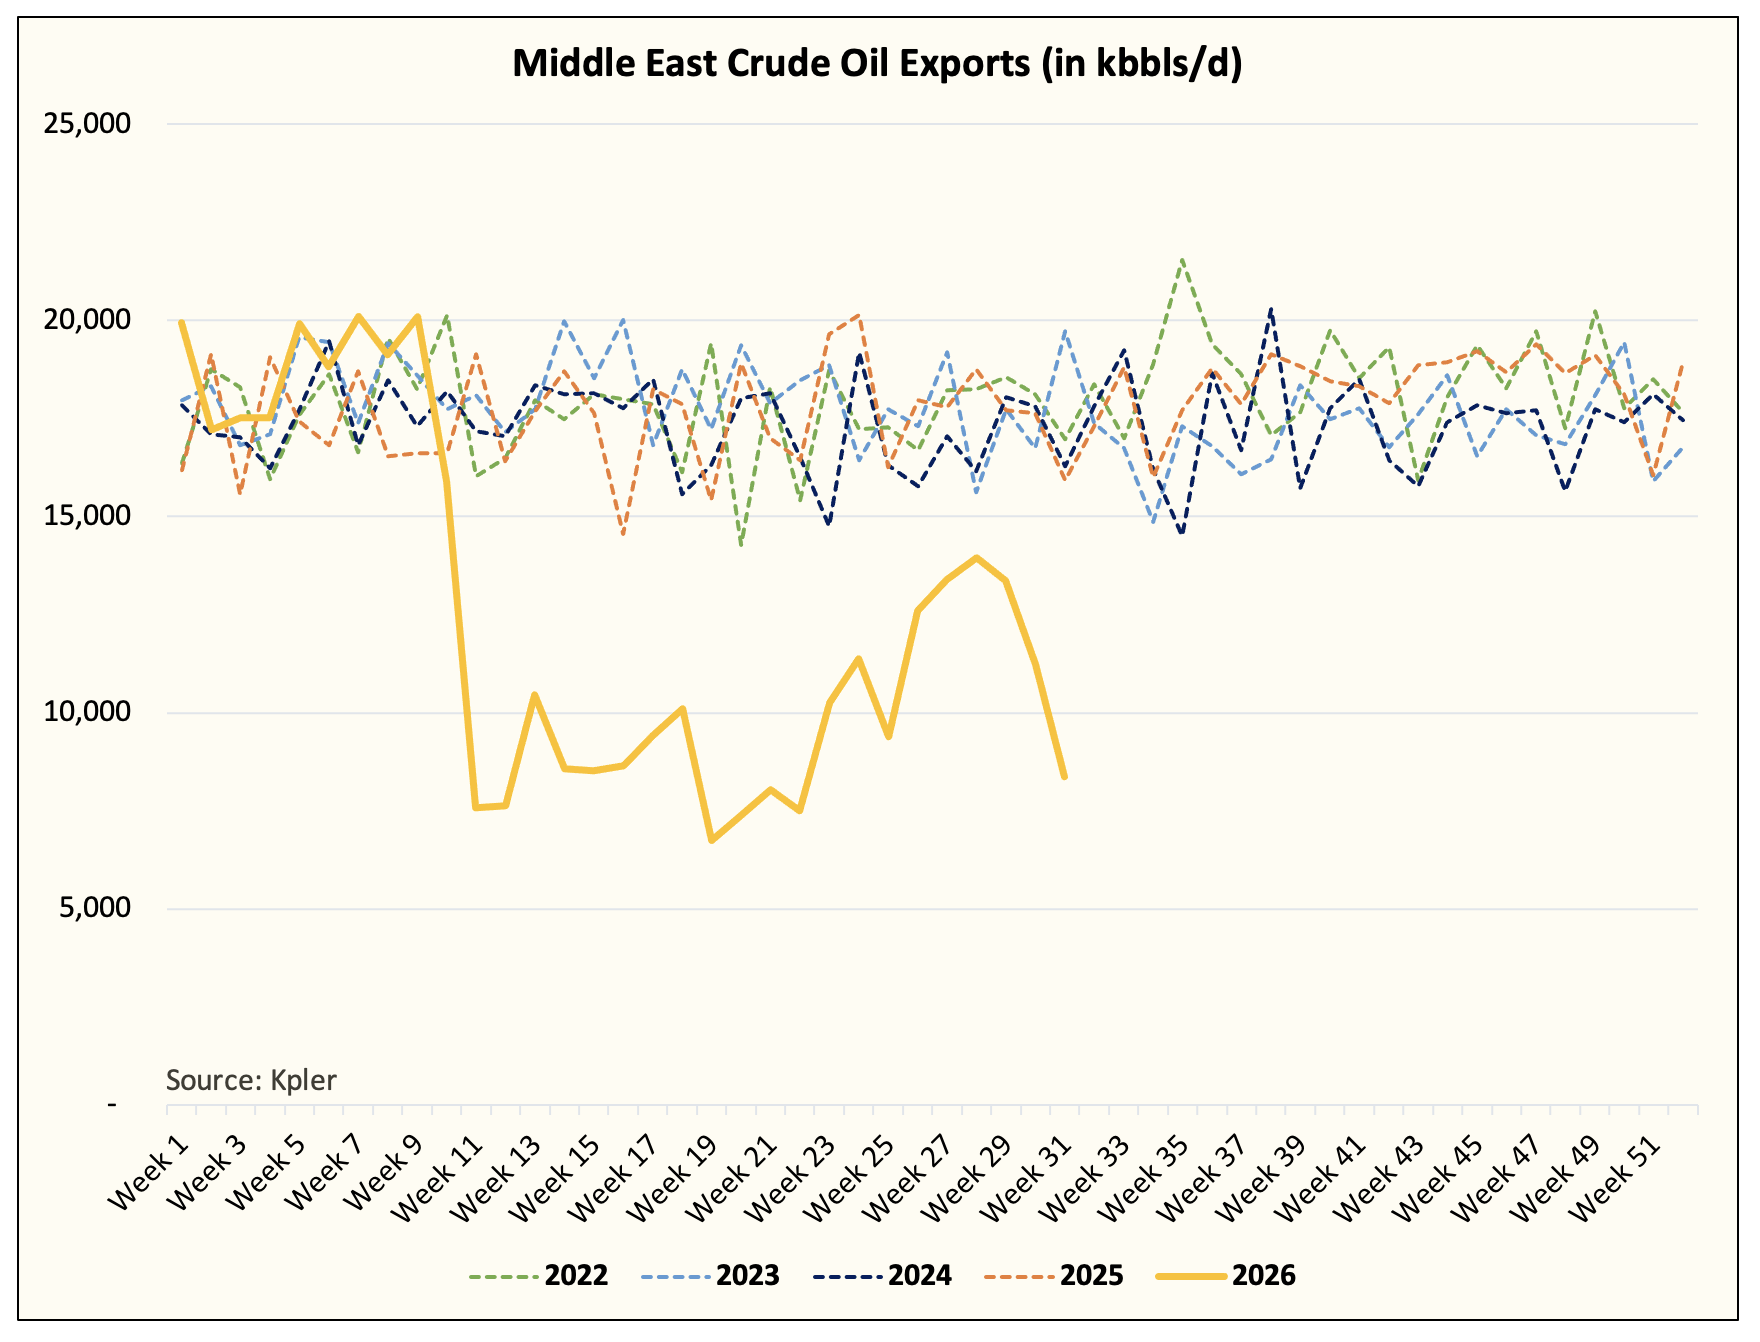
On the crude flow front, we saw an initial surge in Middle East crude exports as producers loaded empty tankers already in the Gulf and drained onshore crude inventories.
Middle East Crude Storage
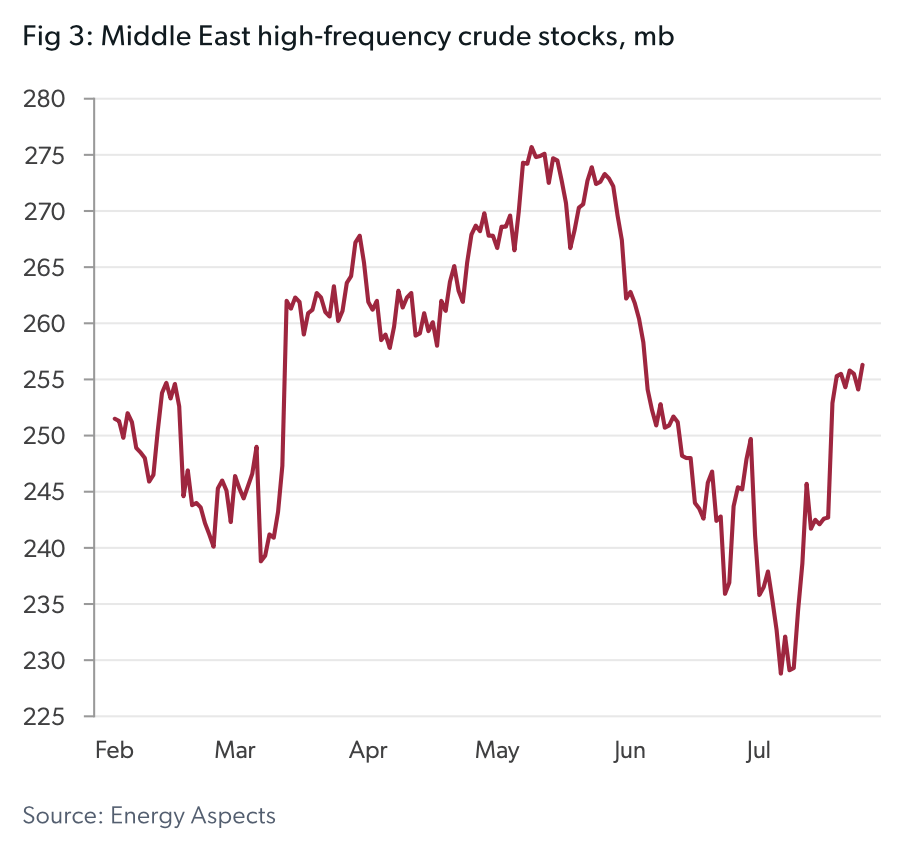
But as you can see in both charts above, Energy Aspects shows a surge in crude inventories as loadings drop off. We are also seeing this in the weekly crude export figure.
In essence, the MOU sugar rush is gone now.