The Tide Is Turning In The Oil Market
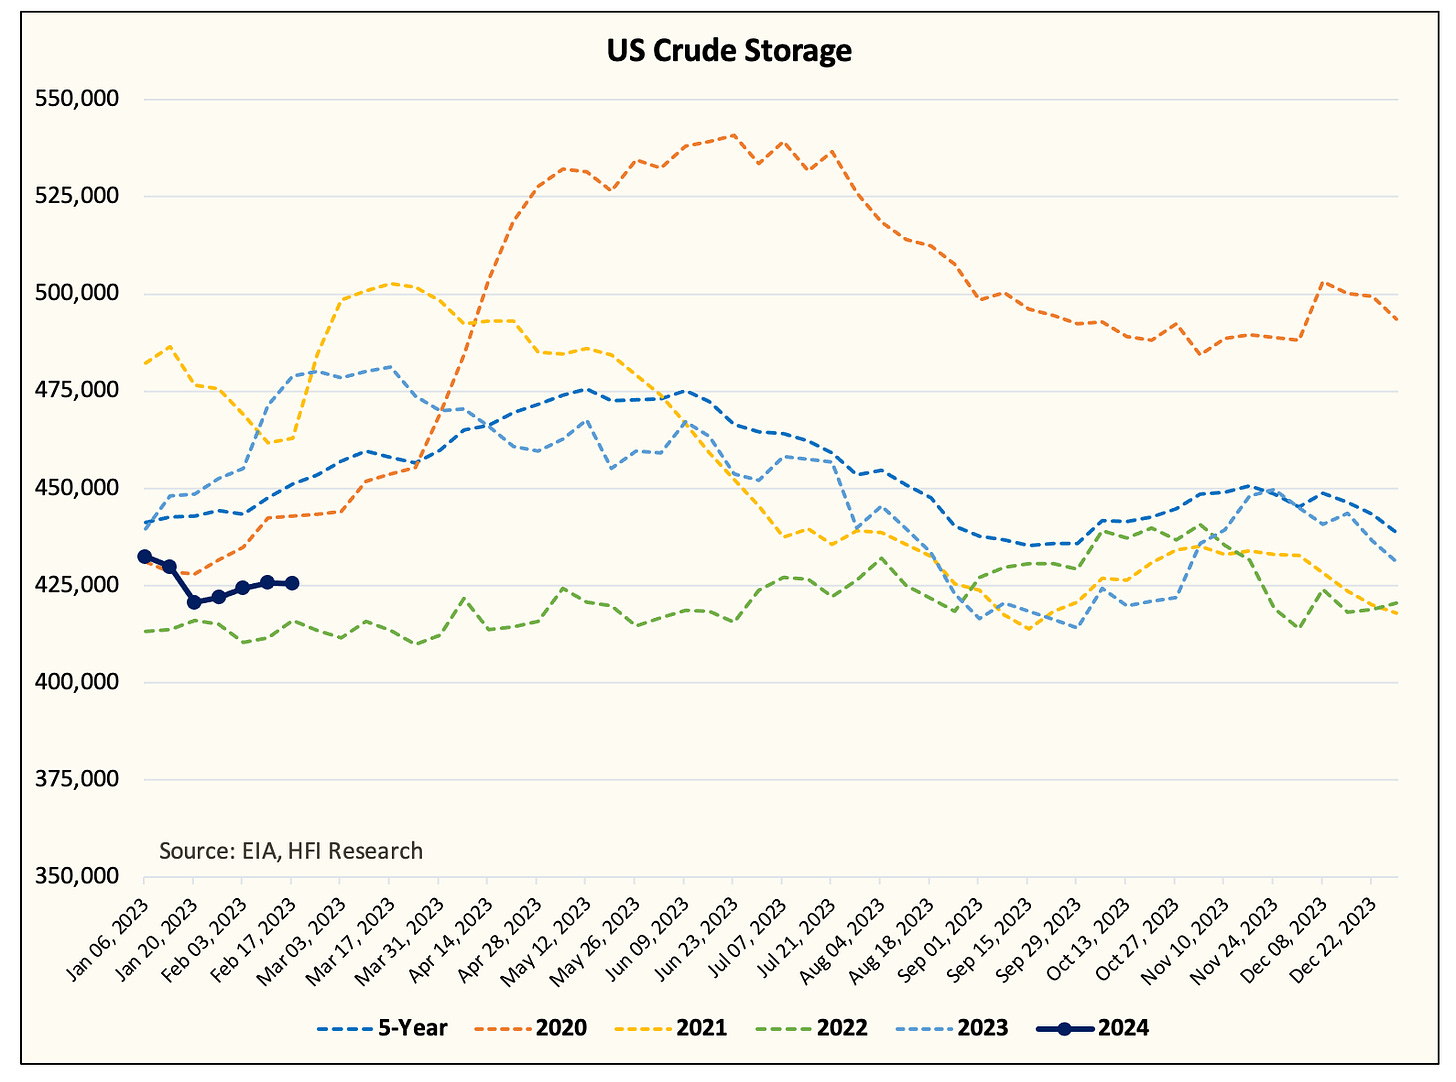
Q1 2024 is starting with a bang. Global oil inventories along with the most visible US oil inventory continue to trend bullishly.
Global Onshore Crude
US Total Liquids
With balances starting off on such a positive note, it does beg the question what the rest of Q1 looks like.
On the US crude side, the sudden and severe drop in US refinery throughput today altered our projections.
For the moment, we have US crude balances flatlining into mid-February versus the draw we previously expected. But thanks to lower refinery throughput, we should start to see product storage meaningfully move lower.
We expect to see gasoline, distillate, and jet fuel fall closer to 2022 by the end of February.
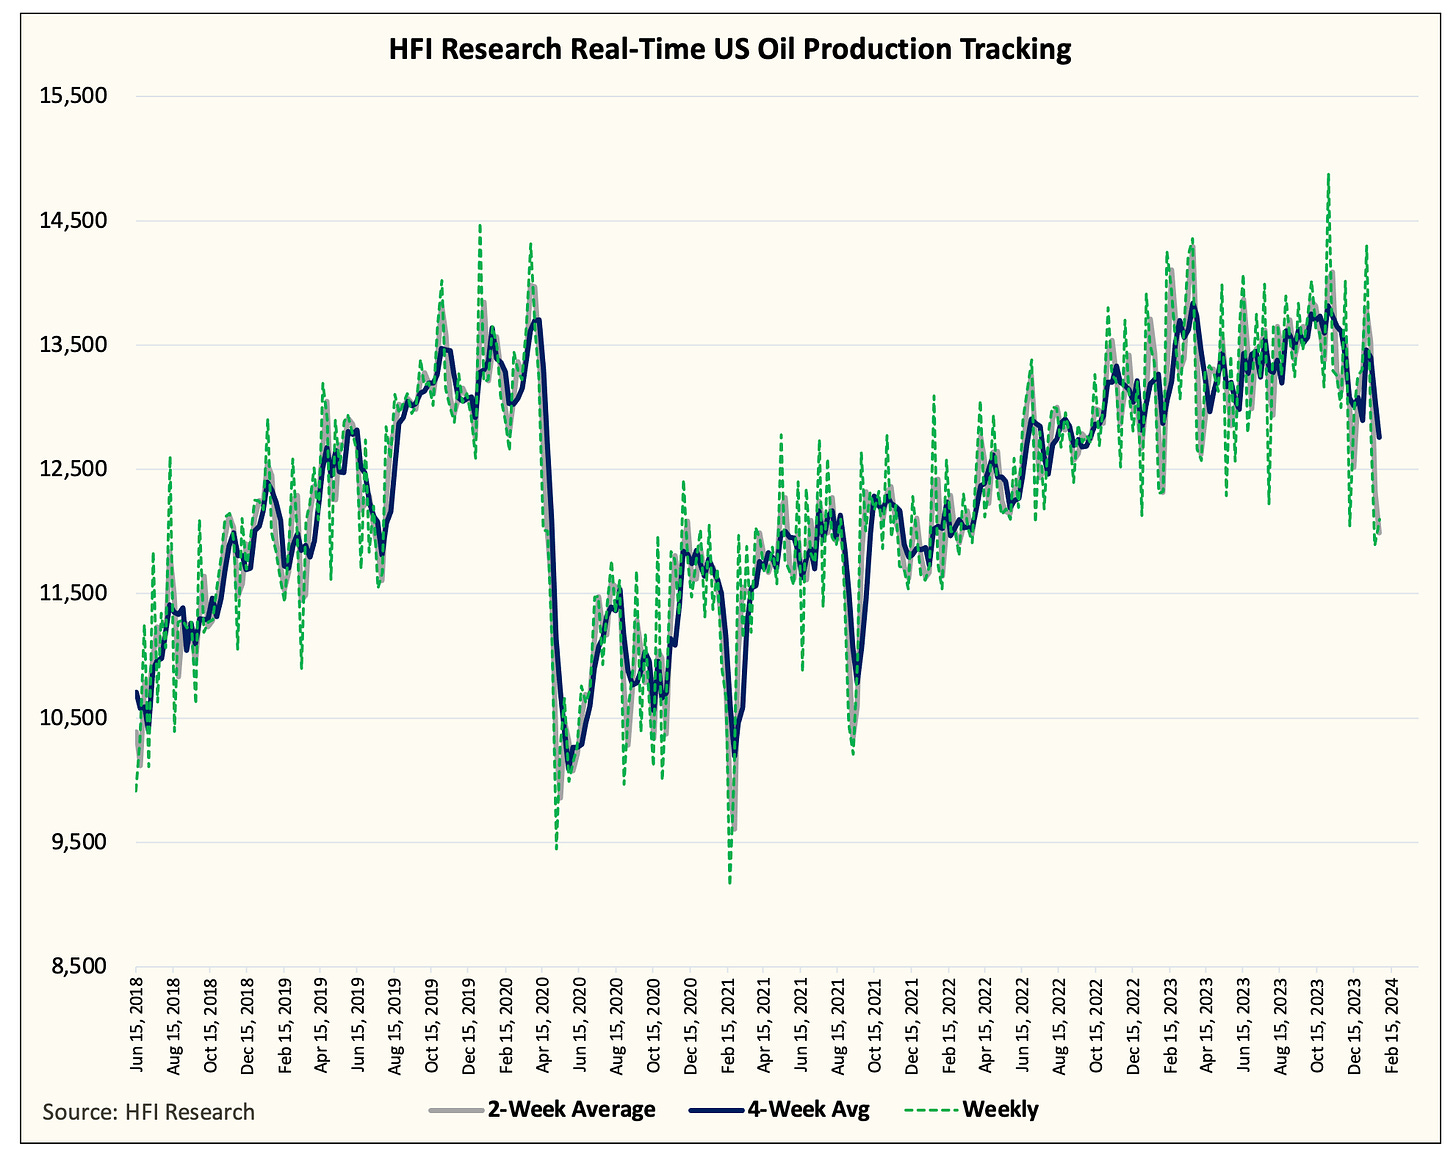
All of this is coming at a time when US oil production is now starting to show a meaningful decline.
Looking at our real-time US oil production tracker, you can see the steep drop in production since the peak in November. EIA 914 was released today with the production pegged at ~13.308 million b/d. Since then, US oil production has fallen to ~12.757 million b/d in January.
Keep in mind that there is ~250k b/d of production impacted by the freeze-off. So normalizing the cold blast, US oil production would have averaged ~13 million b/d. While this is a slight pick-up relative to December's average of ~12.9 million b/d, we expect the February and March average to be between ~12.8 to ~12.9 million b/d.
With time, if our analysis is correct, then it validates the assumption that the ramp-up in US oil production we saw into year-end 2023 came from private operators seeking a transaction. Because of the nature of US shale production, this production growth will not be repeated in 2024, and with production set to decline in Q1, we won't see ~13.3 million b/d until August/September.


