


Editor’s Note: Due to the government shutdown, EIA did not have US crude export figures for August. The adjustment is partially related to that. Please keep that in mind when reading this article. Thank you.
The EIA’s petroleum supply monthly report was released today, and August US crude oil production reached 13.794 million b/d, a new all-time high. On a year-over-year basis, this puts US crude oil production higher by 430k b/d. Most of this supply growth, if you exclude NGLs and similar products, came from Exxon.
This morning, Exxon reported that oil production in the Permian reached ~1.7 million b/d. This is +300k b/d y-o-y. Assuming that 1/3 of the production (rough estimate) is NGL-related, Exxon effectively contributed to ~50% of US crude oil production growth.
One of the things we’ve been hammering away on X is that the recent strength in US crude oil production (August and September data) was likely the result of Exxon “justifying” its Pioneer acquisition. Exxon intends to have its Permian assets reach ~2.3 million b/d by 2030, so that’s another ~600k b/d the market will have to absorb.
Will that growth happen at $60/bbl? Doubtful, but then again, Exxon has been ramping production with oil prices weak all year. This starkly counter-cyclical maneuver will not only prolong the current surplus we are seeing in the market, but it will also prolong the correction process as well. (More discussion on this later)
But for close followers of our US crude oil production tracking, we want to make something very clear to you. The August US crude oil production is not what it seems on the surface.
In particular, the delta is in the finer details.
In the EIA PSM report, there’s a segment called “adjustments”.
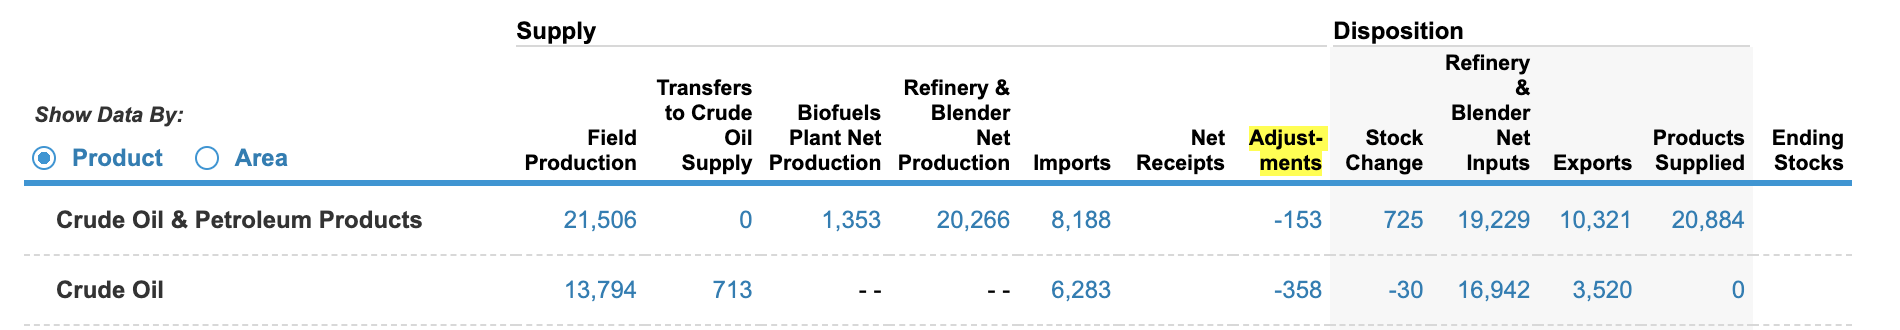
Source: EIA
This figure is important to understand here because it tells you the “missing” part of the equation. In this case, US crude exports and imports use customs data. US refinery throughput is survey-based and very accurate by nature. So the only missing piece that’s subject to data volatility is US crude oil production, transfers to crude oil supply, and the remaining balance is in transfers to crude oil supply.
Now, the main reason why the adjustment was firmly negative this month (August) is because transfers to crude oil supply (the old adjustment) jumped to +713k b/d. In the EIA weekly data, this was stated around ~450k b/d.
The delta of ~263k b/d is condensate that was included as the crude supply in the weekly data.
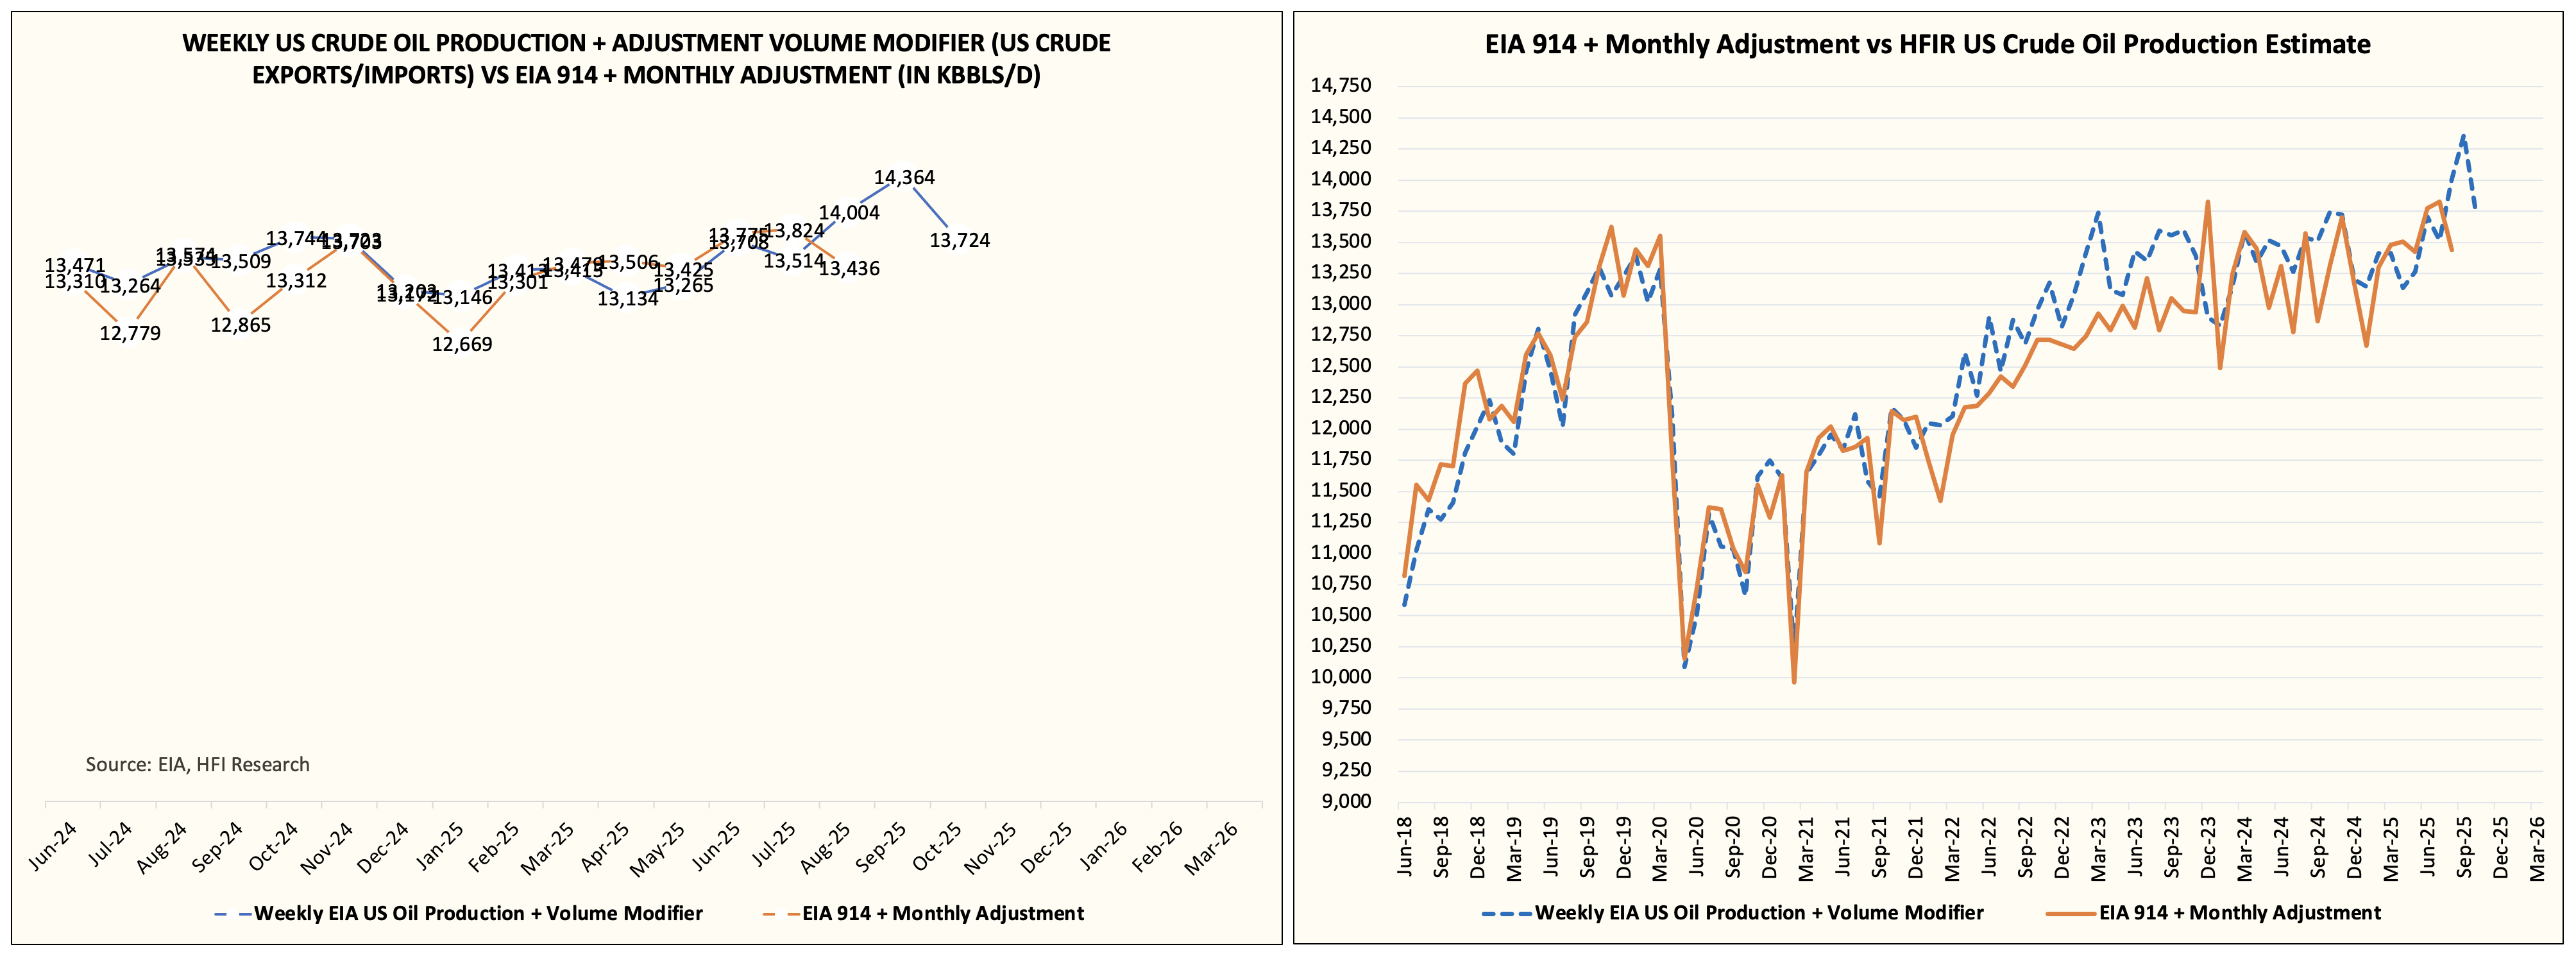
In essence, what I’m trying to say is that EIA likely overstated US crude oil production for August. This is why the adjustment is firmly negative. The weekly report made it appear that US crude oil production was hitting ~14 million b/d when it was plant condensate that was being included in the crude data.
This discrepancy will continue to worsen as US shale crude oil production gets lighter and gassier. Plant condensate will grow as a percentage of production, so data noise volatility will increase.
To summarize what I’m trying to say: US crude oil production for August was closer to ~13.436 million b/d. The 3-month moving average (production + adjustment) is 13.678 million b/d.