US Oil Demand Is Not Great, There's No Other Way To Put This
EIA reported a total liquids draw today with crude surprising to the bull side with a draw on the heels of a 6 million bbl SPR release. The crude draw came on the back of a major uptick in refinery throughput, but given the operational capacity, we have perhaps another 500k b/d of throughput to go before maxing out.
But oil prices are only slightly up following the report because the US implied demand came in weak.
As you can see in the chart above, the above chart is the implied oil demand for gasoline, distillate, and jet fuel. We were supposed to see a big uptick in the core 3 this week, and instead, we only had a minor bump. Going forward, every week the data lags behind is another week suggesting that high oil prices are taking a toll on the economy.
Now while this metric is not perfect, we should have seen an uptick by now given the seasonality factors. If by the middle of June, we are not at least back to 14.5+ million b/d for the core 3, we have a real problem on our hands.
It will indicate to me that 1) oil prices are too high and leading to a demand slowdown and 2) the economy is slowing.
If this proves to be the case, we will have to reduce position sizes. The economy slowing down will hit all the sectors, energy will survive and still thrive, but positioning will have to be reduced. This is not for certain yet, but I do want to give you all a heads up as to what I'm watching out for.
The same goes for the other demand variables. The heating components are falling as expected on seasonality, so normally, things like gasoline and jet fuel start to pick up. So far, 2022 gasoline demand is still below that of 2021, which is not a good sign.
Looking at the broader picture, things remain bullish. For starters, US oil production showed a major uptick in April before May volumes are showing a drop again.
You can see that US oil production is down from its peak. We still have one more week of data to finalize for May, but it looks like that high-level production was not sustainable. US oil production is not growing anywhere close to the velocity we saw in 2017, 2018, or 2019, so this is a good sign for supplies going forward.
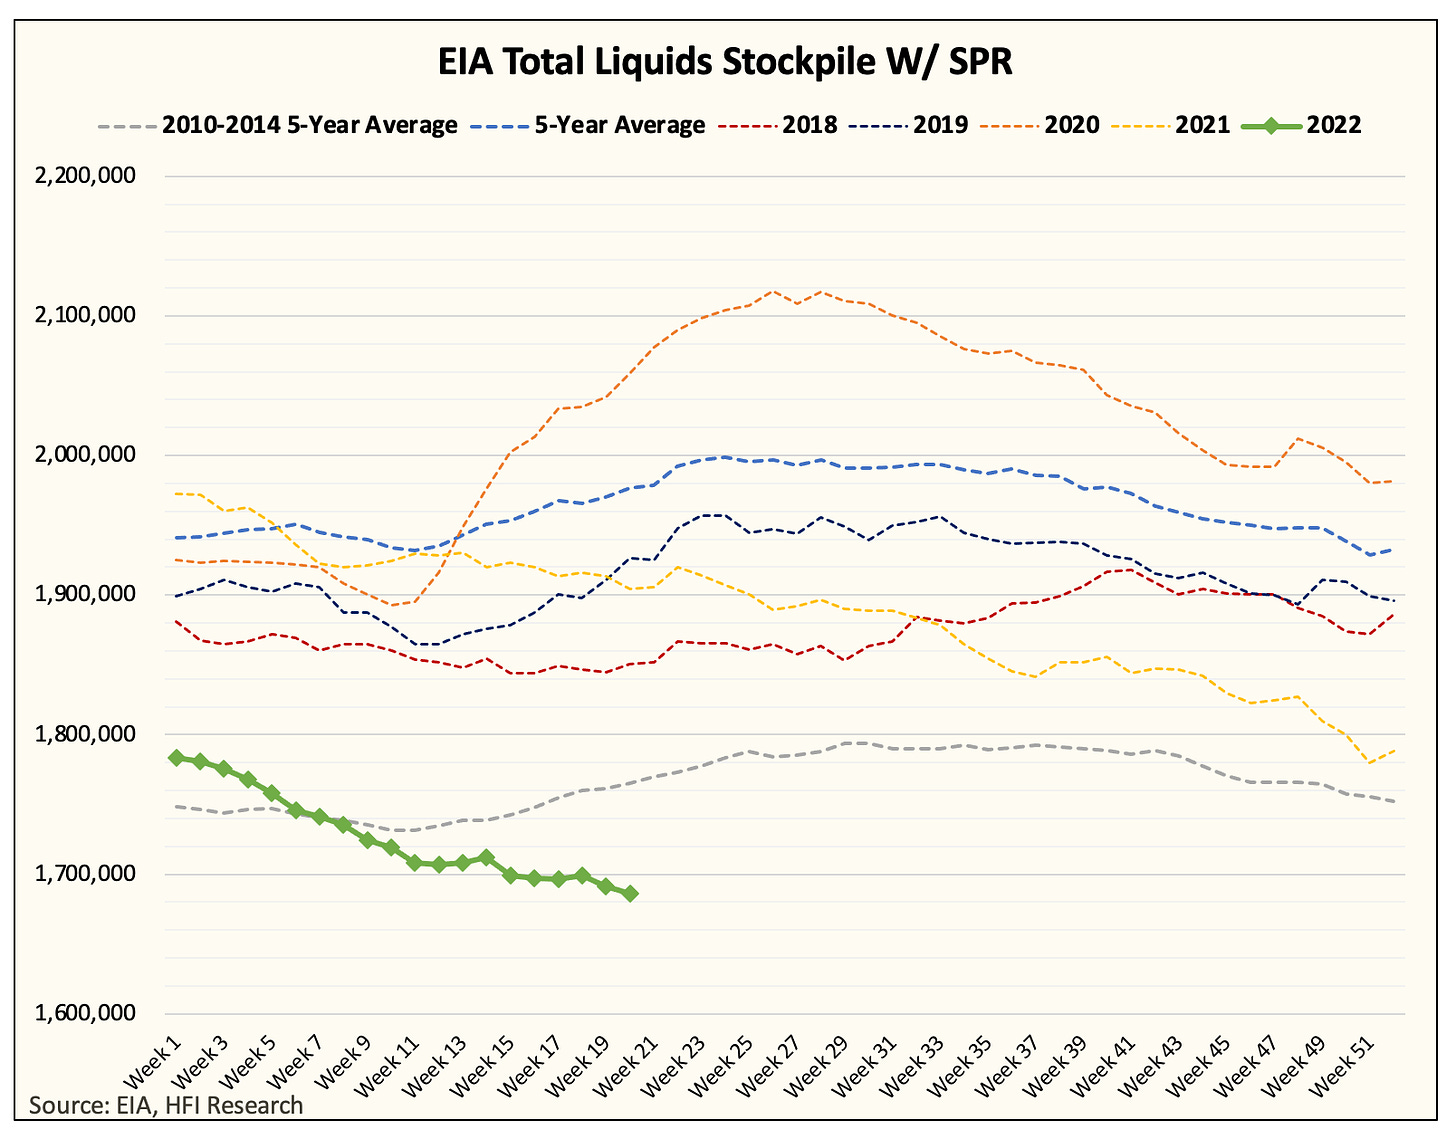
Looking at total liquids, you can see that the SPR chart shows broader inventories trending down, while the commercial chart shows a flatline in inventories. SPR will meaningfully keep commercial inventories flat from now to October. Crude may even see builds throughout the summer months if refinery throughput is limited.
However, the broader picture of oil inventories going down should remain the same. We see that in all of the storage charts.
From a fundamental perspective, the bull picture is still crystal clear. We continue to see an oil market in deficit, but with demand still not recovering fully, the bull picture is tainted. By Mid-June, we need to see an uptick in the core 3 (gasoline, distillate, and jet fuel), if not, then oil demand destruction from higher oil prices is real and it will limit the upside of oil prices.
For now, we see oil prices headed higher. We need demand to play along, and if not, then we need to change our stance.


