
(WCTW) Does It Have To Get Uglier Before It Gets Better?
Changes in global oil inventories in Q3 (so far) are not bullish, and what the path ahead looks like.

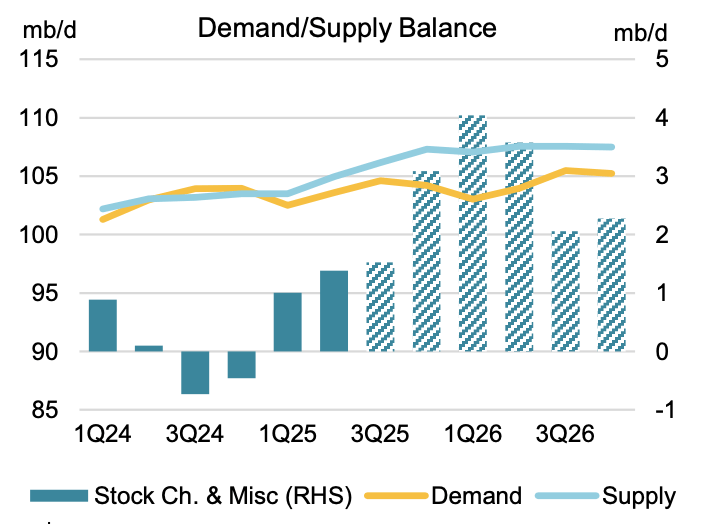
The big news headline that's grabbing the energy community's attention today is the supply & demand chart from the IEA.
Source: IEA
While the IEA is notoriously bad for estimating global supply & demand, there are a few things worth noting here:
Q2 global oil inventories saw builds totalling more than ~1 million b/d.
Q3 global oil inventories are not drawing as we had expected. Instead, implied balance shows a build near ~700k b/d (lower than the IEA, but not bullish). We will explain why more below.
Total liquids have built ~181 million bbls (OECD, satellite, and oil-on-water), resulting in an implied oversupply of +0.82 million b/d.
OPEC+ crude export supplies have been more limited thanks to lower Saudi crude exports, but countries like the UAE are increasing, which would add supplies to the market.
US shale producers won't show a meaningful decline in production into year-end, which further compounds the issue.