

What we are witnessing today in the oil market is history in the making.
How so?
From the onset of the Iran conflict, these three were our signals:
Crude timespreads: a reflection of the underlying physical market condition of the crude oil market.
3-2-1 crack spread: a reflection of product demand, refinery profitability, and the durability of the price strength/weakness in crude.
Onshore oil inventories: a reflection of underlying supply & demand dynamics. If onshore oil inventories draw, balances are in deficit; if they build, balances are in surplus.
If you have been following the oil market, you will know that the current conditions are as follows:
Crude timespreads are weak, reflecting a bloated physical market. Reason?
Chinese Crude Imports
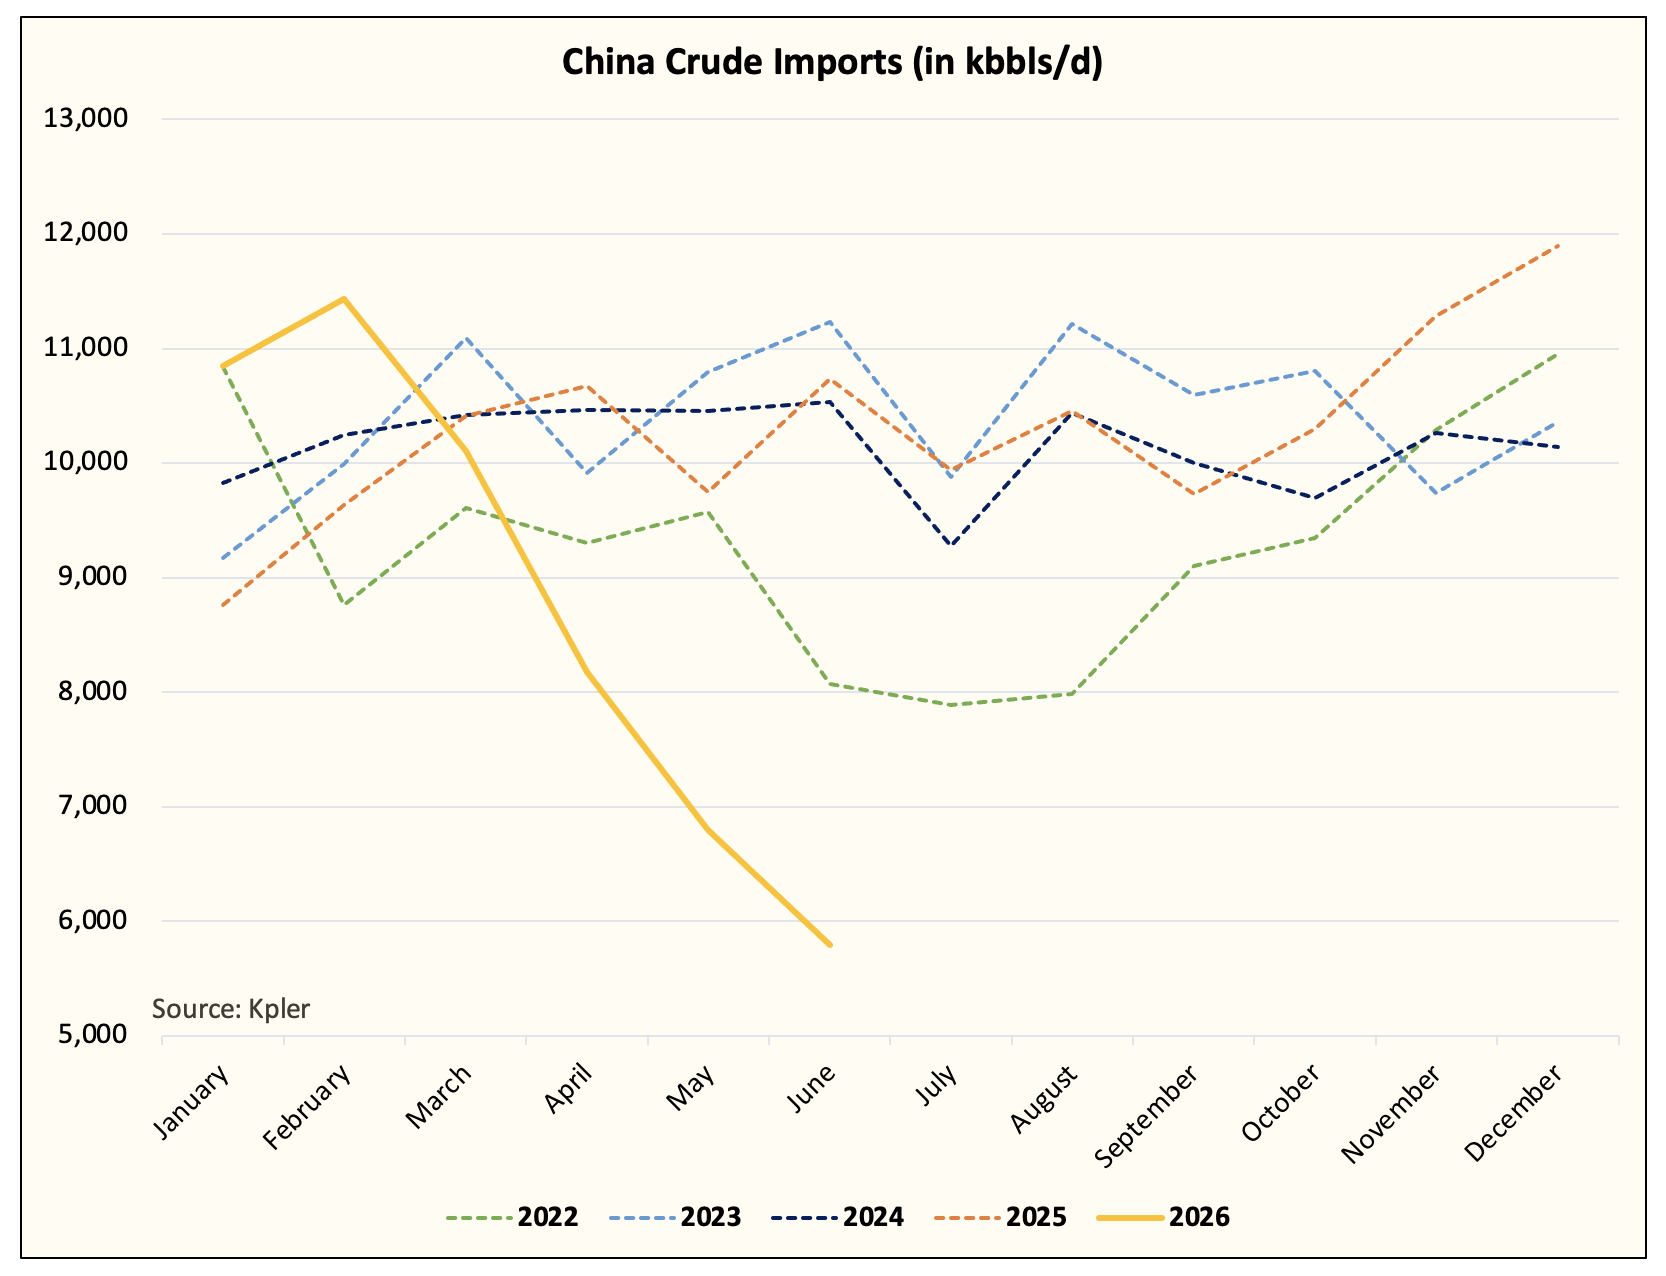
Chinese crude imports are down 4.9 million b/d y-o-y.
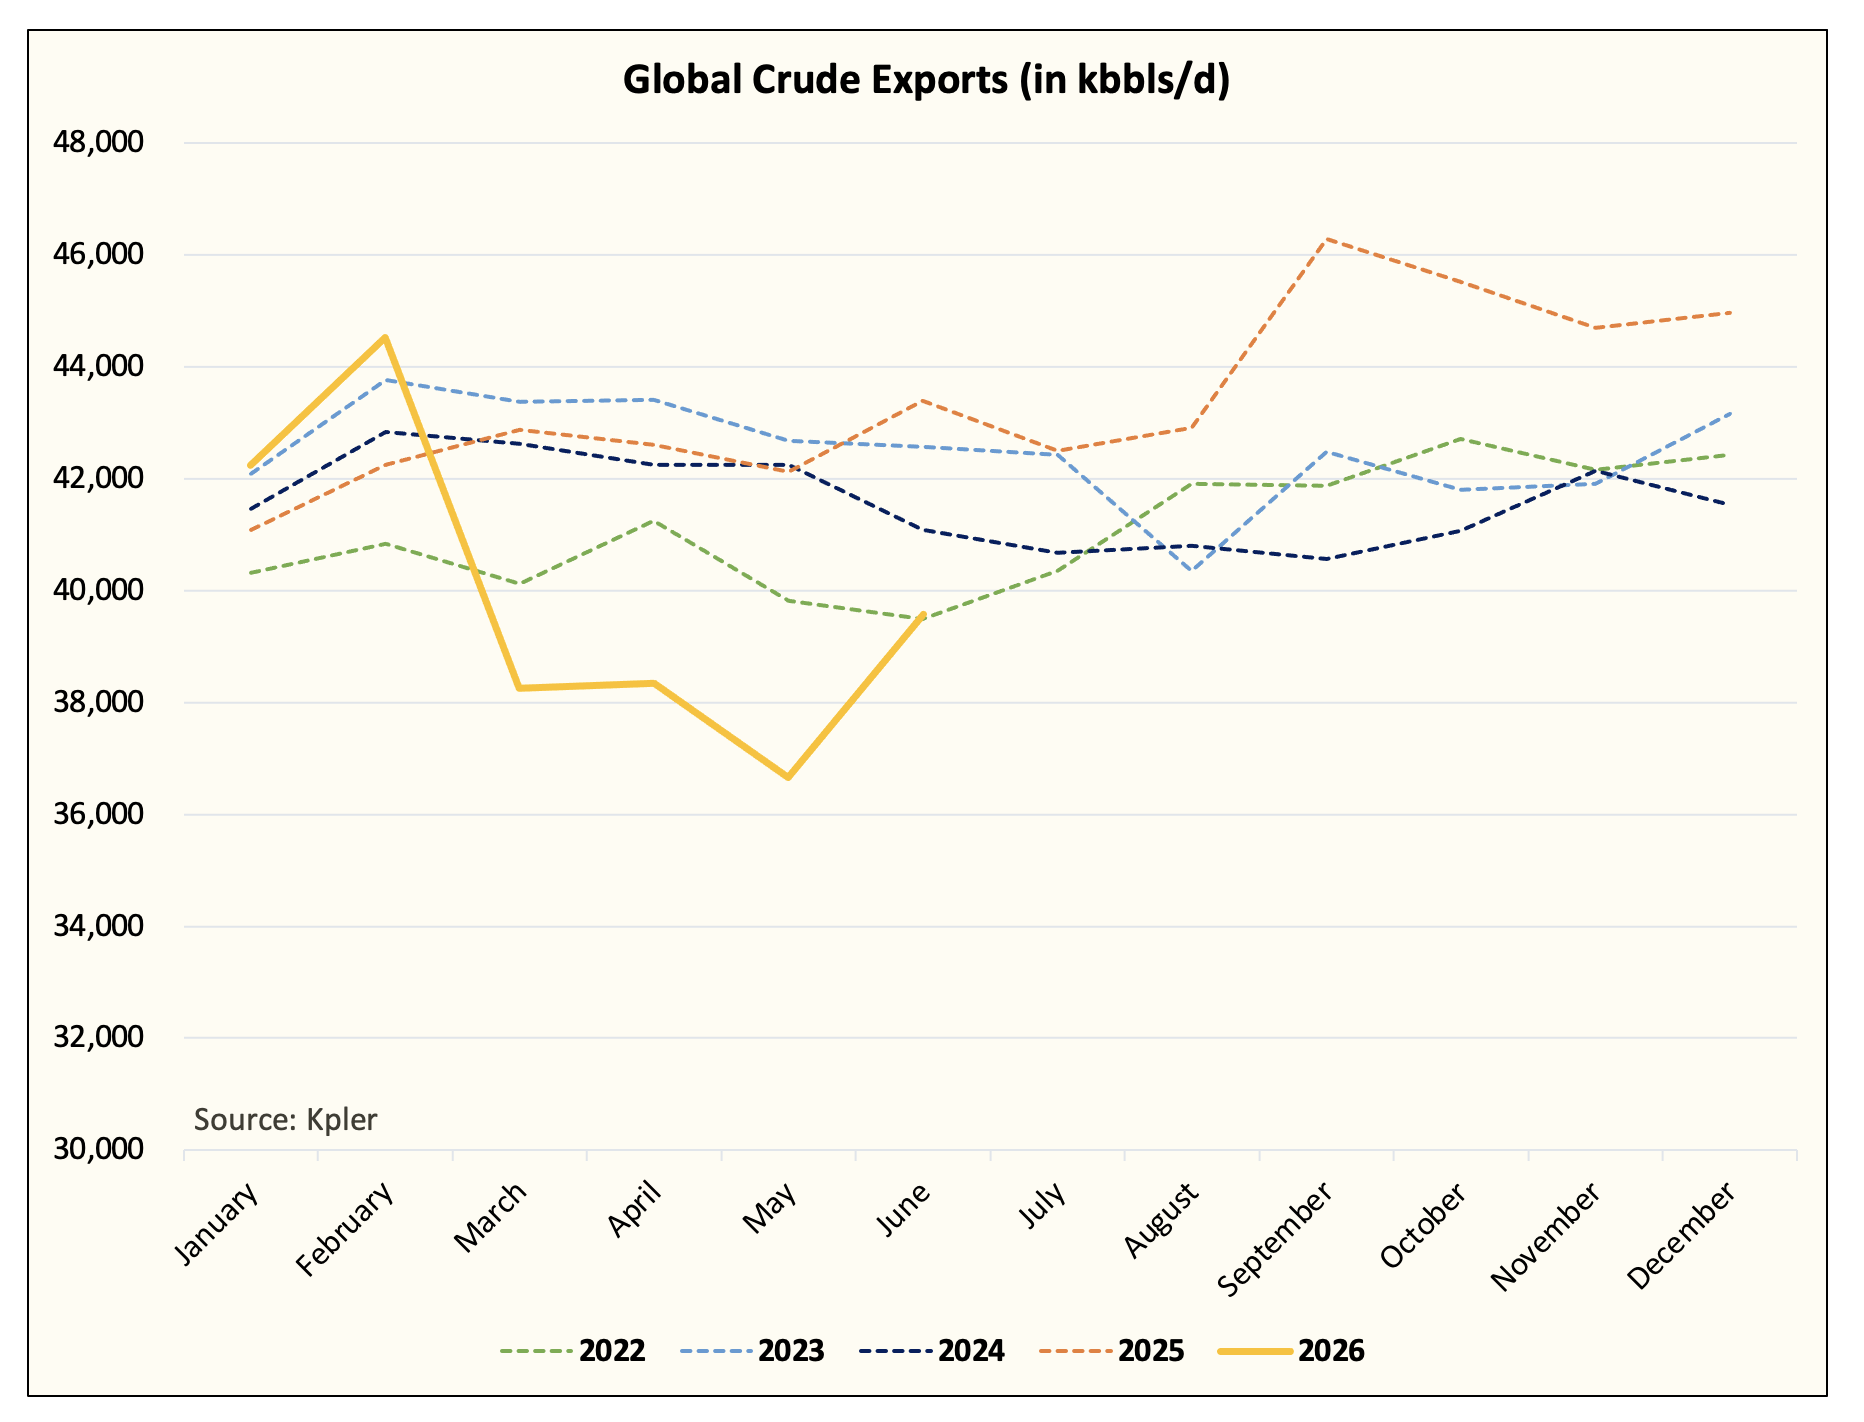
Global crude exports are currently down 3.8 million b/d y-o-y.
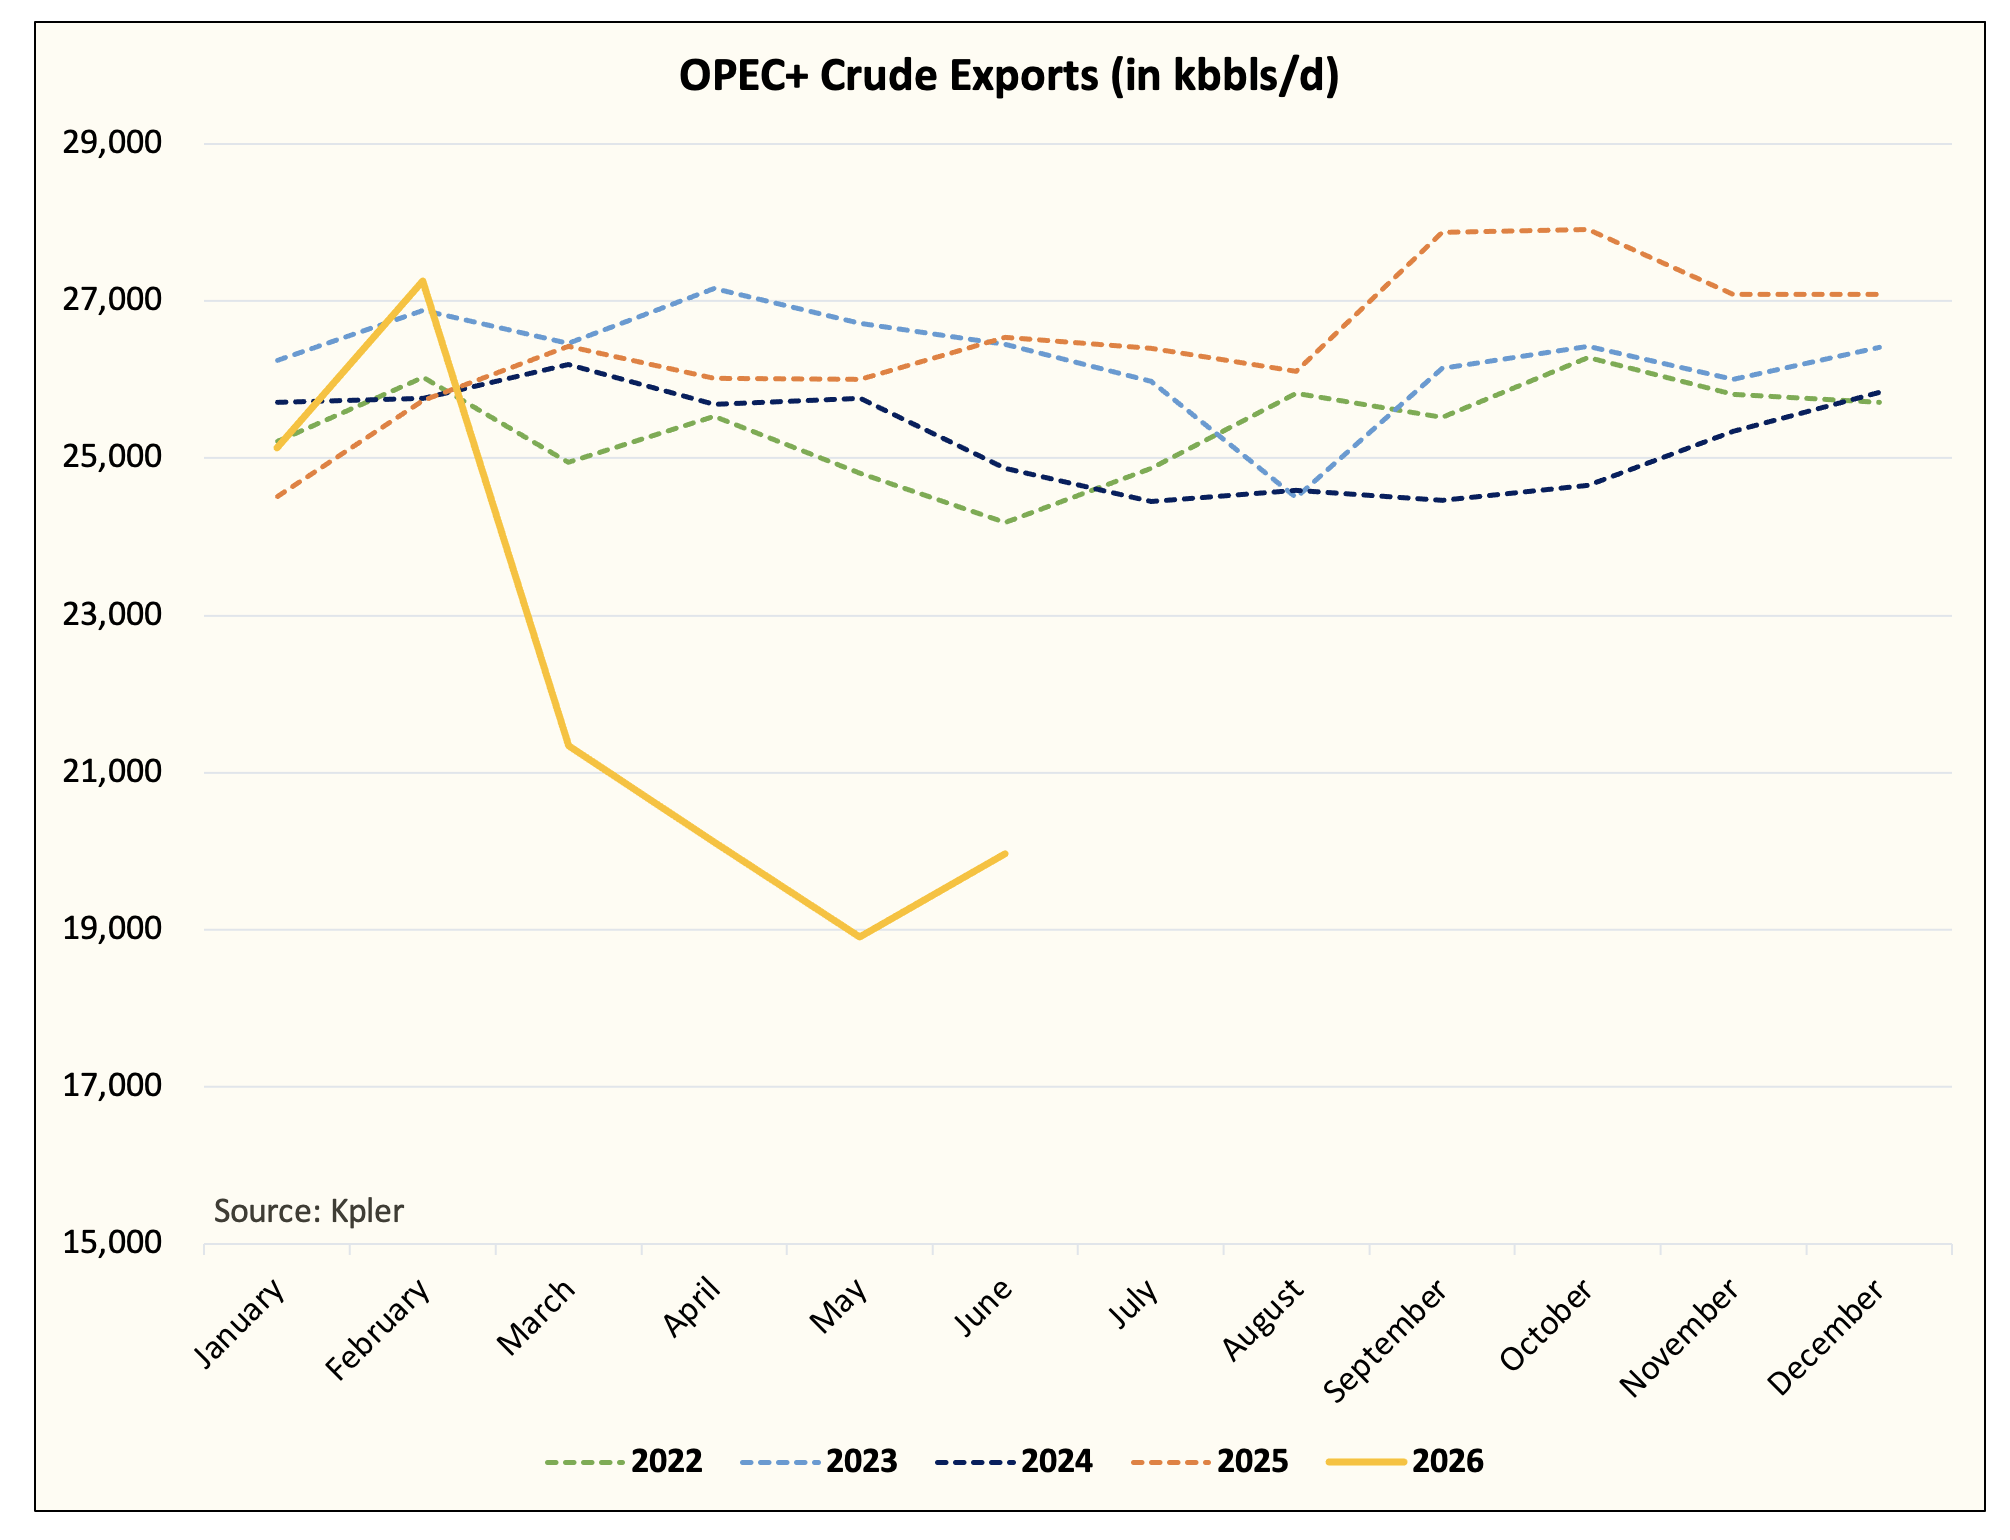
OPEC+ crude exports are down 6.5 million b/d y-o-y.
Now if you add US, UAE, Russia, Brazil, and Venezuela, which have increased crude exports by ~1.6 million b/d y-o-y, this is what the imbalance chart looks like:
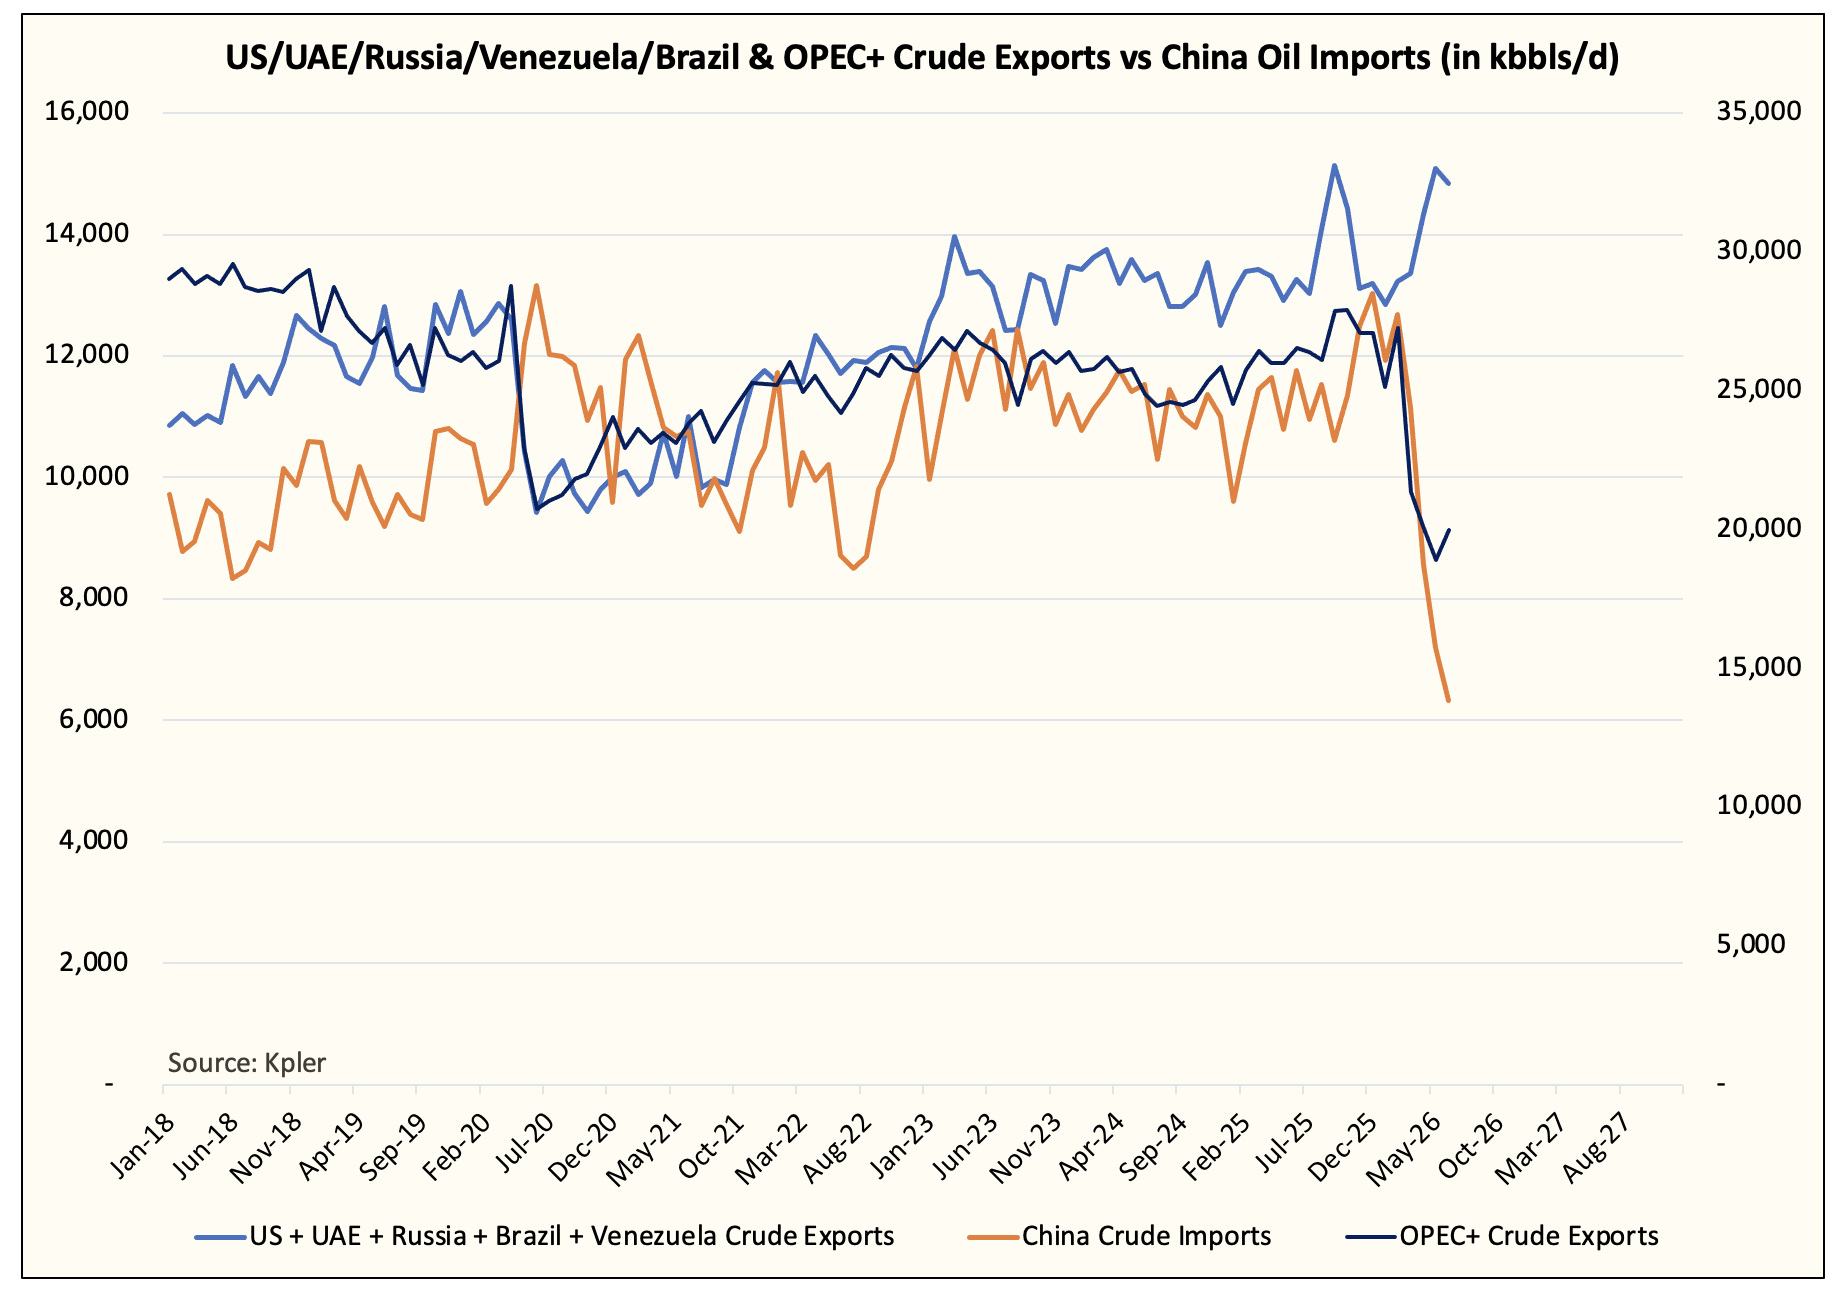
The combination of higher exports from the listed countries above, coupled with China’s crude import reduction, has offset the crude market in its entirety.
This, coupled with the recent floating storage coming out of the Strait of Hormuz, has sent Brent 1-2 timespread into steep contango.
Does this mean the oil crisis is over?
No, and far from it.