
Welcome Back To The Gasino
May the weather gods be ever in your favor. Natural gas trading profits are not guaranteed, but acid reflux is a certainty.


It’s that time of the year again. Let the weather model routlette begin!
Yes, this is that time of the year where every heating degree day (HDD) changes will create an insane amount of volatility in the natural gas market. In particular this year, there are two key variables that will wreak havoc on both the bulls and bears.
LNG
Natural Gas Storage
This year isn’t your normal year in the natural gas market.
Why?
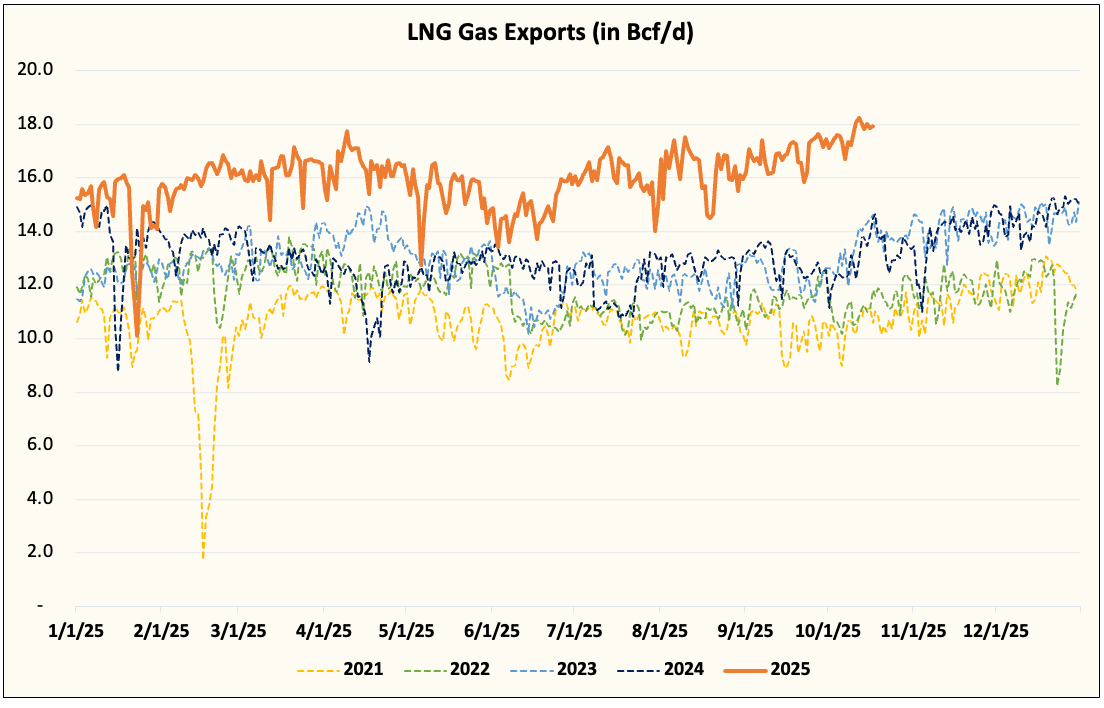
Simple, LNG gas export demand is headed for record highs this winter. Europe has a natural gas shortage going into this winter so US LNG liquification facilities will be operating at max. With new capacity coming online, LNG feedgas is expected to hit and average ~19 Bcf/d.
Shouldn’t the natural gas market be one-sided then?
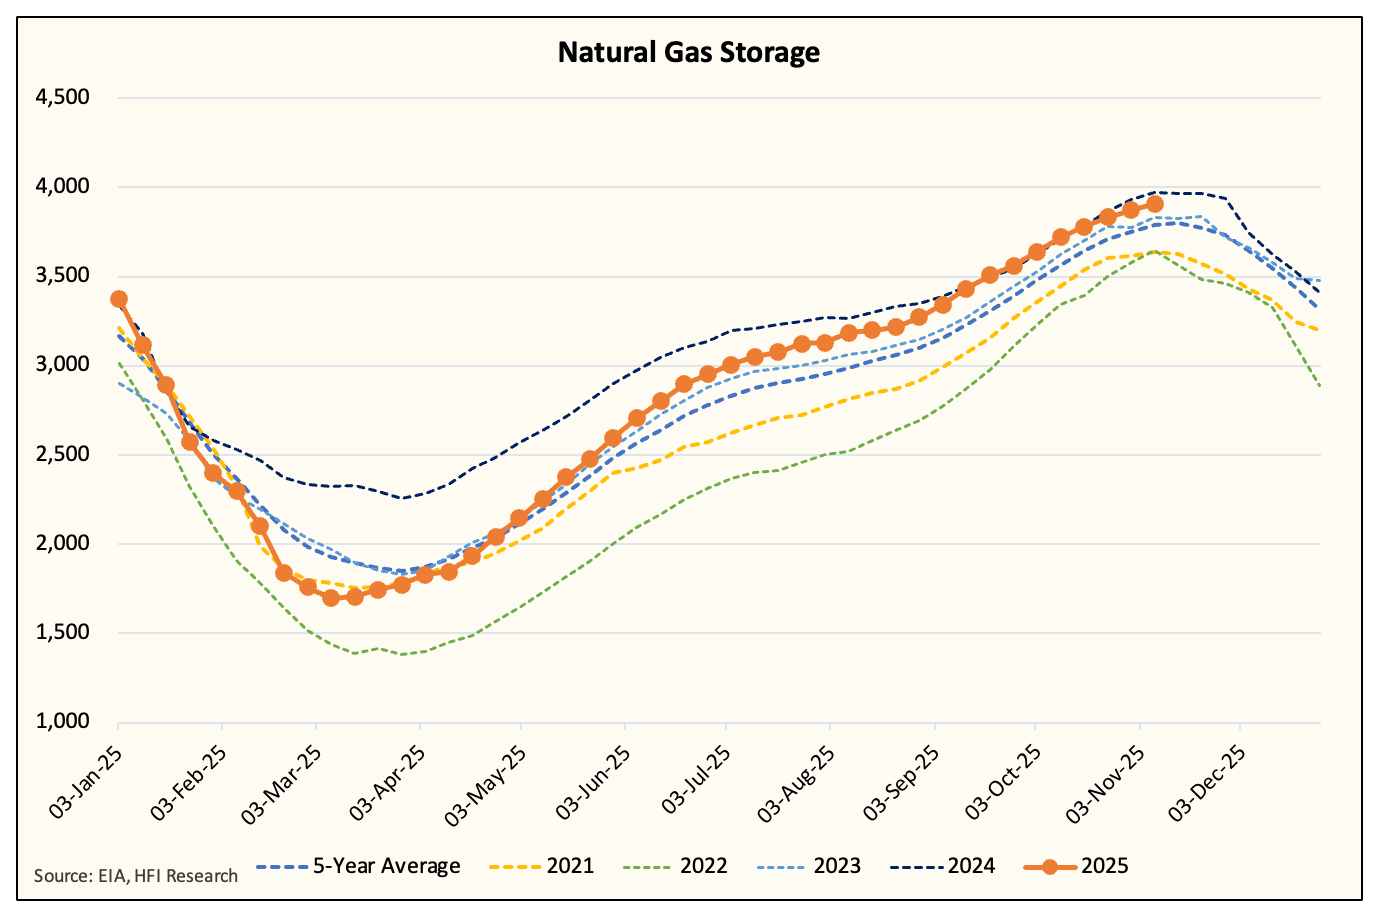
No, because the natural gas storage backdrop is in a surplus.
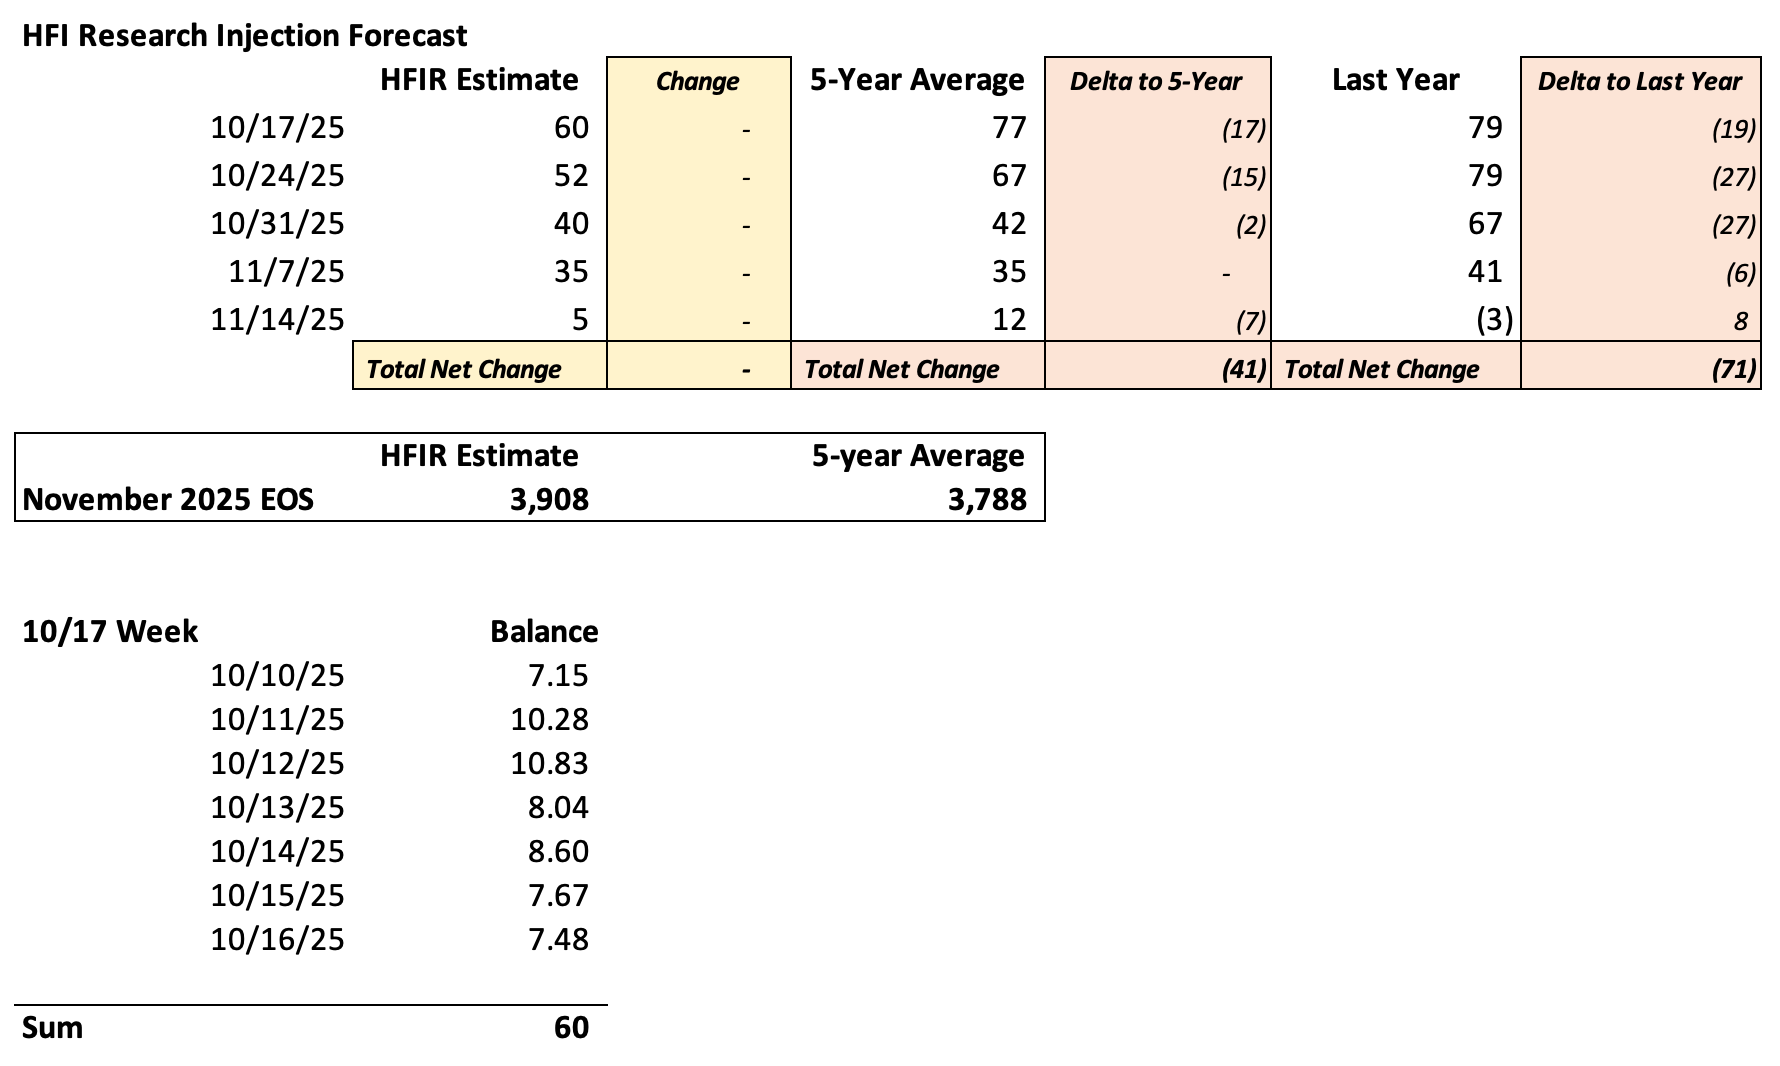
At the moment, we have natural gas storage finishing ~120 Bcf above the 5-year average (3.788 Tcf). Now in the grand scheme of things, this is a small surplus relative to previous expectations. Natural gas prices sold-off meaningfully the last few months in anticipation of 4+ Tcf in storage. With the bullish weekend weather model revisions, this looks to be changing.
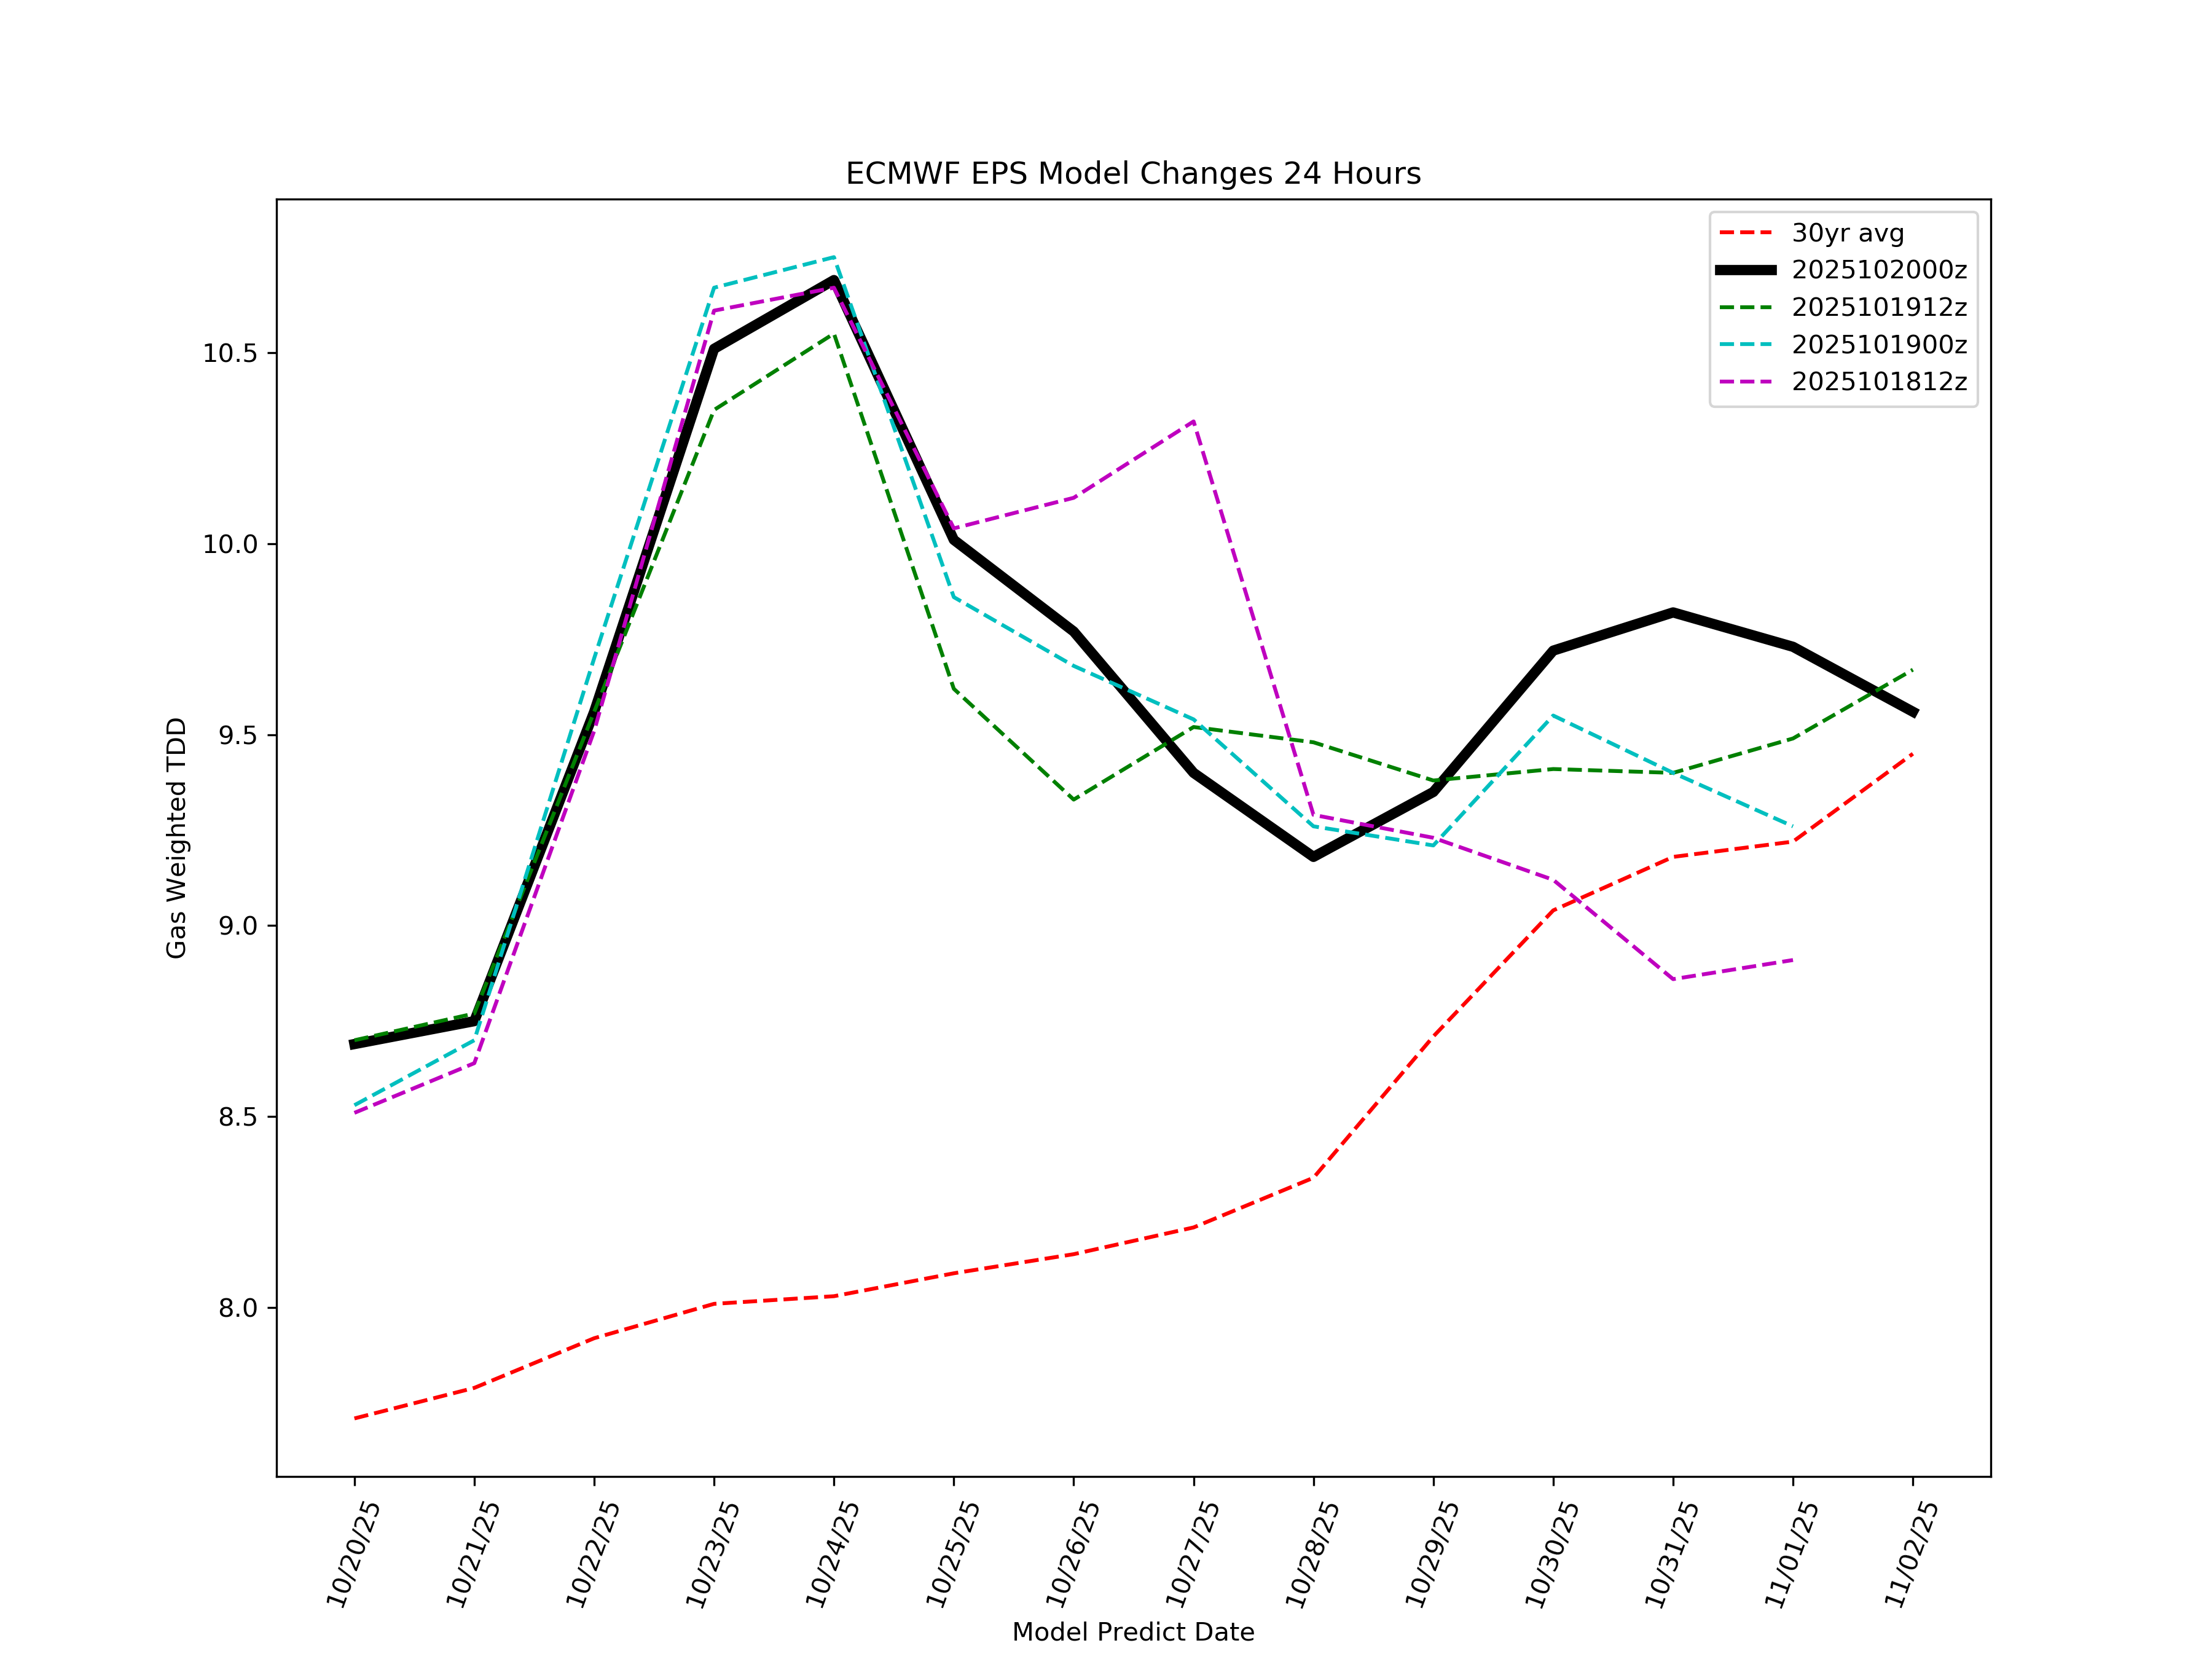
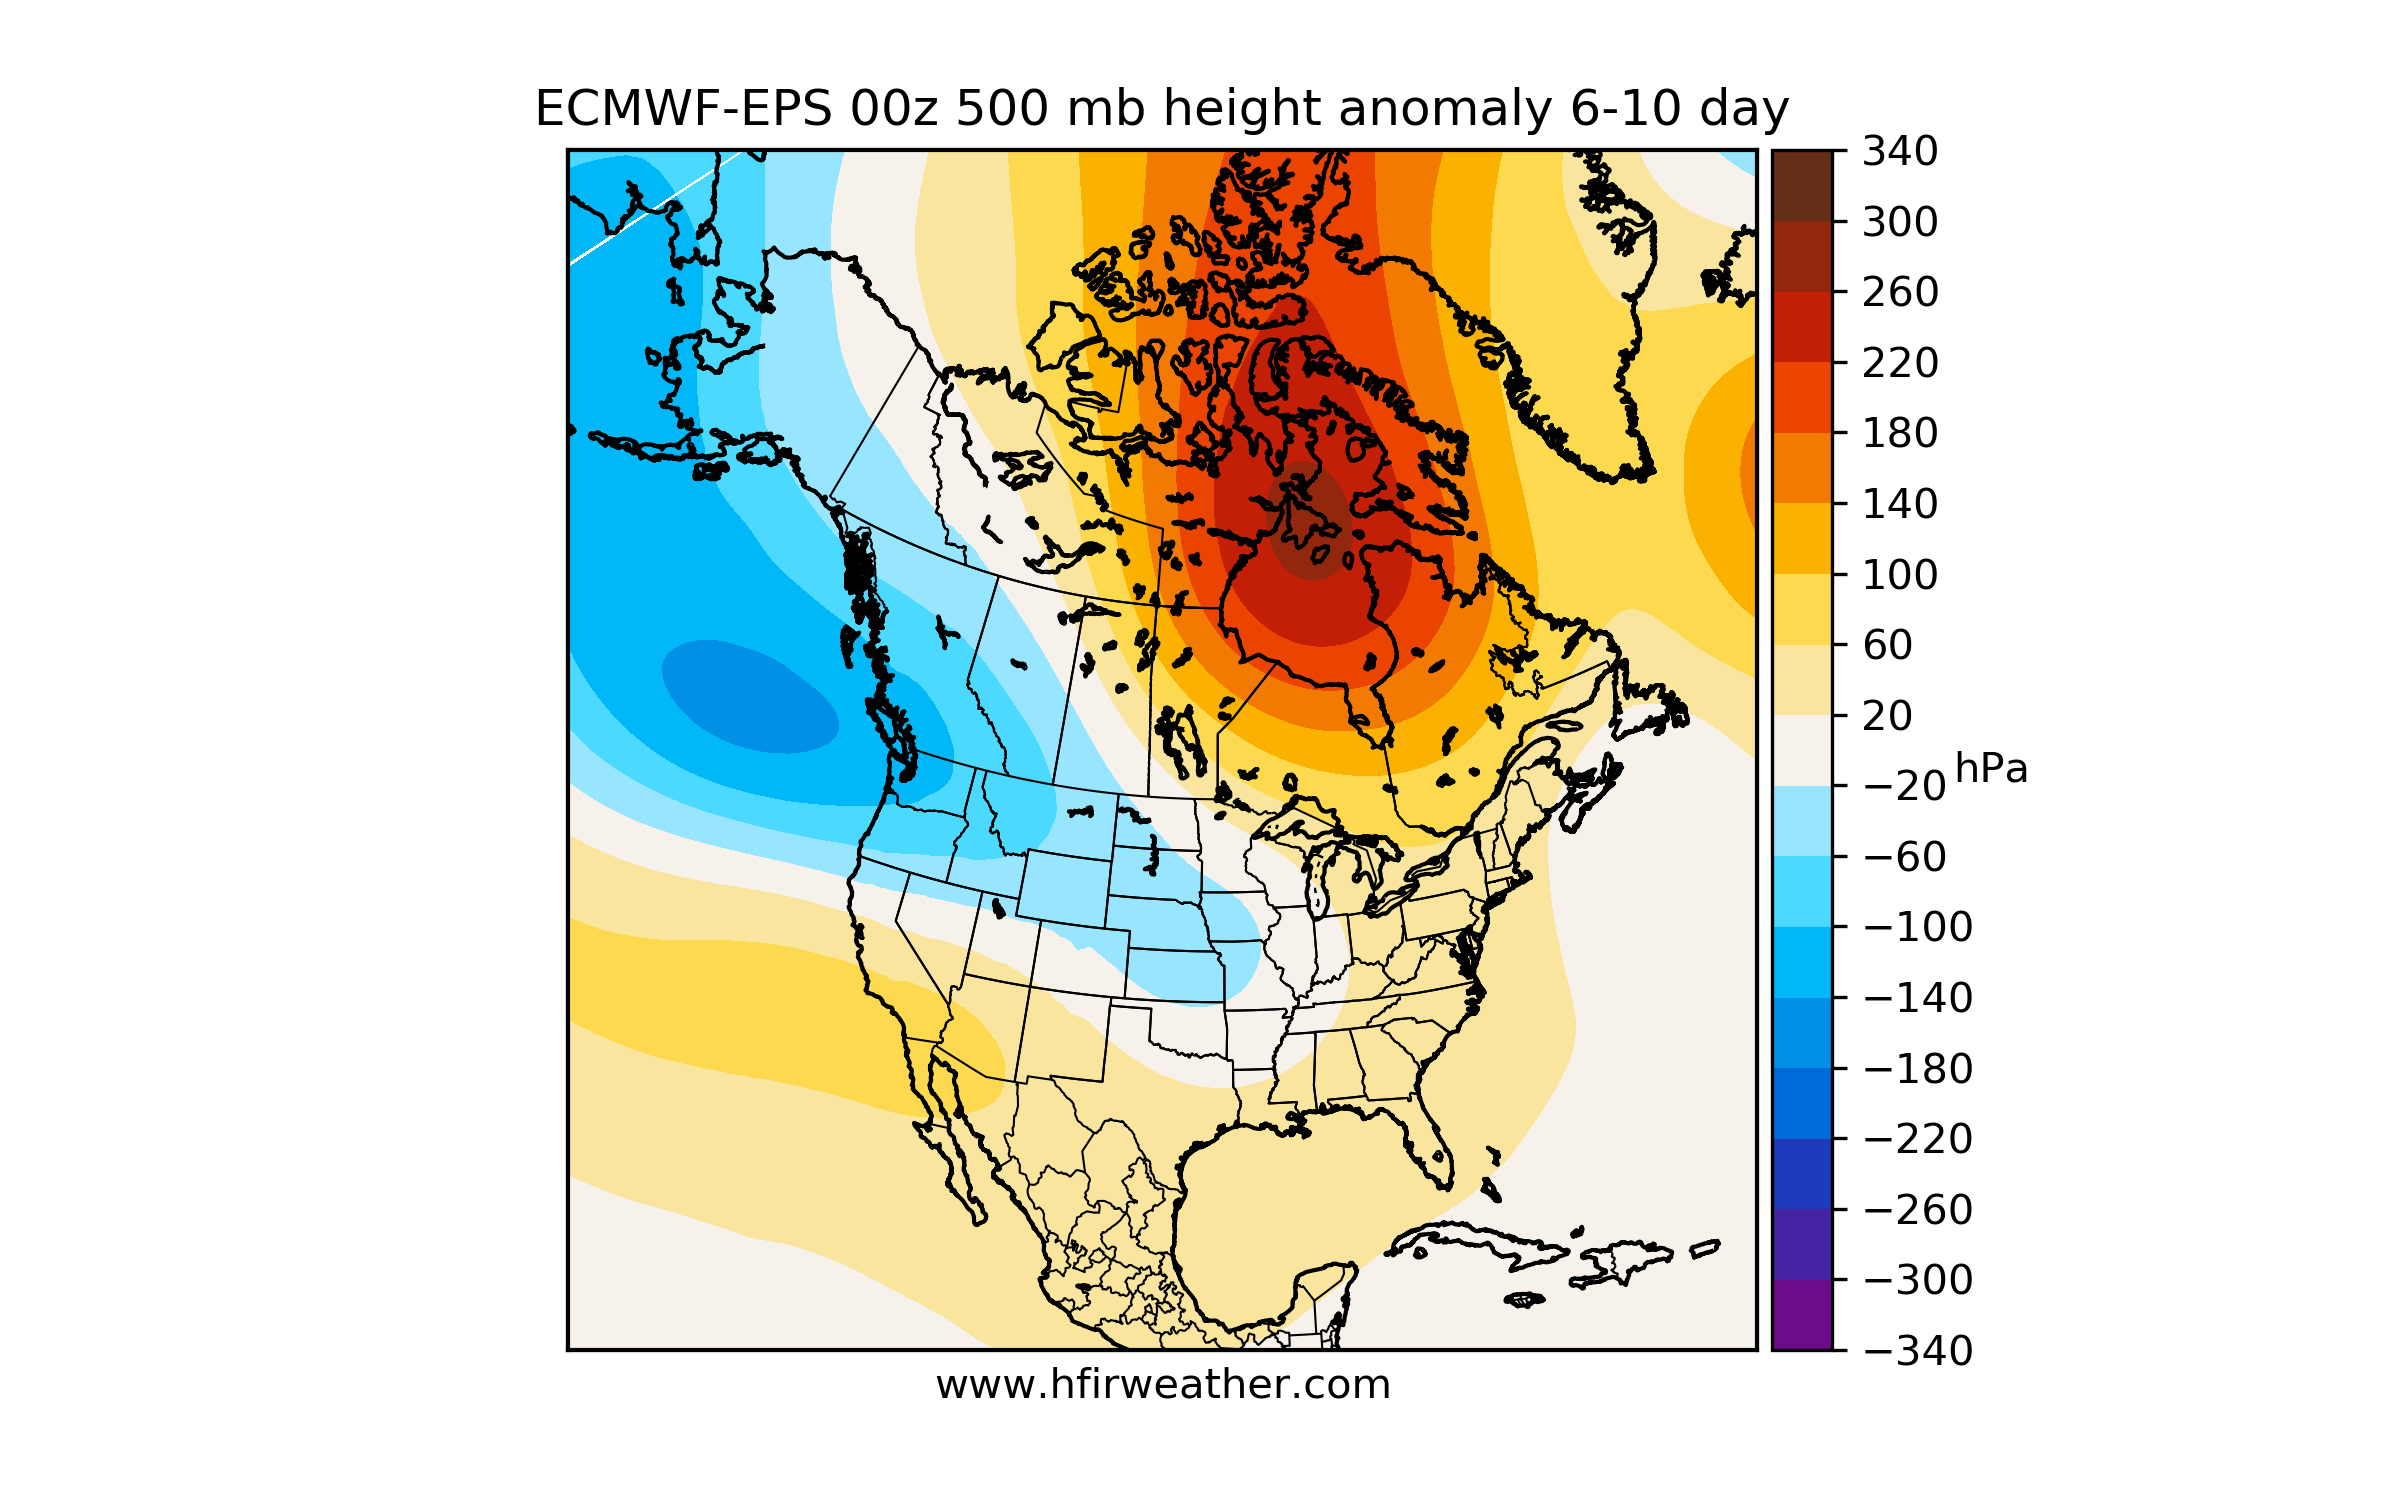
ECMWF-EPS TDD Chart
6-10 Day
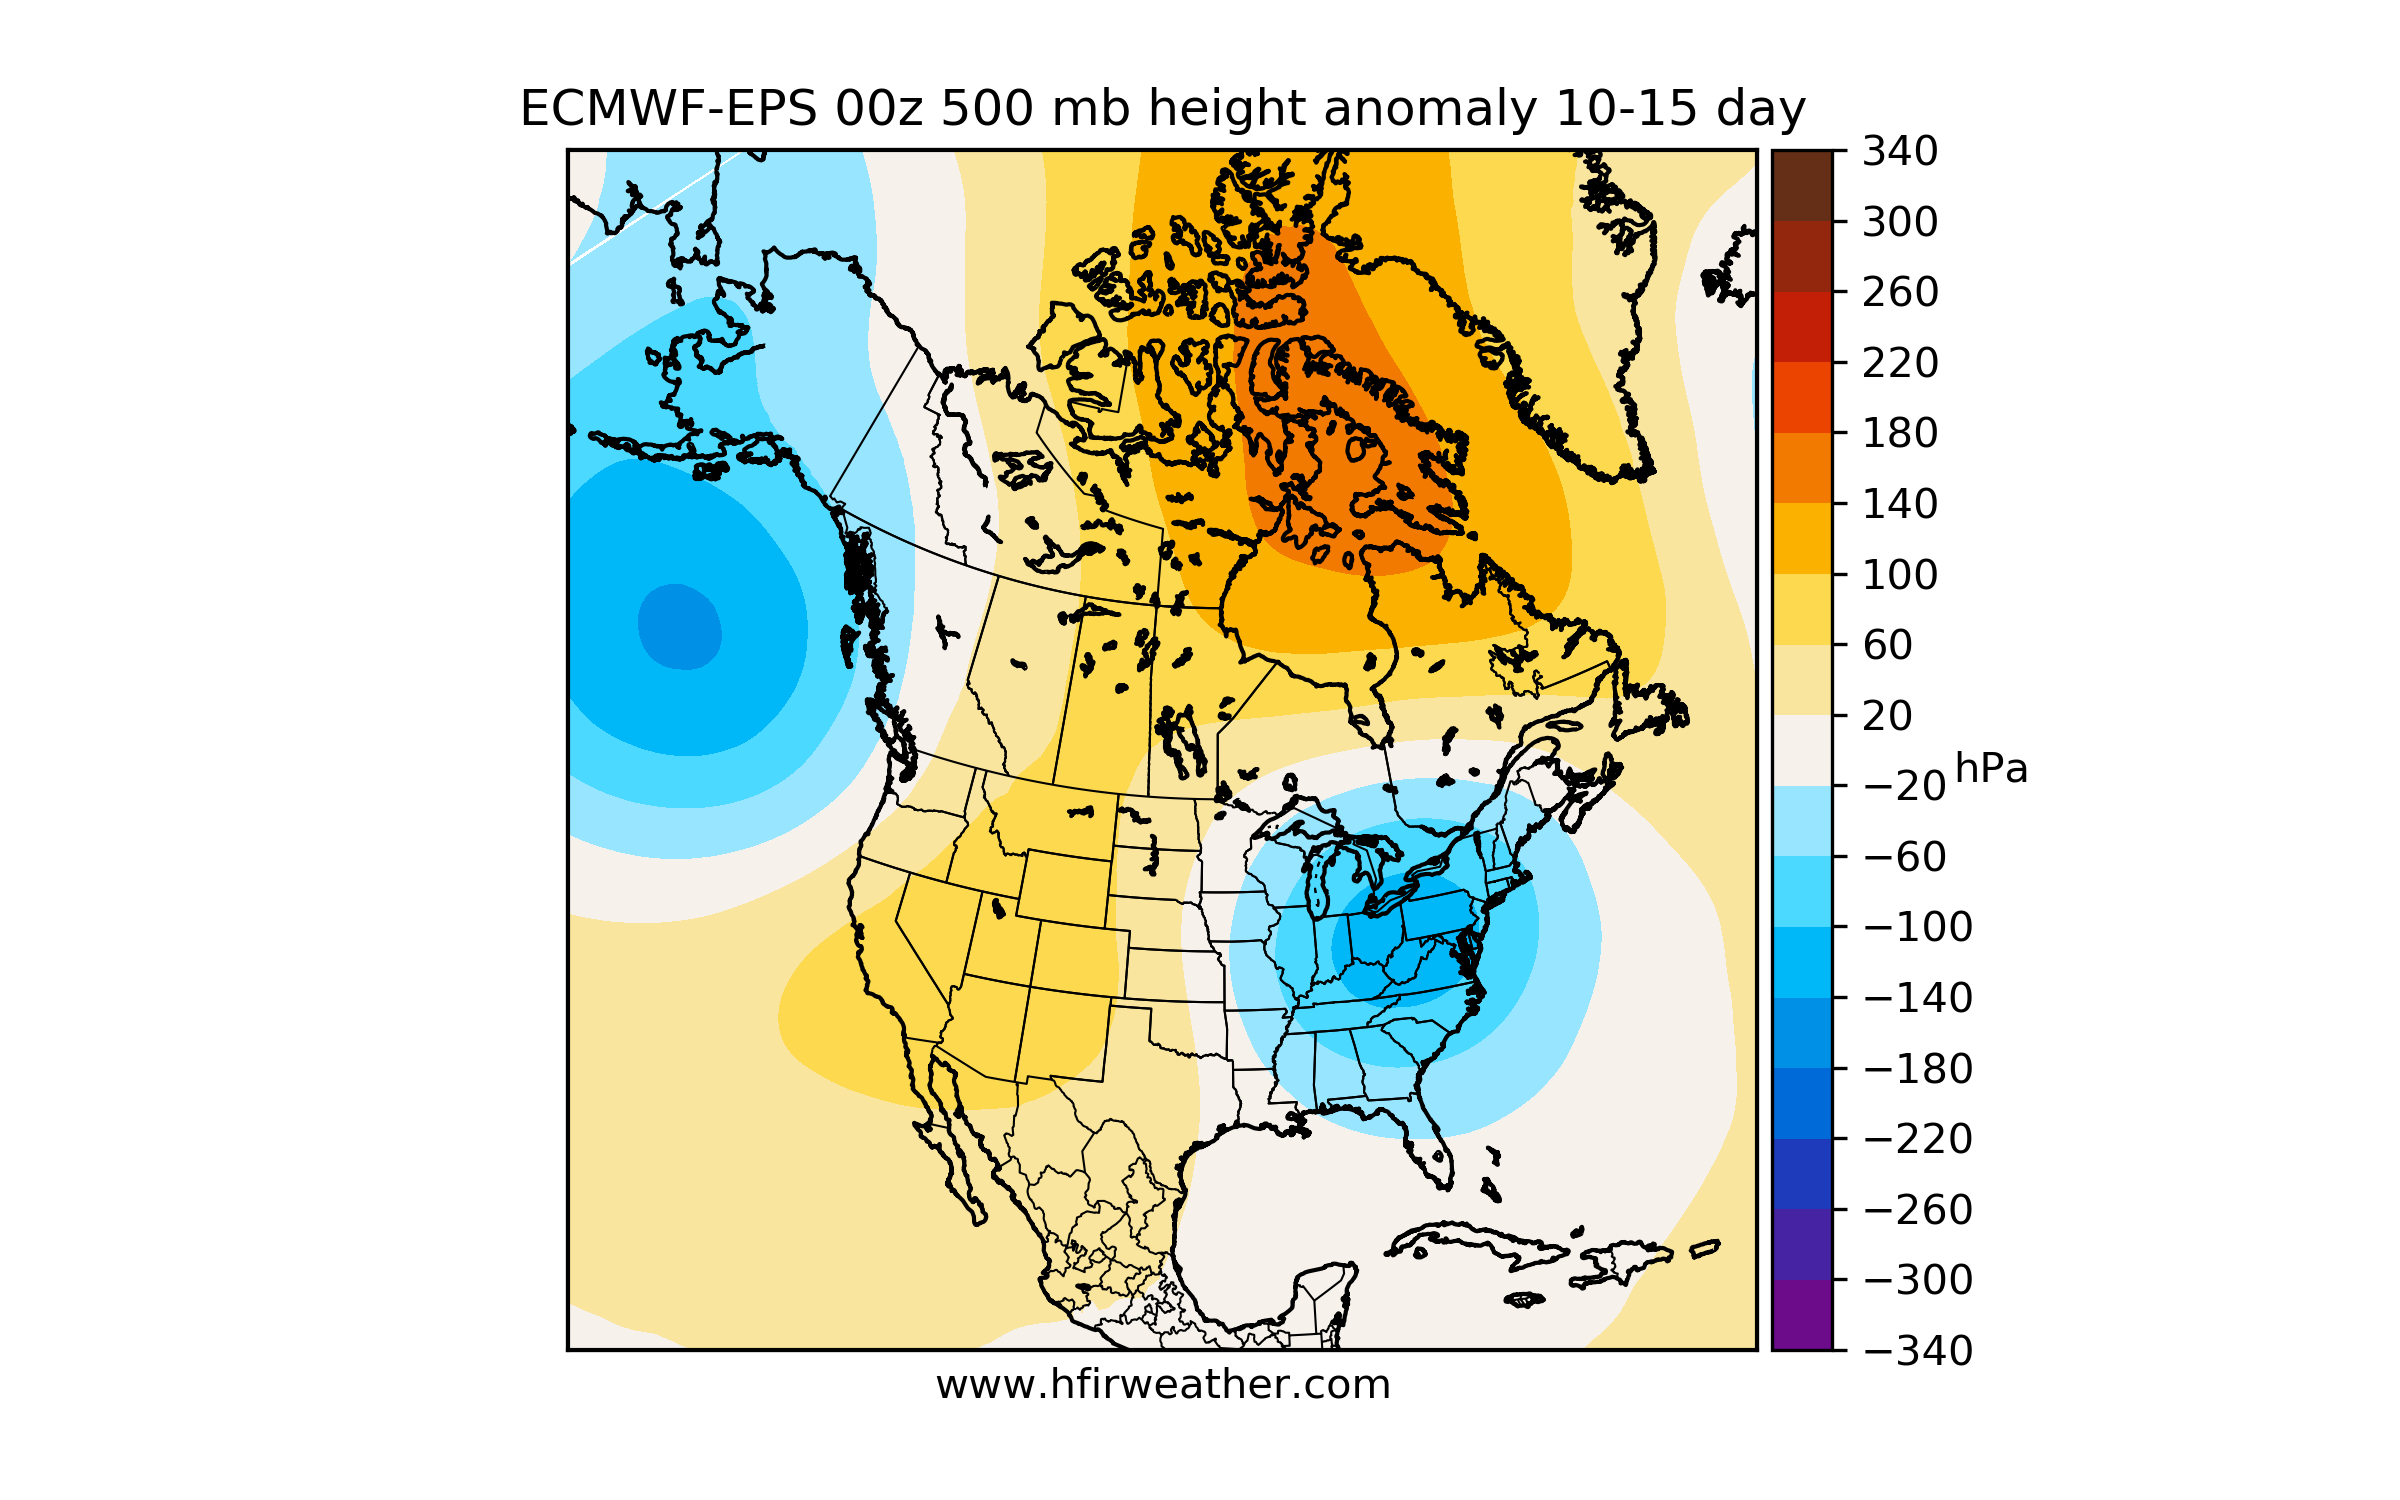
10-15 Day
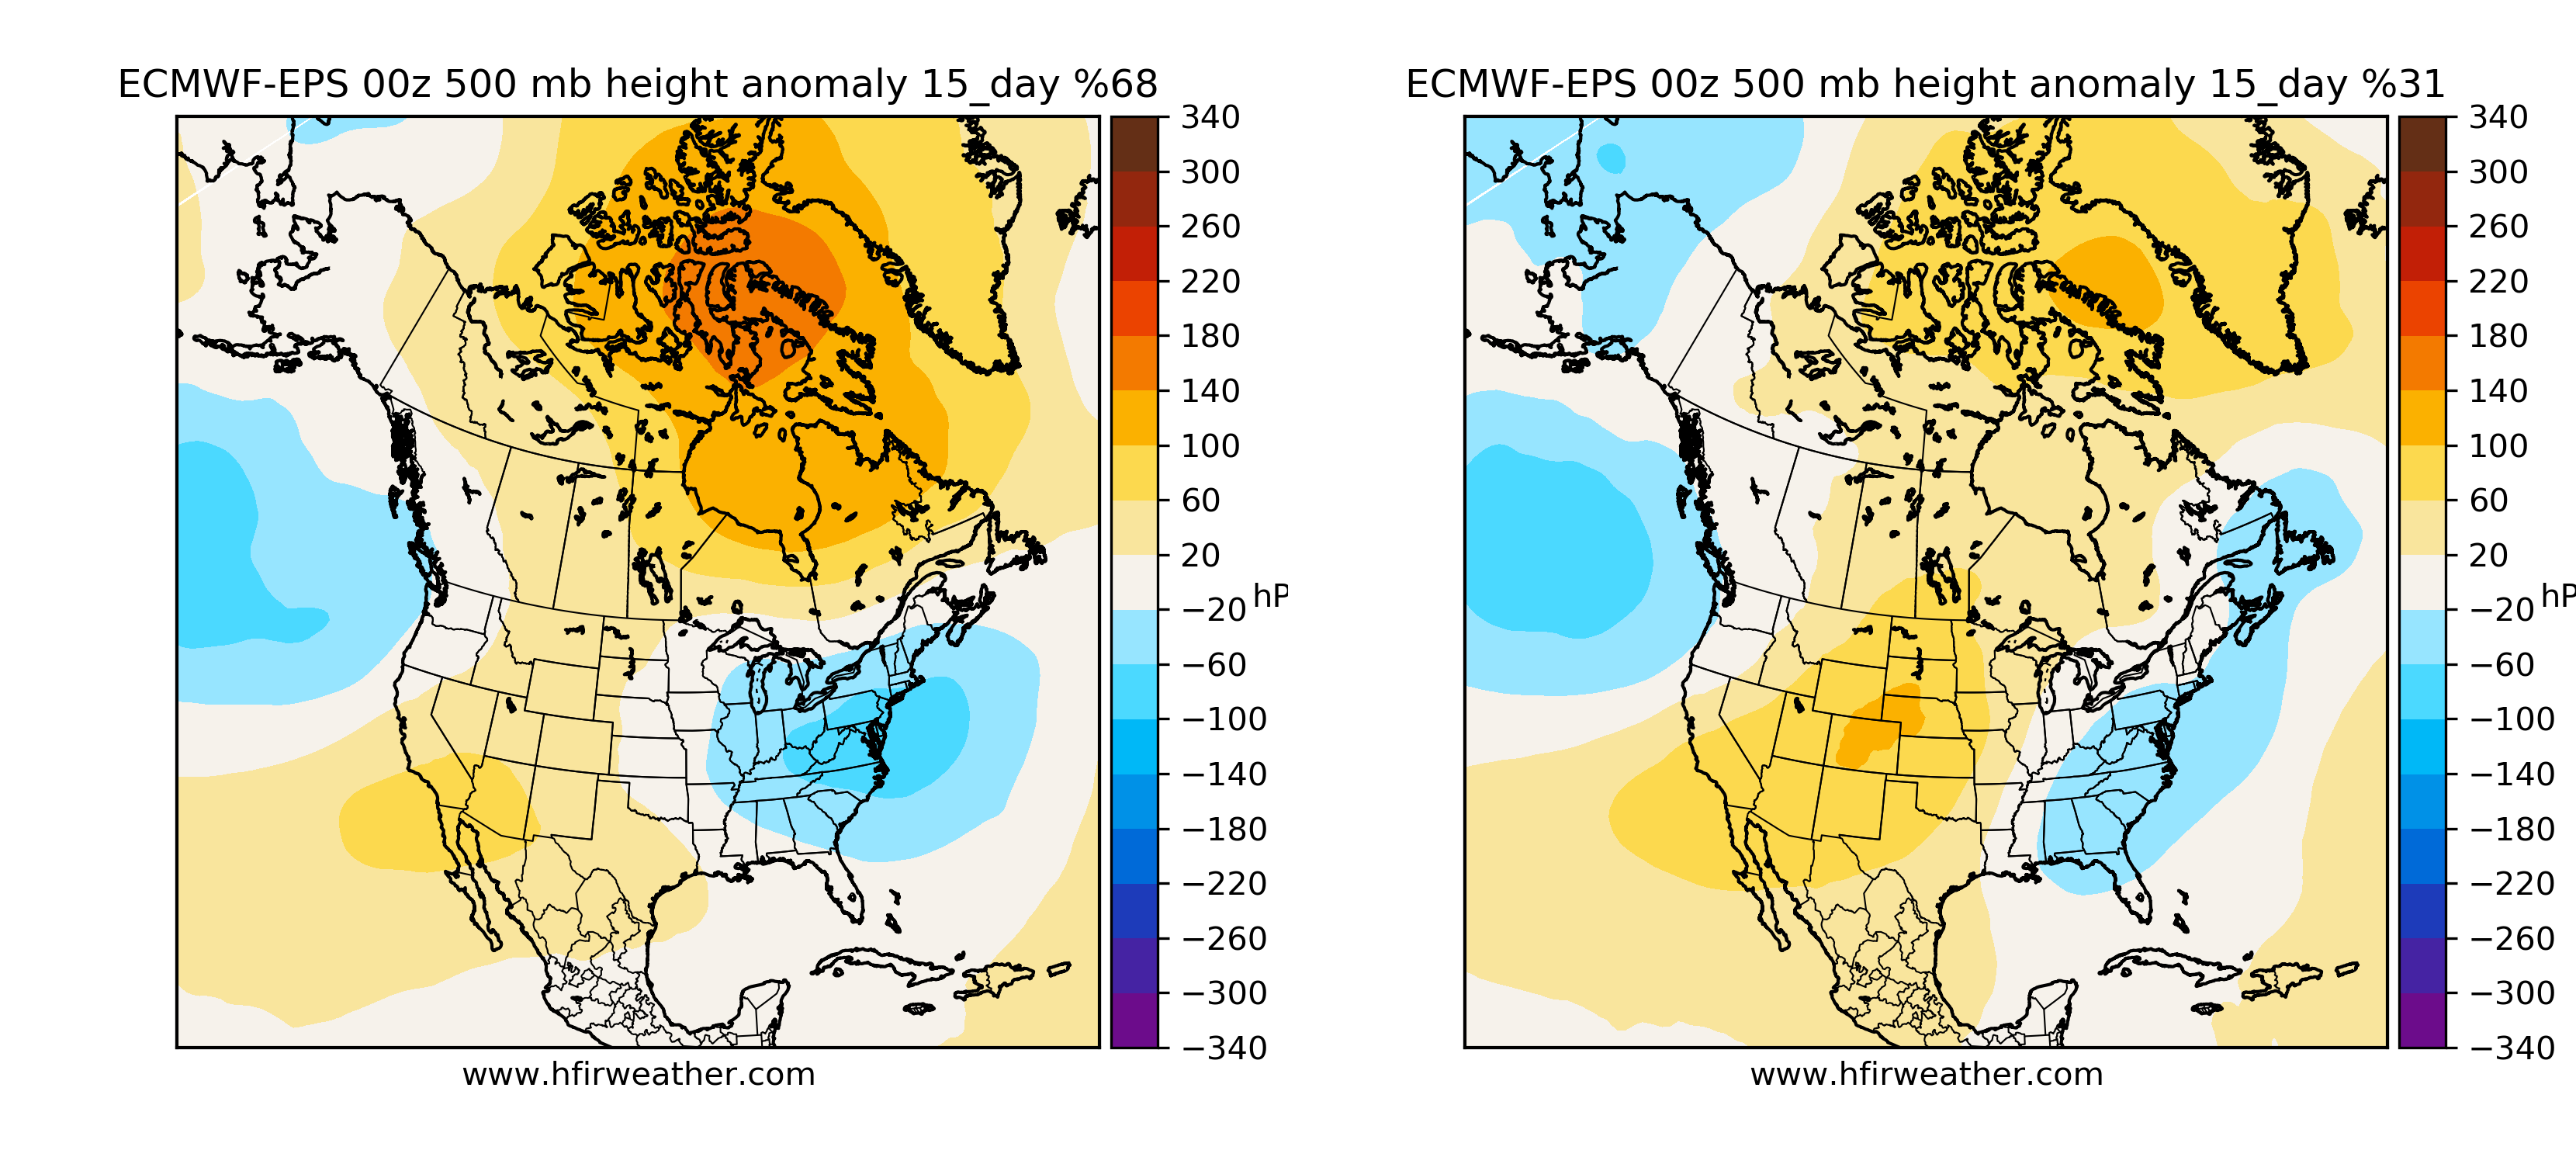
15-Day Cluster
For people who are just starting to read our natural gas storage reports, here’s a dummy 101 guide to how to read the weather model maps.
East Coast = Blue = Bullish (colder-than-normal, higher heating demand)
East Coast = Orange/Red = Bearish (warmer-than-normal, lower heating demand)
Alaska = Blue = Bearish (higher odds the East coast is warmer-than-normal)
Alaska = Orange/Red = Bullish (higher odds the East coast is colder-than-normal)
Obviously, I’m oversimplifing it, but you get the gest. In general, East coast weather forecast during the winter is all that matters. Most of the population-weighted heating demand is there, so any meaningful changes to the weather on the East coast will impact natural gas the most.
As you can see in the weather maps above, the East coast is showing colder-than-normal weather in the East in the 10-15 day chart. This will indicate an early start to heating demand. The chart, however, does not give us a lot of confidence as the Alaska pattern shows a trough (blue pattern). This usually implies that the cold won’t be sustained.
The market favors more sustained colder-than-normal patterns over anything else. As a result, readers should expect a lot of volatility this week on the weather models.
So as we head into the winter gas trading season, the storage surplus will prevent some upside until that surplus is eliminated. Since winter heating demand sensitivity is exponentially higher than power burn demand sensitivity over the summer, the ~120 Bcf can be easily eliminated from 1-week of colder-than-normal weather.
If we get that in November, you can expect natural gas prices to quickly retest $3.75/MMBtu (Nov contracts).