

Don’t get me started. Natural gas, the widowmaker, is back to haunting my soul again. After initiating a small long BOIL position ($100k) at $18.88, we were stopped out for an 11% loss on Friday at $16.88. Weather models looked destined for doom as we head into the weekend. February Henry Hub contracts reached a low of $3.13/MMBtu before reversing higher today to $3.36/MMBtu.
What caused this manic depressant like move?
And here’s the latest ECMWF-EPS TDD chart:
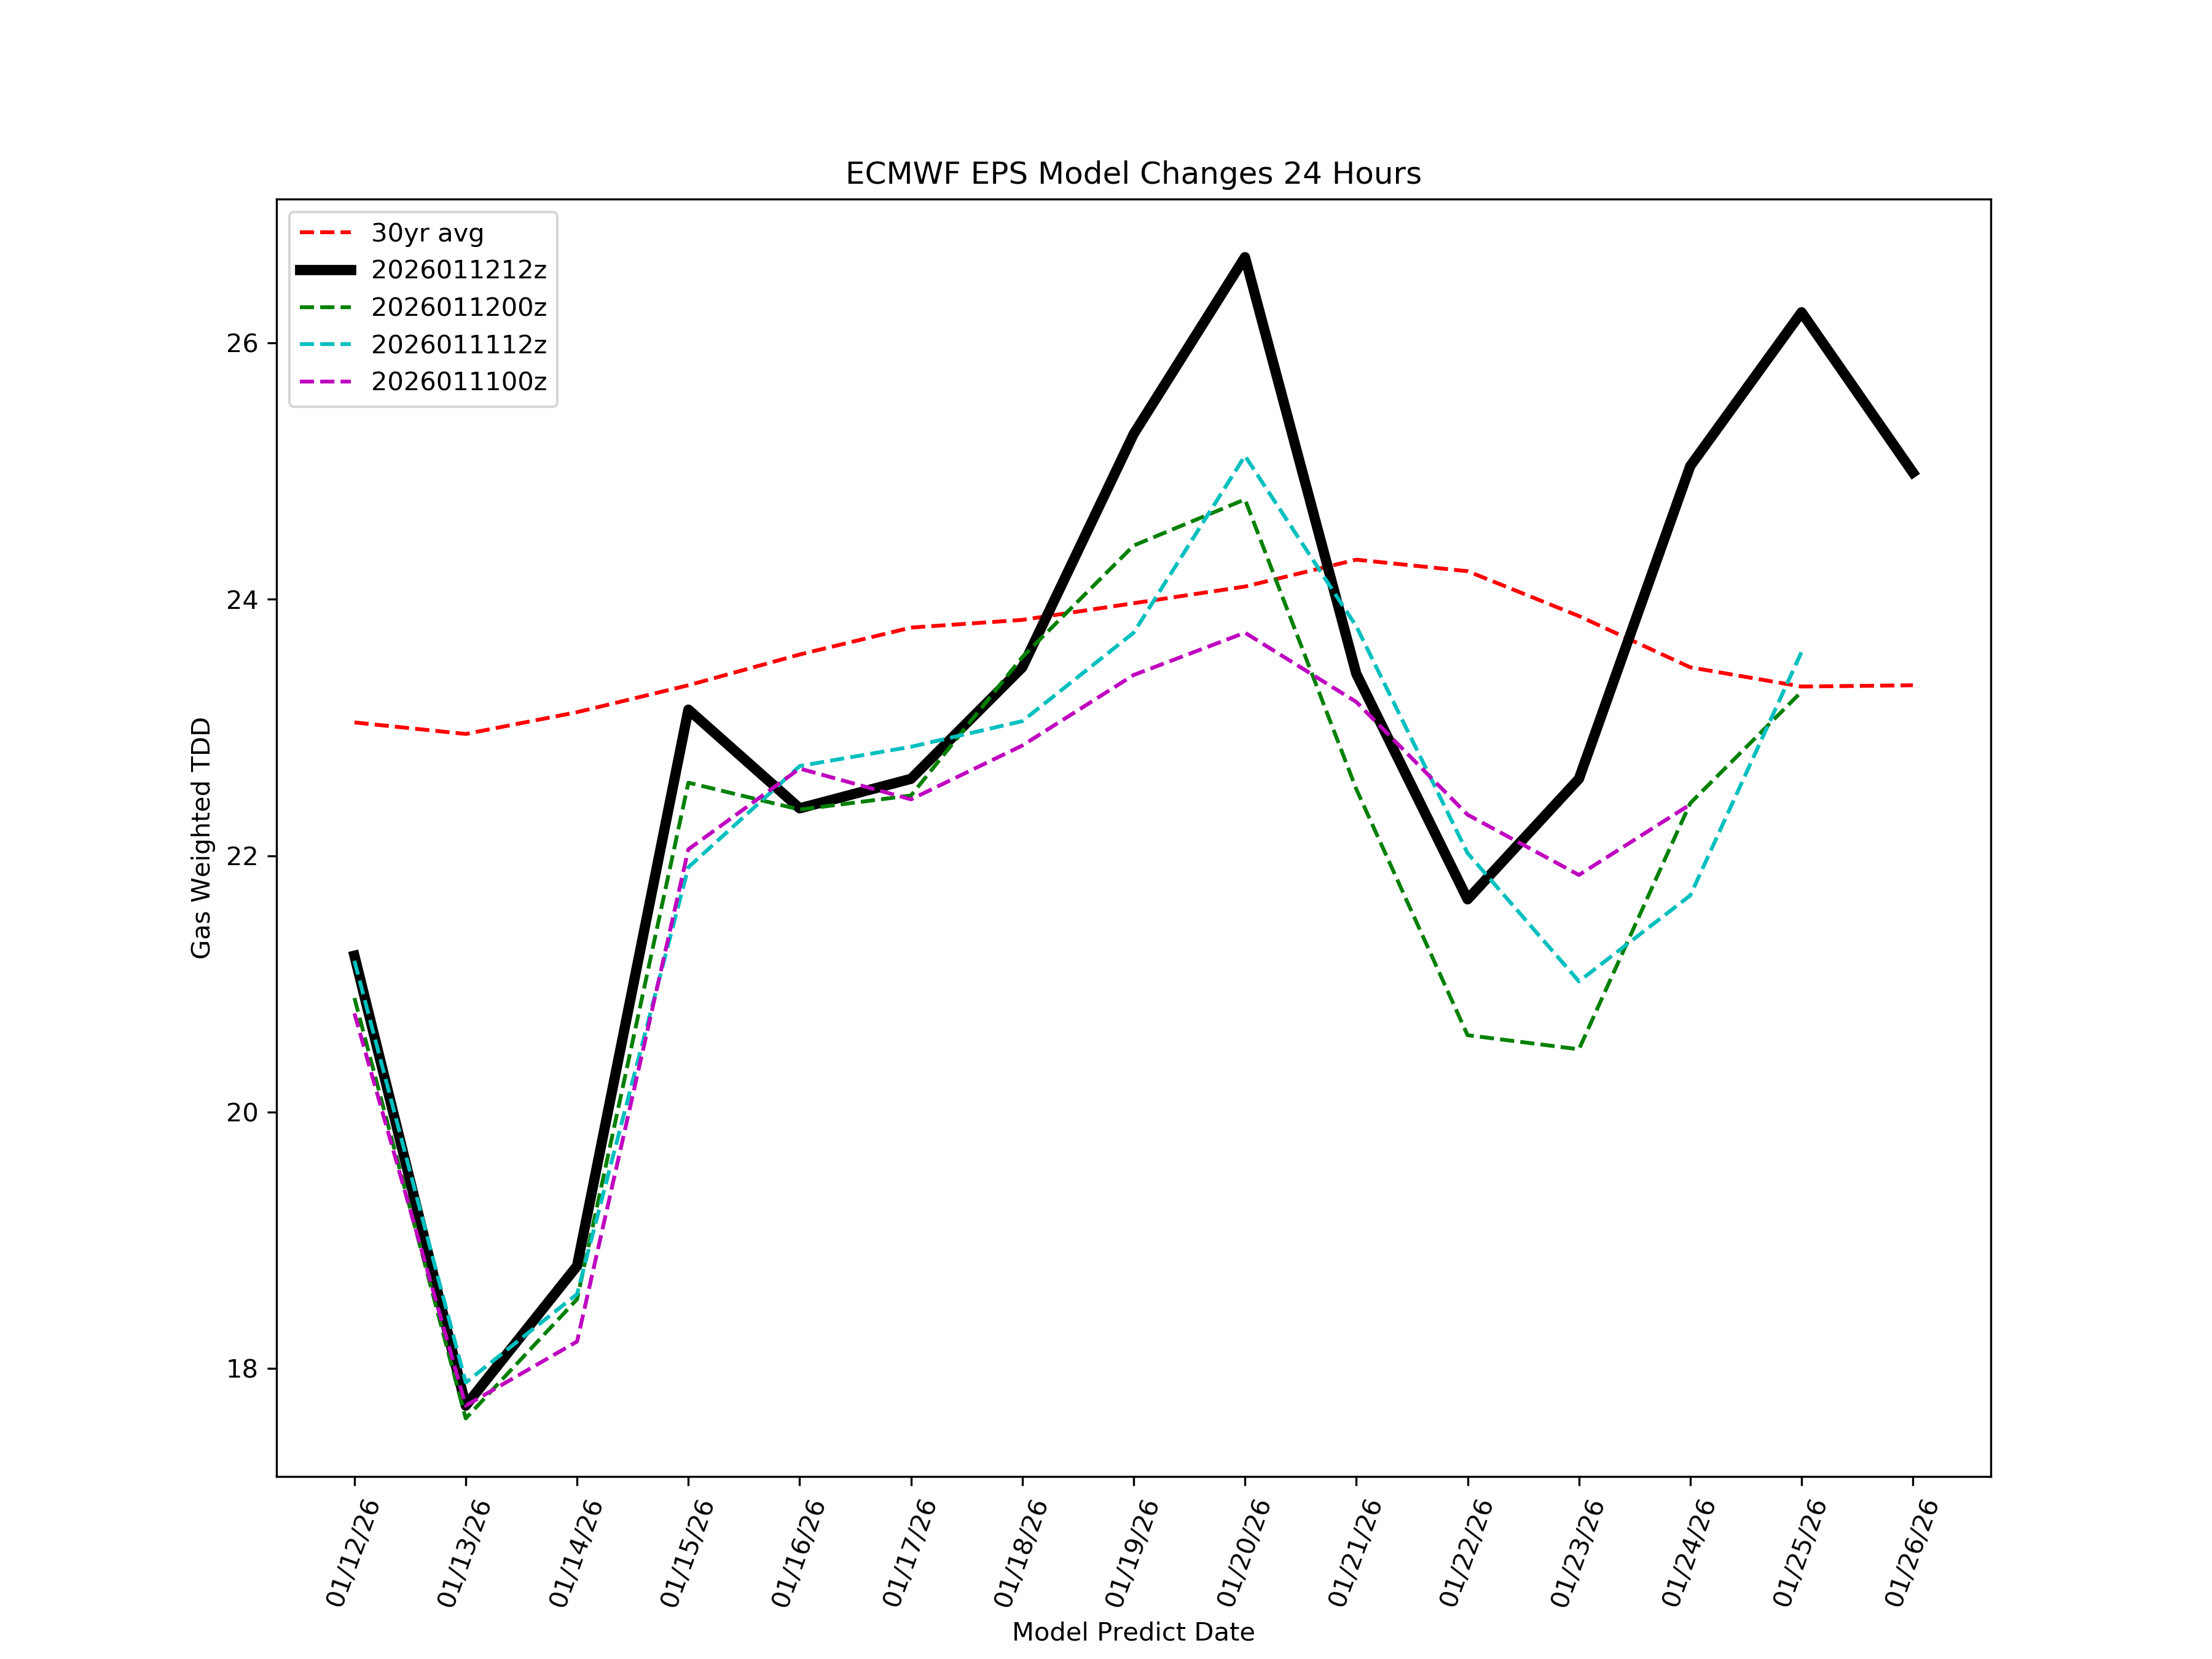
According to the latest update, ECMWF-EPS gained some ~43 HDDs since last Friday. In terms of natural gas storage, the gains in heating demand increased storage withdrawals by ~200 Bcf. By our estimate, if the bullish weather were to materialize, then we would need to see heating degree days ramp further.
So if you are wondering why natural gas prices aren’t moving higher just yet, it’s for that very reason. The market is still waiting for the patterns to translate to heating demand, so until then, we are all just waiting patiently while the yo-yo is playing out.
Weather: that’s winter natural gas trading in a nutshell...
Trust me, I don’t like talking about the weather. Natural gas fundamentals should, in theory, dominate, but because heating demand is such a large part of the demand mix, not talking about weather is like not talking about the score in sports. At the end of the day, how much heating demand materializes is how much natural gas prices will move up or down.
In the case of the current set-up, the bulls can rejoice, but we aren’t completely out of the woods yet. From everything I’m seeing, there’s still a lot of variability in the forecast.
Let’s start with the bullish variables.
Teleconnection: Arctic Oscillation
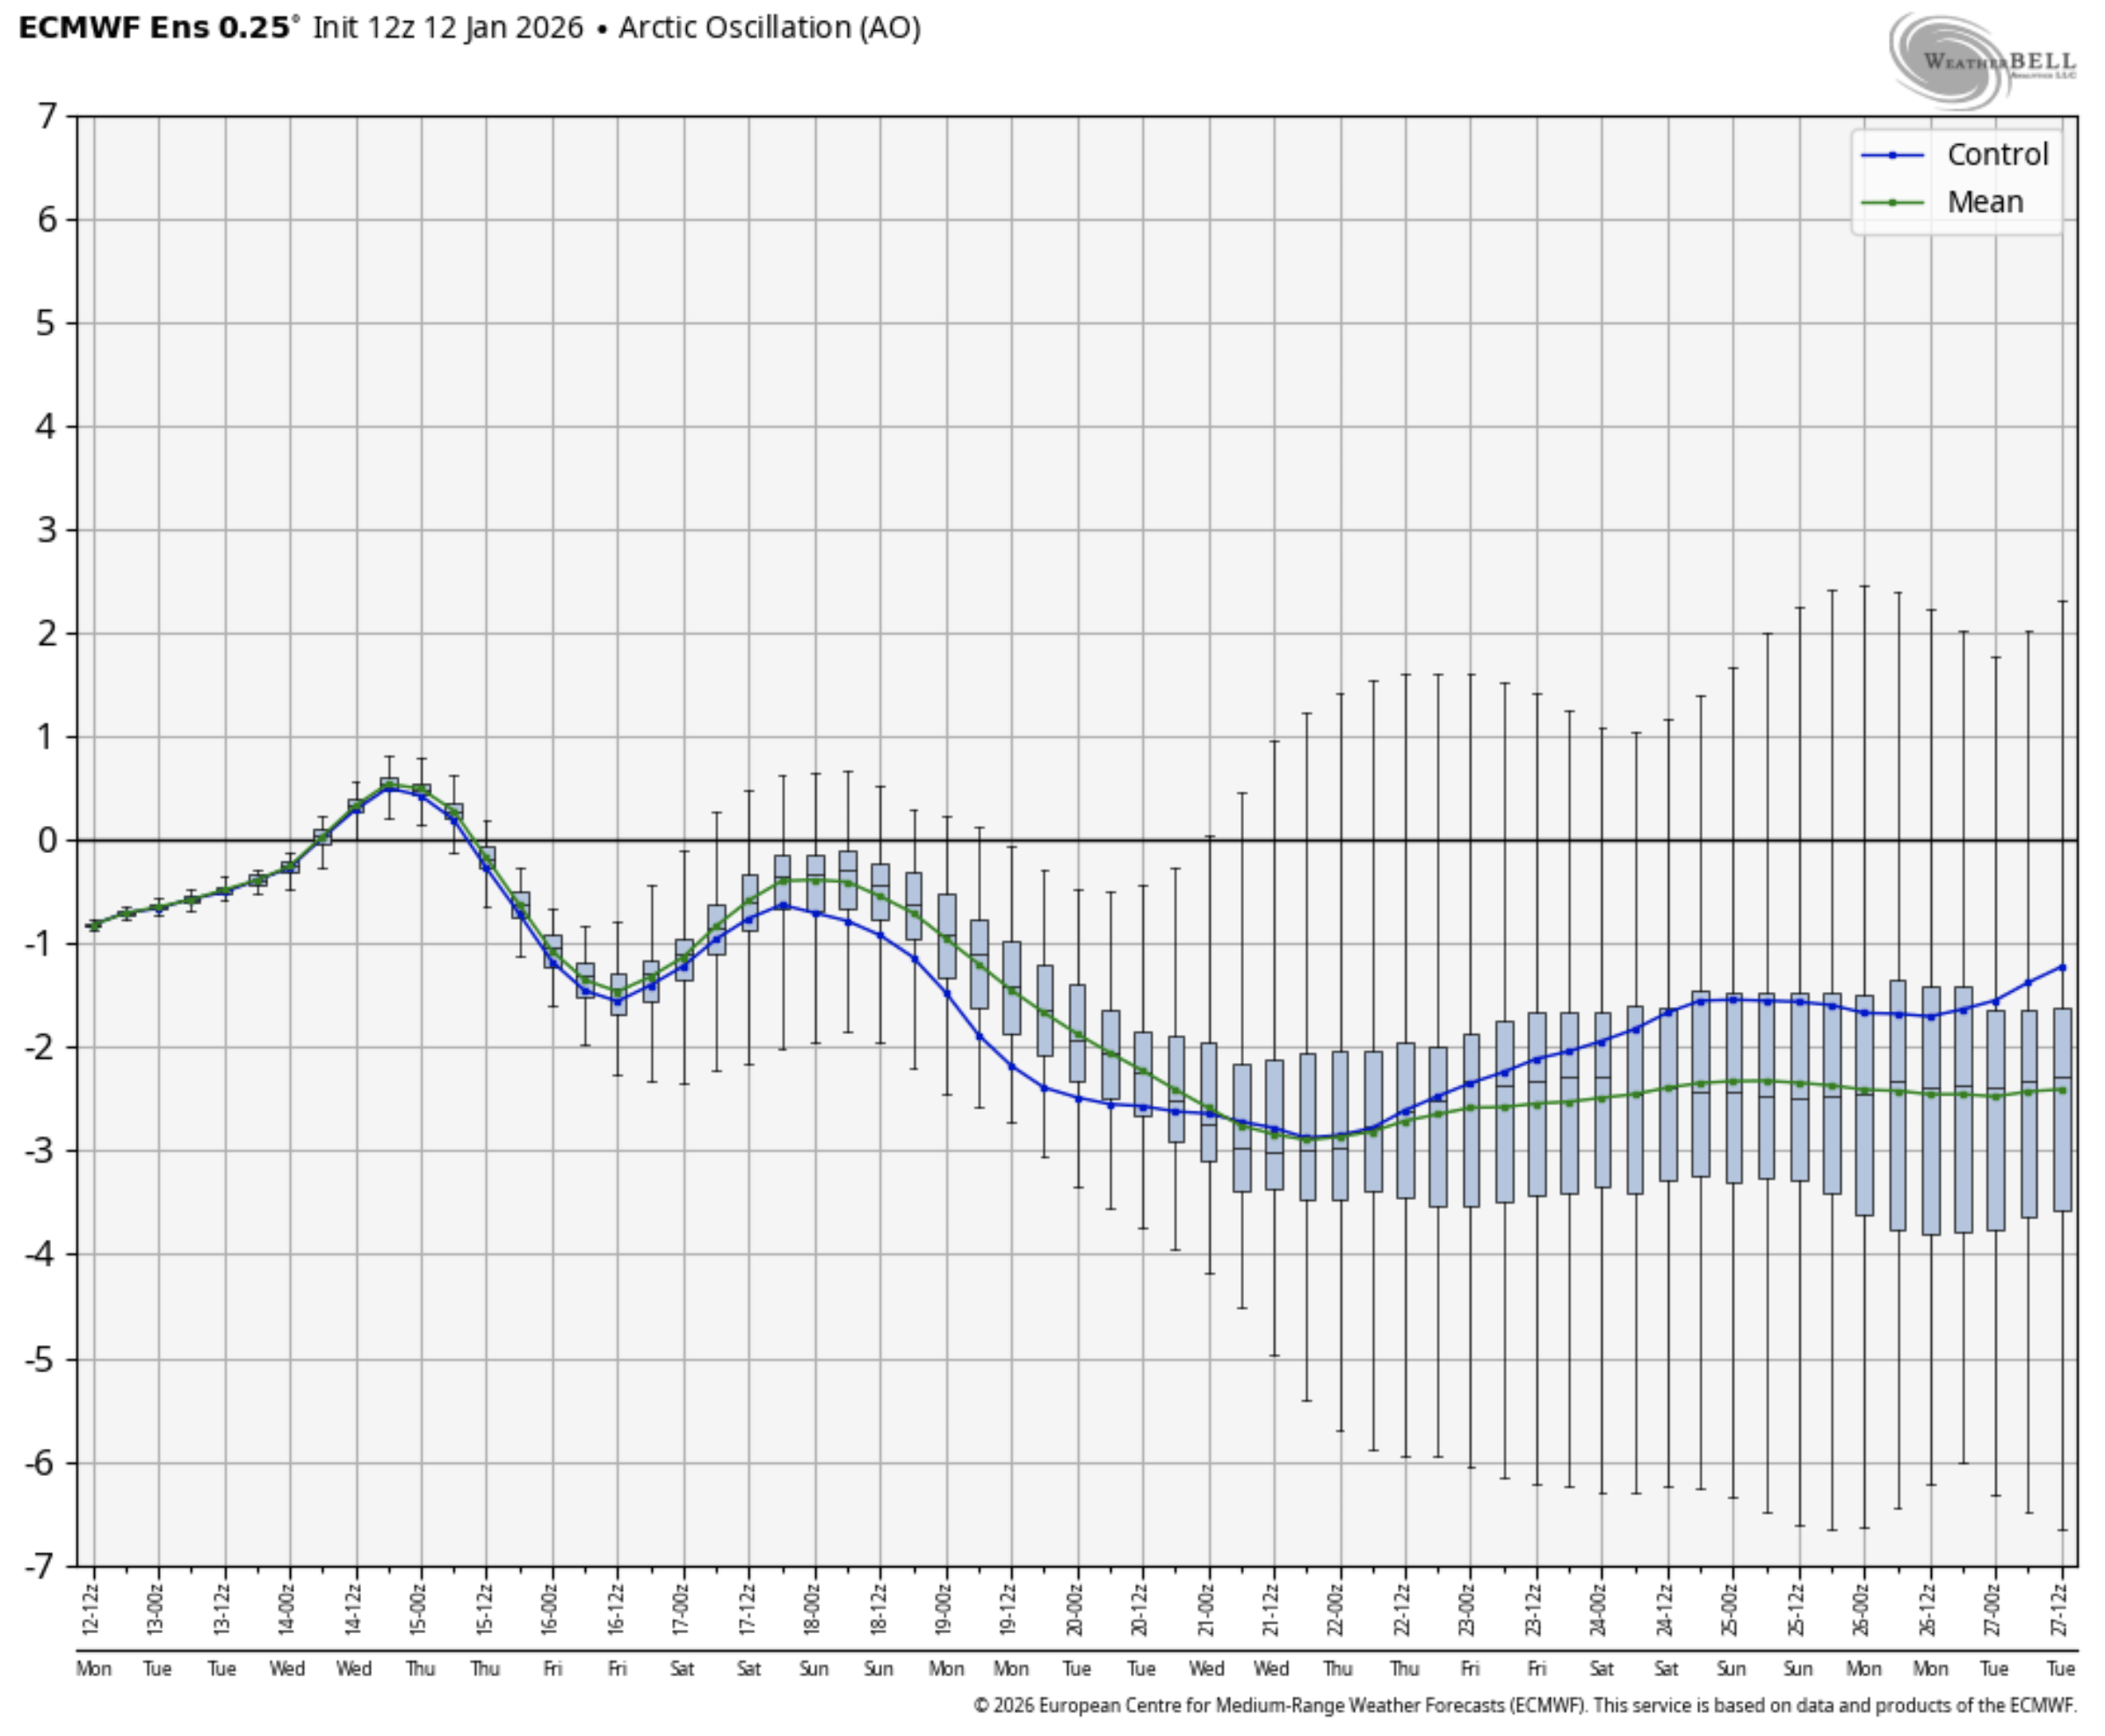
The Arctic Oscillation is trending negative, which is usually a very bullish signal. Here’s the perfect chart to illustrate this:
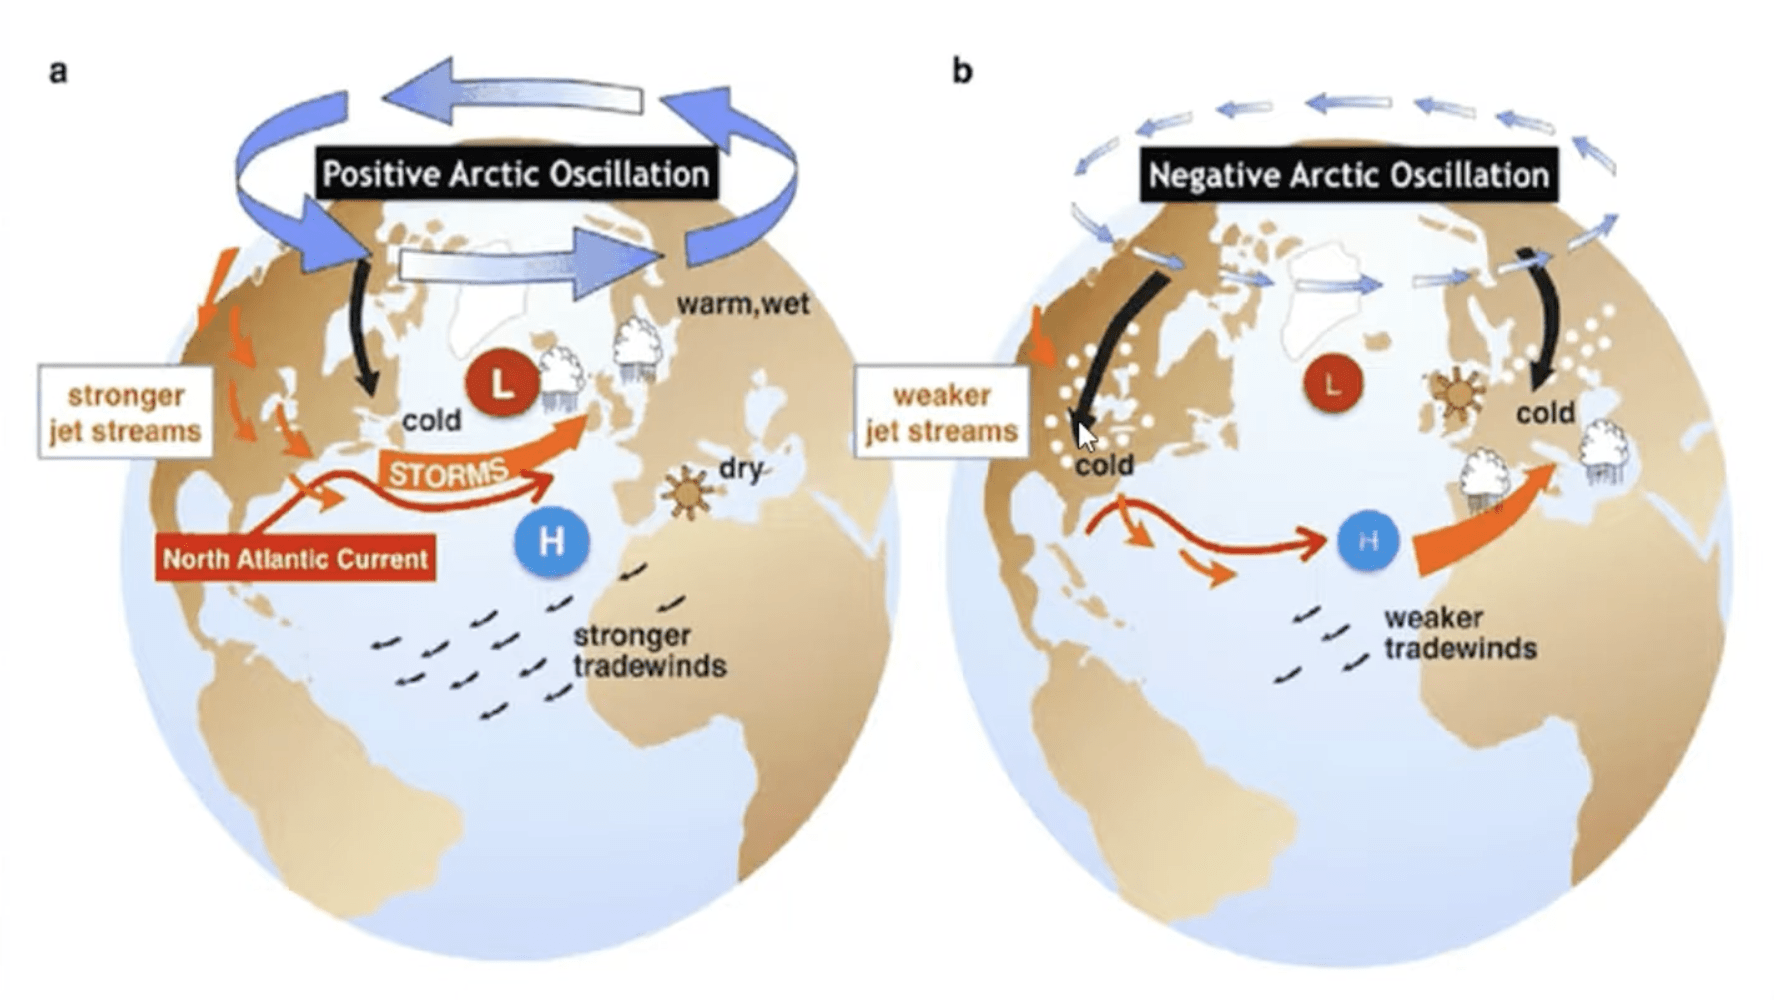
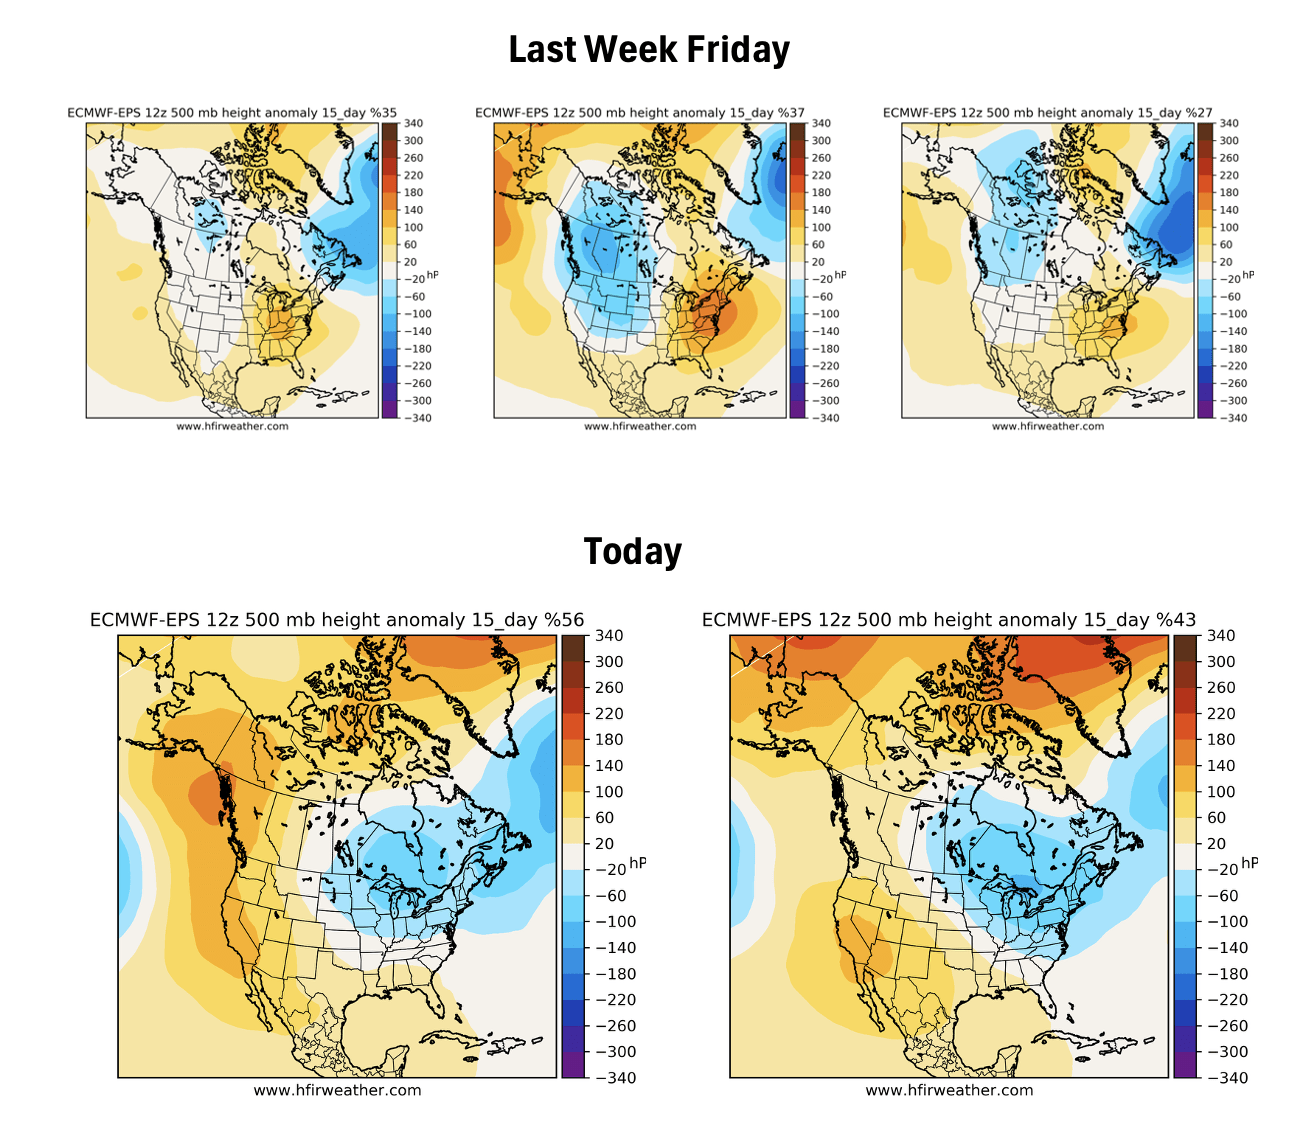
In the above chart, you can see that negative AO translates to the cold being pushed to the Lower 48 (b chart).
This teleconnection signal needs to be paired with other signals.
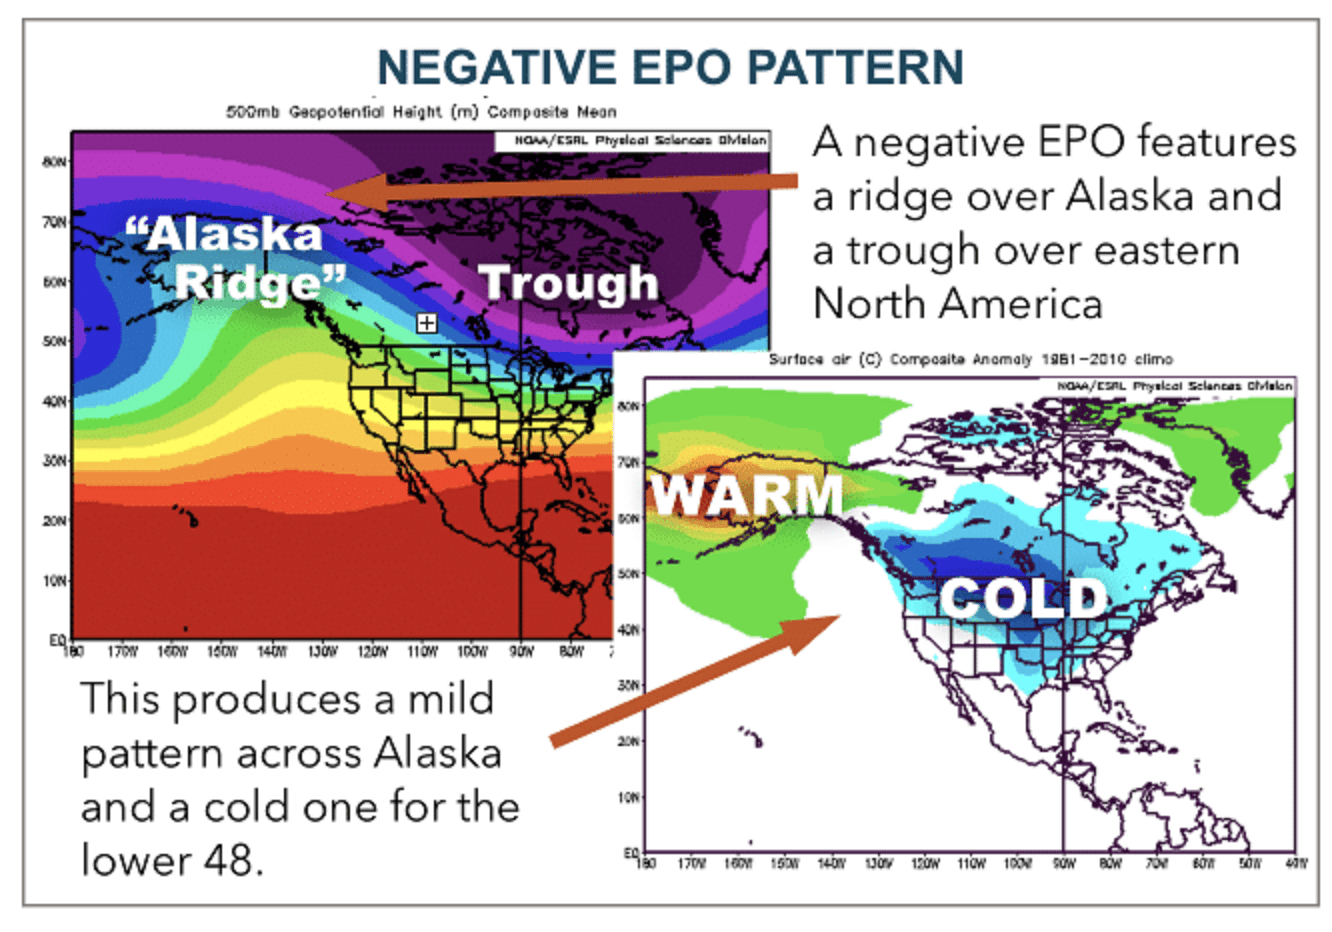
Teleconnection: Eastern Pacific Oscillation
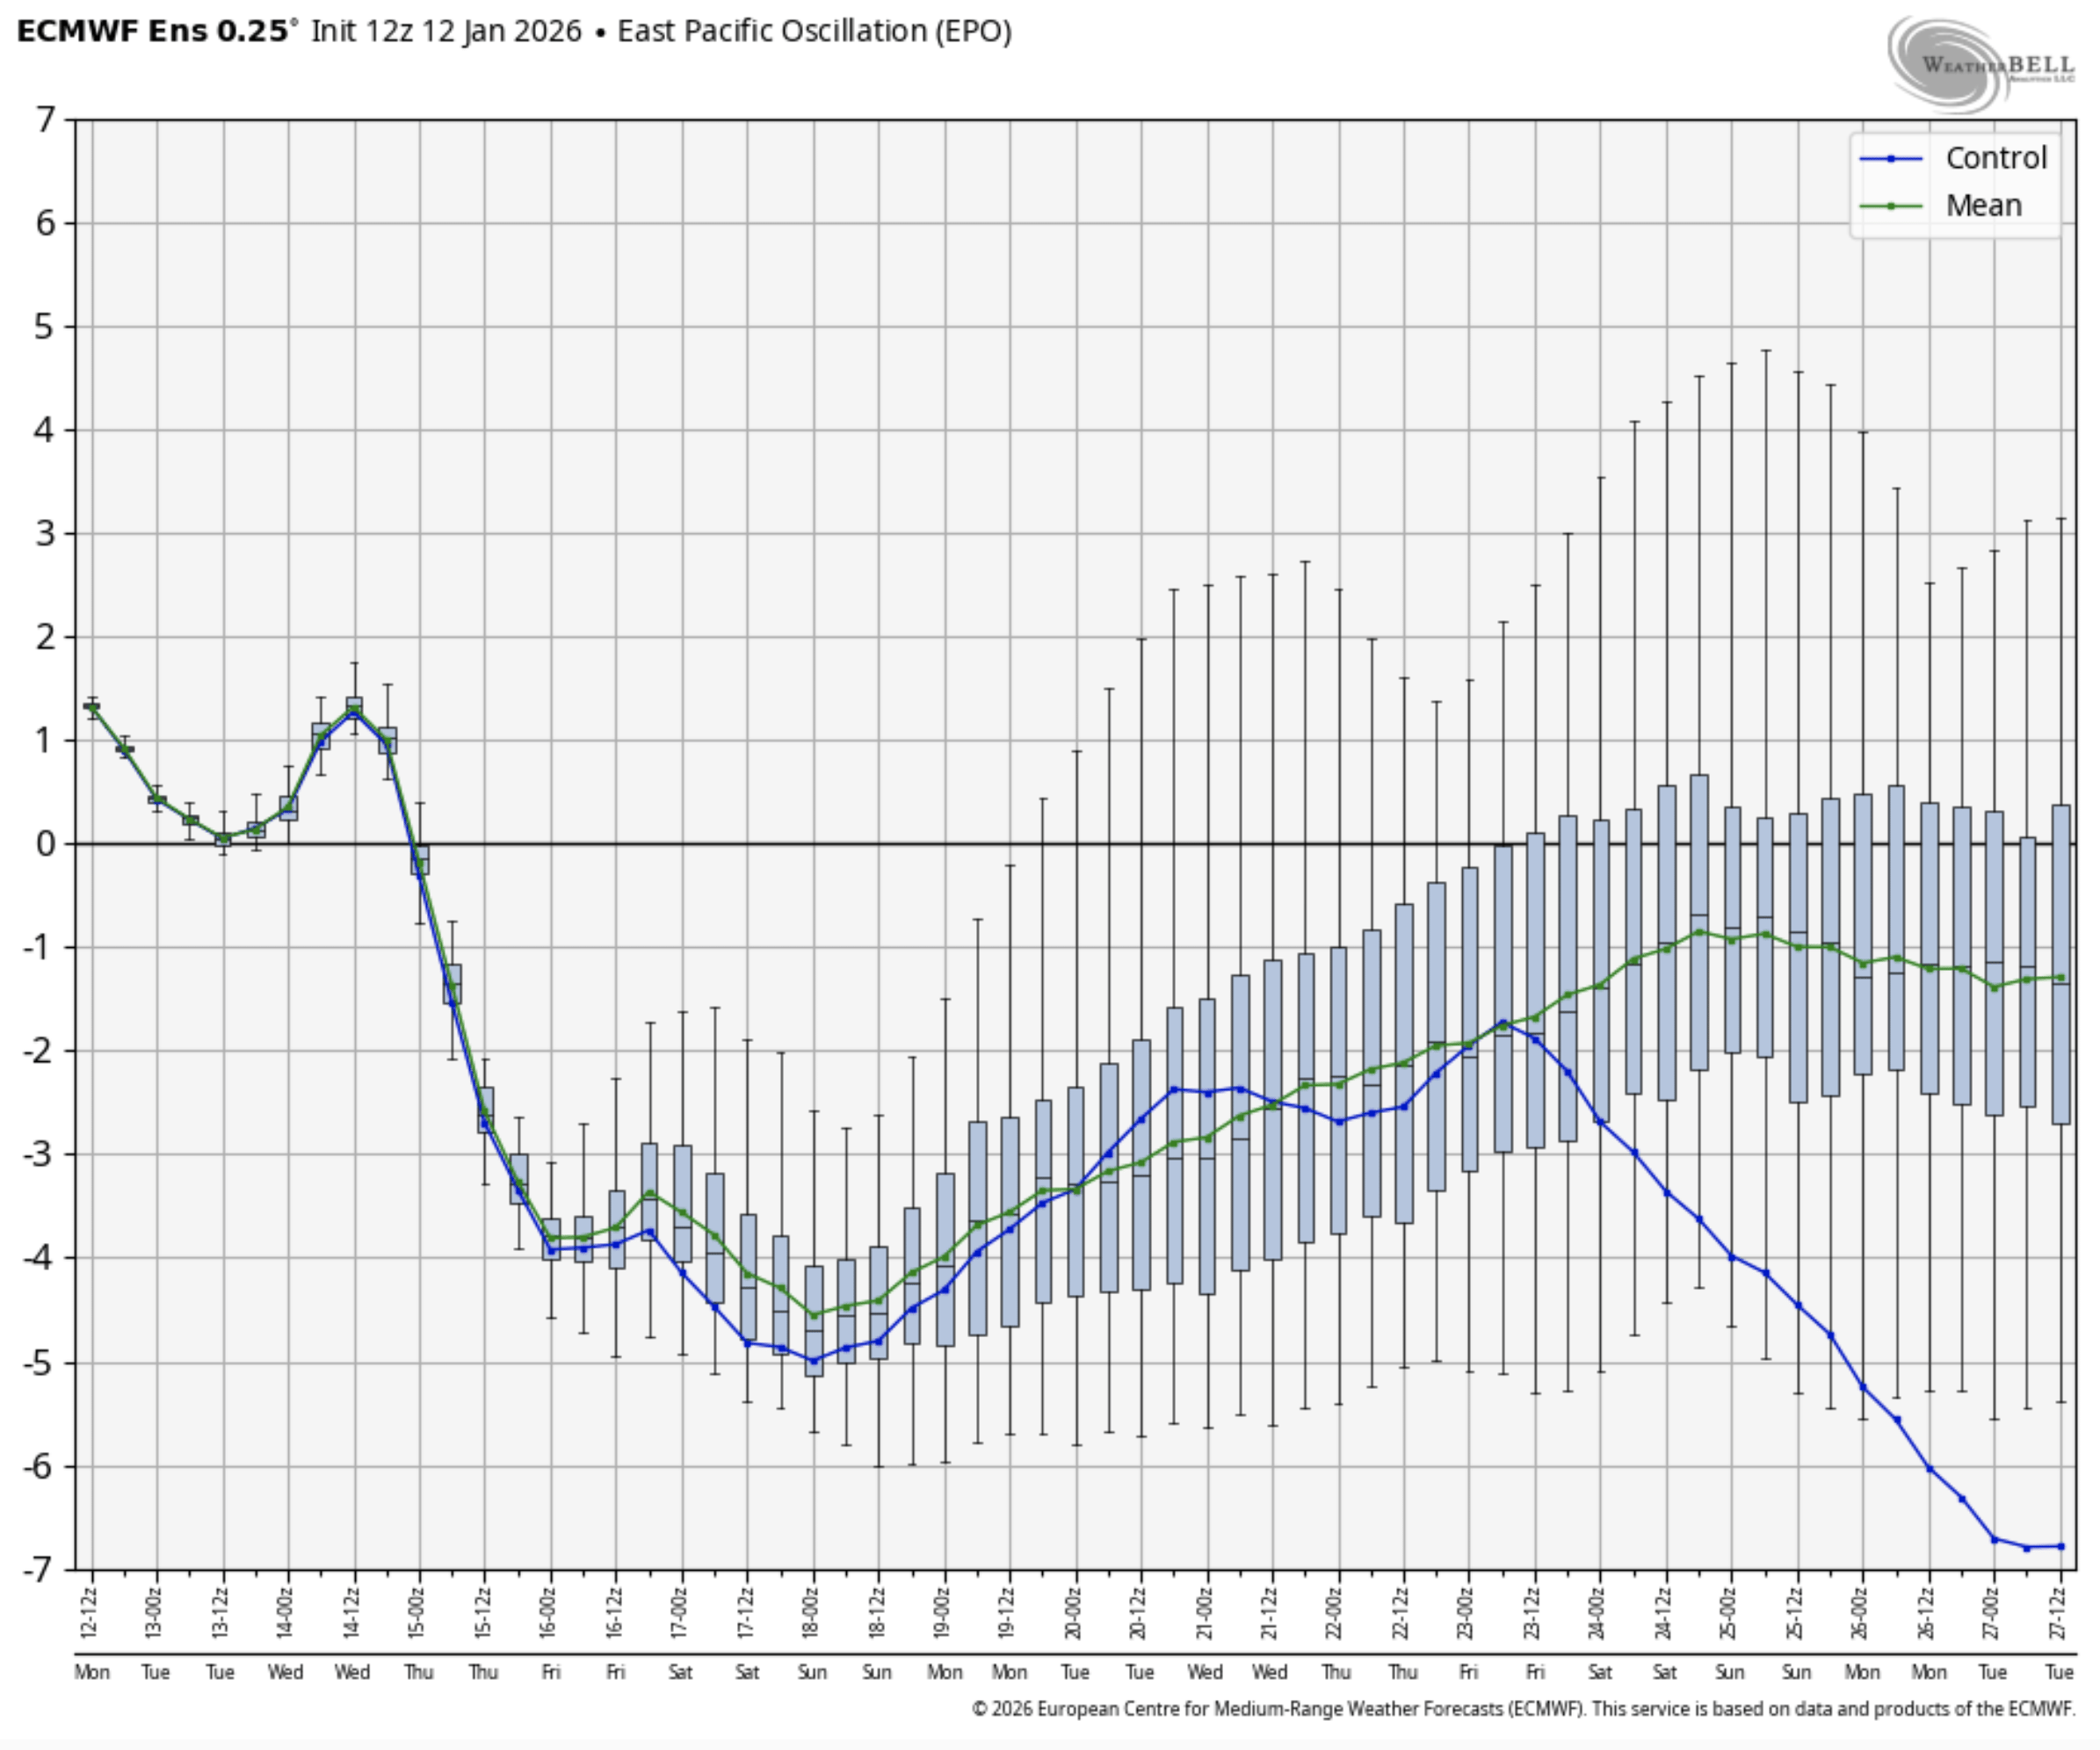
EPO is the famous Alaska pattern. When EPO is negative (like the chart above), it foreshadows colder-than-normal weather in the Lower 48.
Source: DTN
Inversely, a positive EPO foreshadows bearish weather. And as you can see in the teleconnection chart above, the back-end of the models gradually trends back to neutral. The key is for the Alaska ridge (negative EPO) to remain in place throughout the 15-day forecast. The longer this pattern persists, the more bullish the outcome; conversely, the same is also true.
Now for the bearish signals.
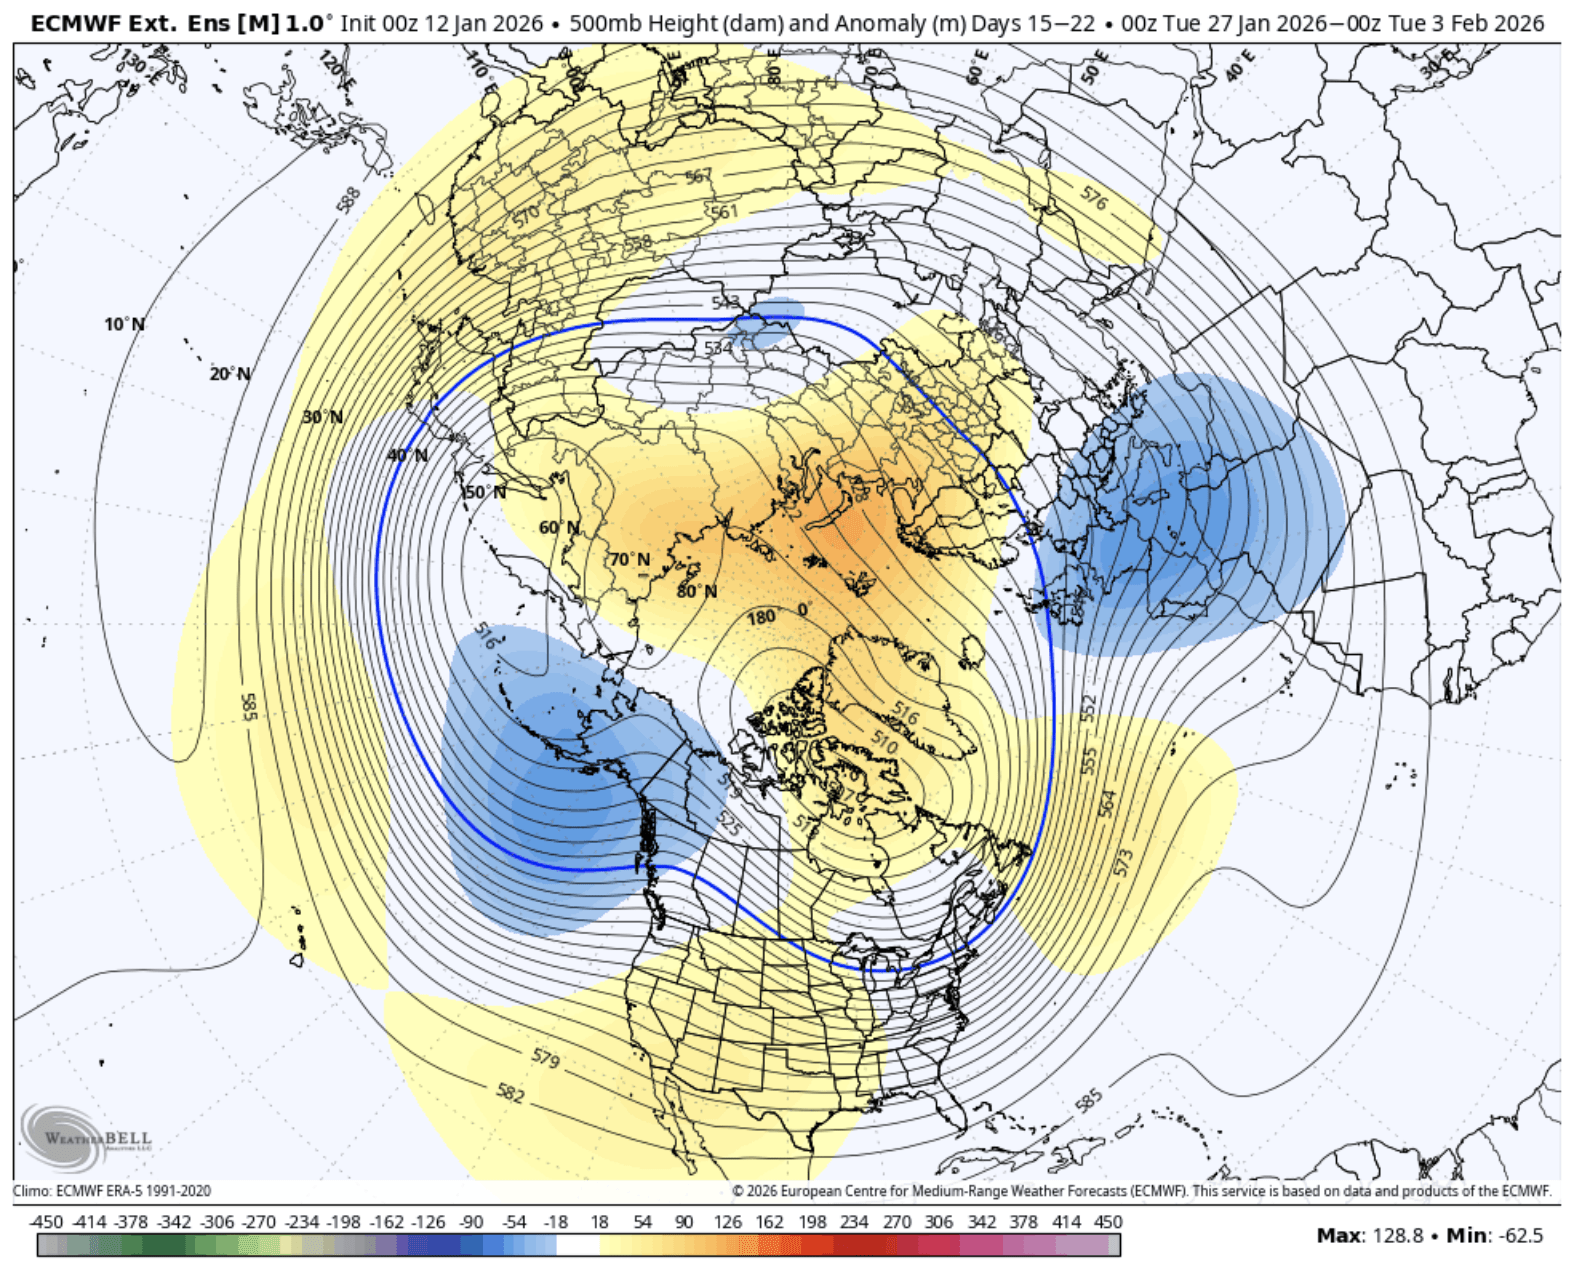
ECMWF-EPS weekly forecast
15-22 Day
22-29 Day
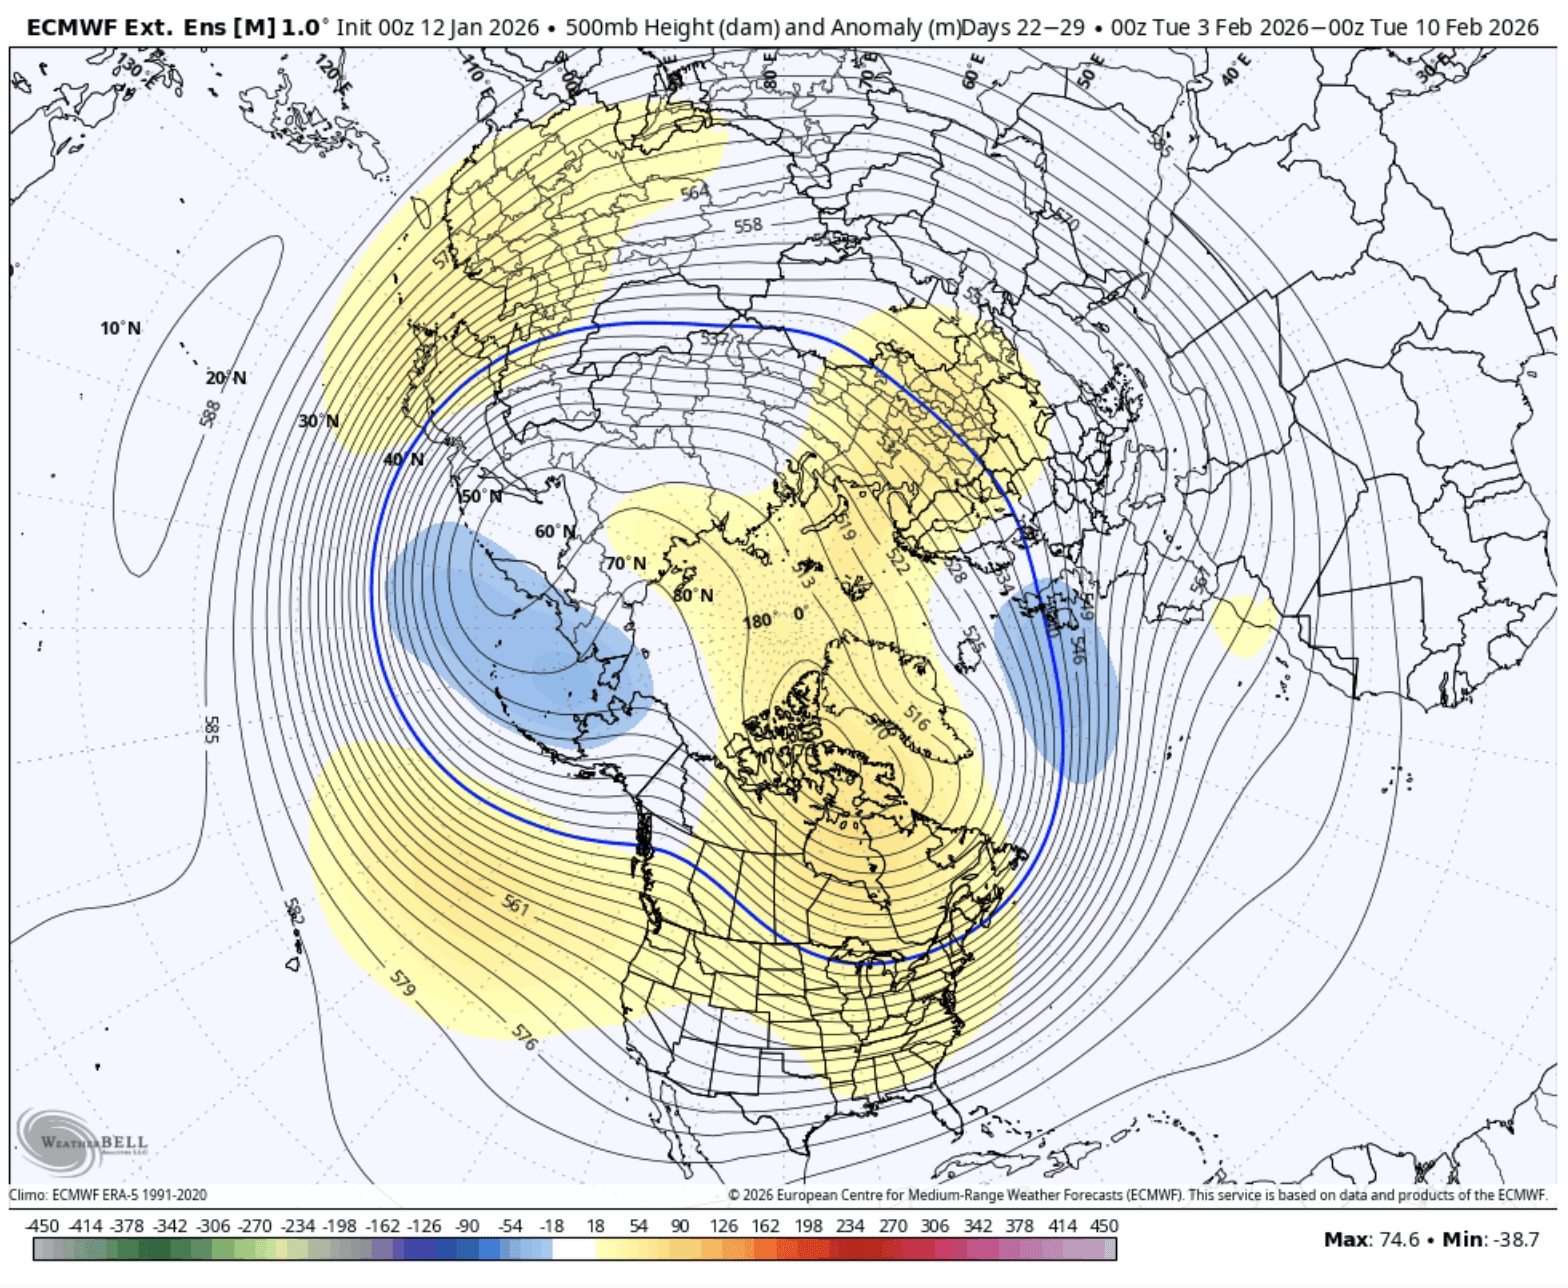
The two long-range weather model maps illustrate what happens if the Alaska ridge disappears. As you can see, the cold escapes North and Lower 48 is blasted with warmer-than-normal weather.
This forecast is one of the key reasons why you aren’t seeing natural gas bulls jump for joy just yet. The models are basically at polar extremes right now. On one end, if the Alaska ridge holds, then we are looking at 2-3 weeks of bullish weather. Inversely, if the Alaska ridge disappears, then we are back to warmer-than-normal weather.
From a fundamental perspective, we will have to dive into both scenarios to see what happens to natural gas storage.