EIA's oil storage report today was moderately bullish with the 3 million bbl crude draw being higher than the 5-year average, and product storage being in-line with the 5-year average.
Relative to the 5-year average, the big 4 (crude, distillate, gasoline, and jet fuel) are trending in the right direction, but remain above 2022 and 2023.
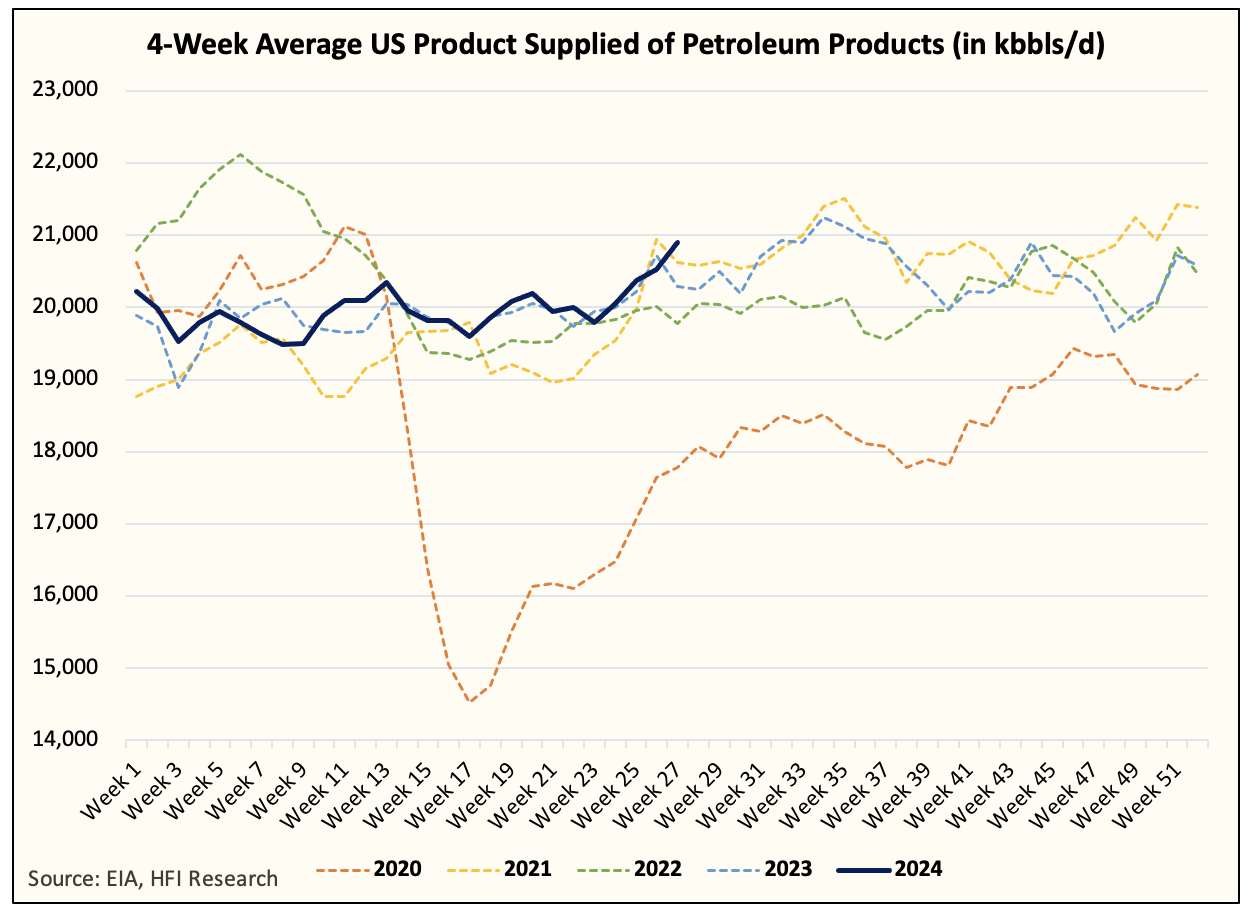
More important for us is the US implied oil demand figures from this week's report. On a 4-week average basis, total US implied oil demand is at the highest level for this time of the year over the last 5 years.
I will be the first to tell you that I am surprised by this figure. Why? Because if you look at 1) overall product storage and 2) the 3-2-1 crack spread, you would conclude that consumer demand is tepid at best. And yes, there is truth to the idea that the US weekly implied oil demand figures could be overstated from time to time, so we need to be cautious.
But as we've long said, while the weekly US implied oil demand figures are imperfect, they do provide a great tell on the overall direction of US oil demand. In this case, the strong trend higher is a good sign that demand in the US is far stronger than what people are expecting.
In addition, if you look at the big 3 breakdowns, you can see that we are starting to move counter-seasonally versus the trend we saw in 2022 and 2023. One explanation for this is that refined product prices are lower y-o-y.
We know from the H2 2022 saga that the spike in petroleum product prices sent US oil demand lower, and similarly, the increase in refining capacity is helping reduce pricing, and thus pushing demand higher again.
With that said, we will want to see this trend persist for the coming weeks. In theory, it will be best for the big 3 product categories to match or exceed that of the 2021 trendline. If so, then it signals to us that US oil demand is far stronger than what consensus anticipates.


