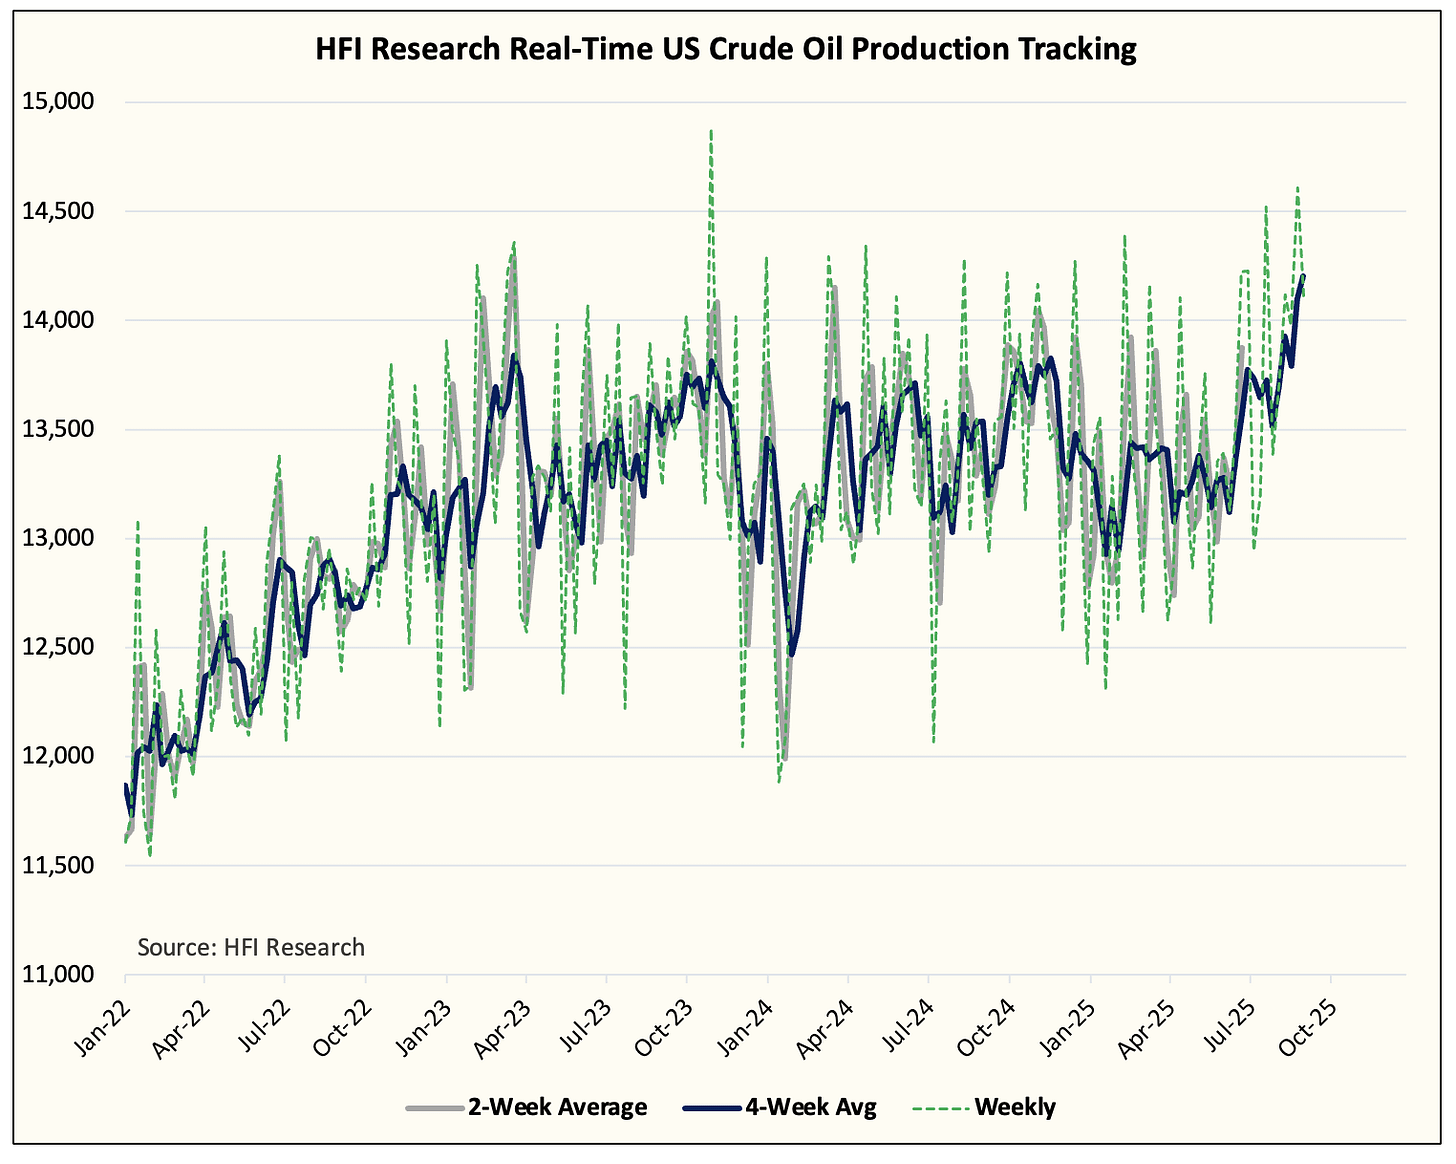
Since our publication titled, US Crude Oil Production Hits An All-Time High And What To Expect Going Forward, we have received a lot of feedback from subscribers noting their disbelief in the data. So I think it's time to explain how we derive our data and what subscribers can learn from the things we are seeing.
History
First, I would like to provide a brief overview of our methodology. Like everyone else, we initially entered the energy business using a bottom-up approach. We would look at company guidance, rig counts, frac fleets, well completions, wells drilled, decline rate assumptions, and forecast what US crude oil production looks like.
This method turned out to be extremely flawed. Our first big miss came in 2017 when we assumed US shale crude oil production was slowing, and then we missed again in late 2018 when US crude oil production surged into year-end.
The bottom-up approach fails to take into account real-time data in the analysis. It's a bit like driving following a GPS map blindfolded. Instead of watching the road and paying attention to what's ahead, you are just blindly following a model and hoping that the assumptions are right.
Following the absolute bloodbath I took in 2018, I went on a journey to refine the methodology. First, I needed to figure out why no one can estimate weekly US crude storage figures accurately. Was there something in the data that made it inherently difficult?
Unlike natural gas storage estimates, which can be predicted with a very high degree of accuracy, no one has figured out US crude storage estimates. Not even the API, with its similar survey collection method, has figured out US crude storage estimates.
So I went on this soul-searching journey and arrived at two obvious conclusions:
US crude storage balance is inherently biased to the upside (builds) because of an unknown variable, unaccounted for crude balance, that added ~700k b/d. Now we know this figure as transfers to crude oil supply (introduced in 2023 by EIA).
Because the weekly US crude oil production figure is an estimate, the only true figure we know is the absolute storage level. As a result, we can derive an implied US crude oil production figure working backwards.
This realization led to the creation of our modified volume adjustment factor. This methodology takes into account realized crude imports and exports and takes out the timing variable that's inherent in the EIA weekly oil storage reports. By isolating imports, exports, refinery throughput, and land imports, we were able to pinpoint the broad direction of US crude oil production.
This is when the HFIR real-time US crude oil production figure was born.
Now let's fast forward to today's data and what it's showing.


