

Weather models over the weekend trended colder with a bump in heating degree days across the board. But as we noted in our NGF report last Thursday titled, “The Incredible Natural Gas Sell-Off And Where Is The Bottom?“ We said that the time to pick a bottom is not here yet. The only way you can have a high degree of confidence in picking the bottom in natural gas during winter gas trading is if you have a strong view on the directional change in the weather setup. For now, I’m here to tell you that I don’t see it.
ECMWF-EPS 15-Day Cluster
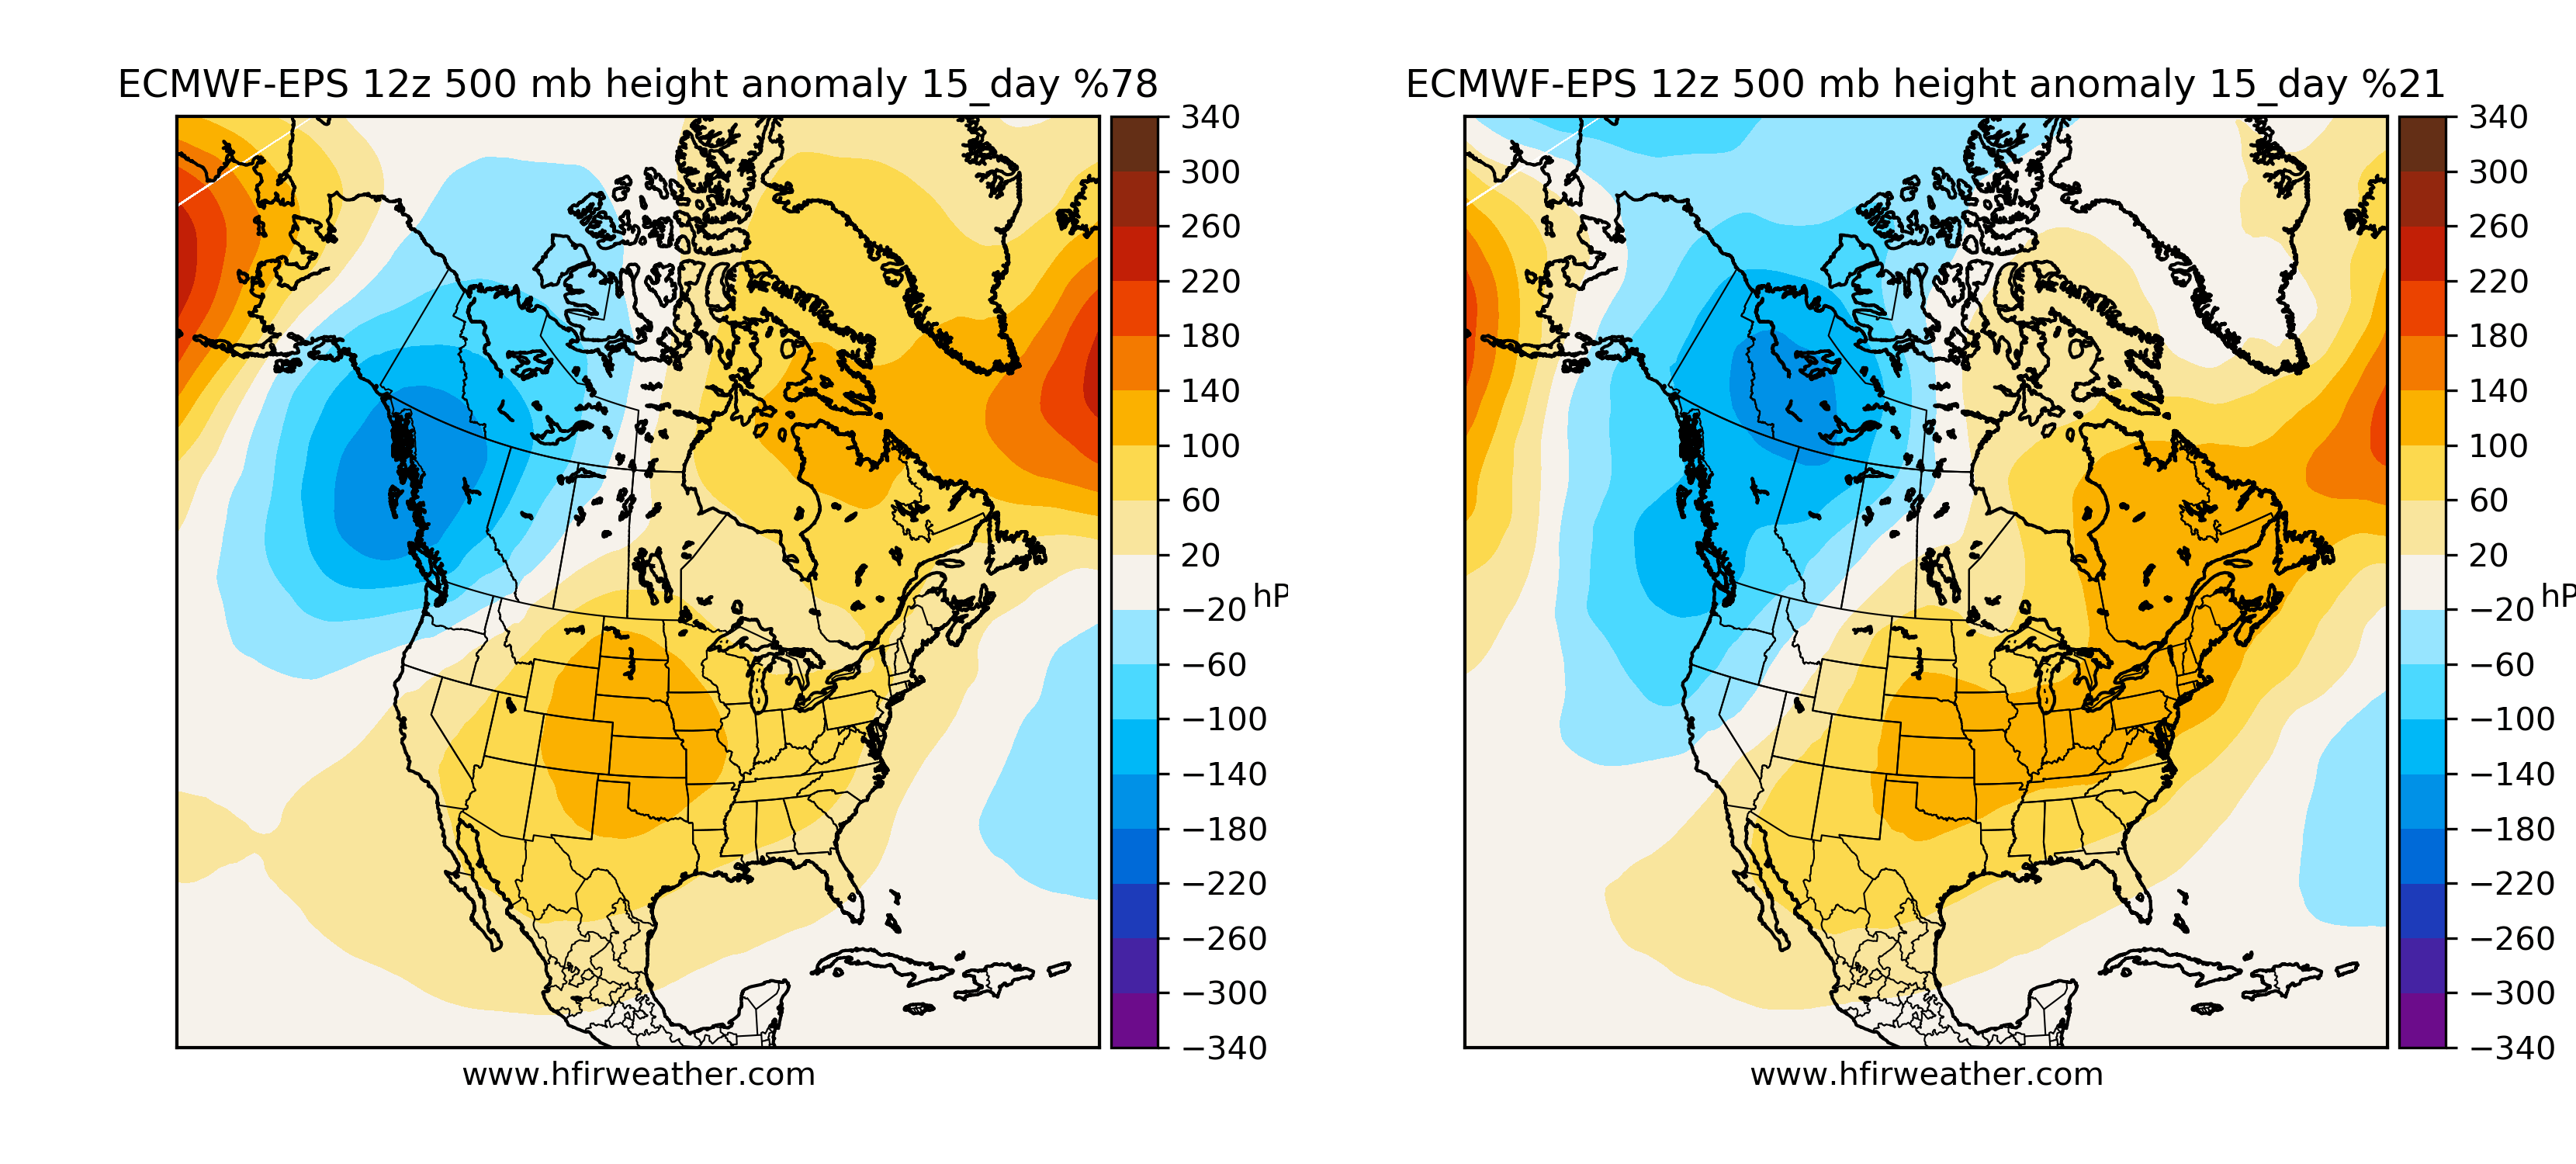
The most important chart for the natural gas market today is the 15-day outlook. In winter gas trading, natural gas traders obsess over this chart because it tells you which way the weather is “directionally” headed. In this case, you can see the lack of an Alaska ridge and the continuation of the Alaska trough. The Alaska pattern, or also known as the Eastern Pacific Oscillation, needs to show a ridge (yellow to red) pattern as to increase the probability of colder-than-normal weather in the East.
For the moment, this is not in the forecast, and so for everyday that passes without this signal changing, the more natural gas prices will be pressured downward.
There will come a point where it’s too obvious that natural gas prices have sold off to an extreme (getting close), but in order to have confidence in “buying the dip”, we would need to see this pattern change.
Getting Technical
Now I don’t want to bore you with the technical details of reading weather model maps. But here’s the issue that’s creating a lot of uncertainty in the weather forecast:
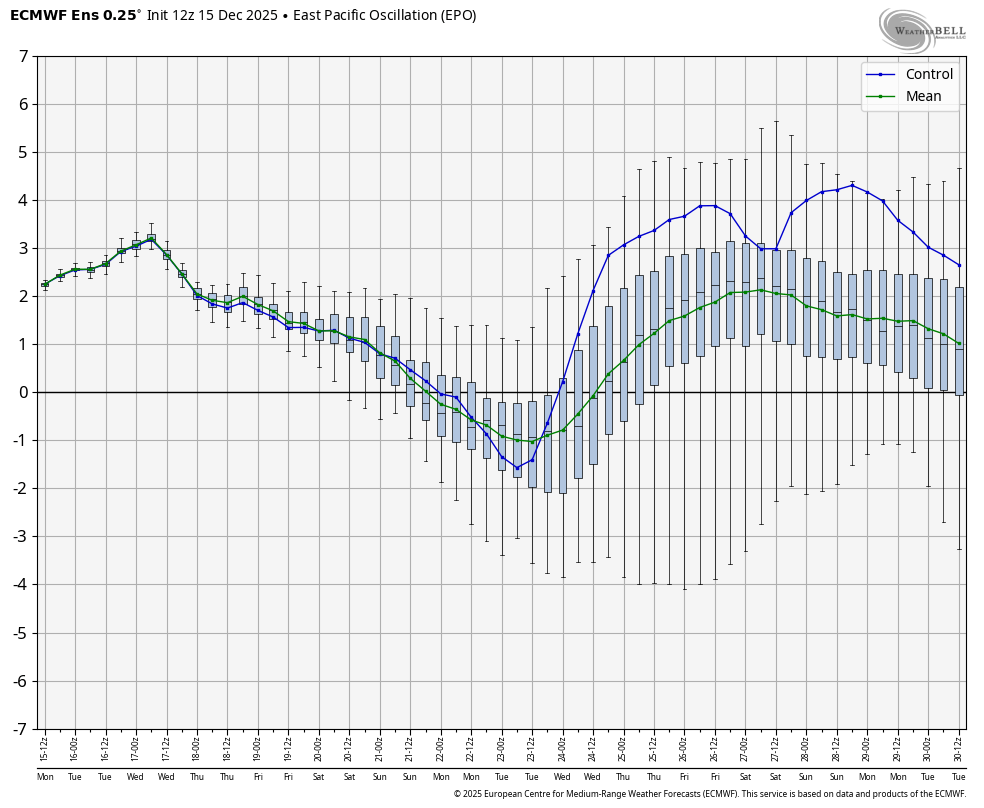
The teleconnection chart for the Eastern Pacific Oscillation shows a lot of variability in the 10-15 day range. This is normal for the course, given how unpredictable weather forecasting is. As you can see in the green line (mean) above, the 50 ensemble member mean is showing a positive EPO pattern, which translates to the Alaska trough continuing.
So long as this signal continues to trend positive, natural gas prices will be pressured downward.