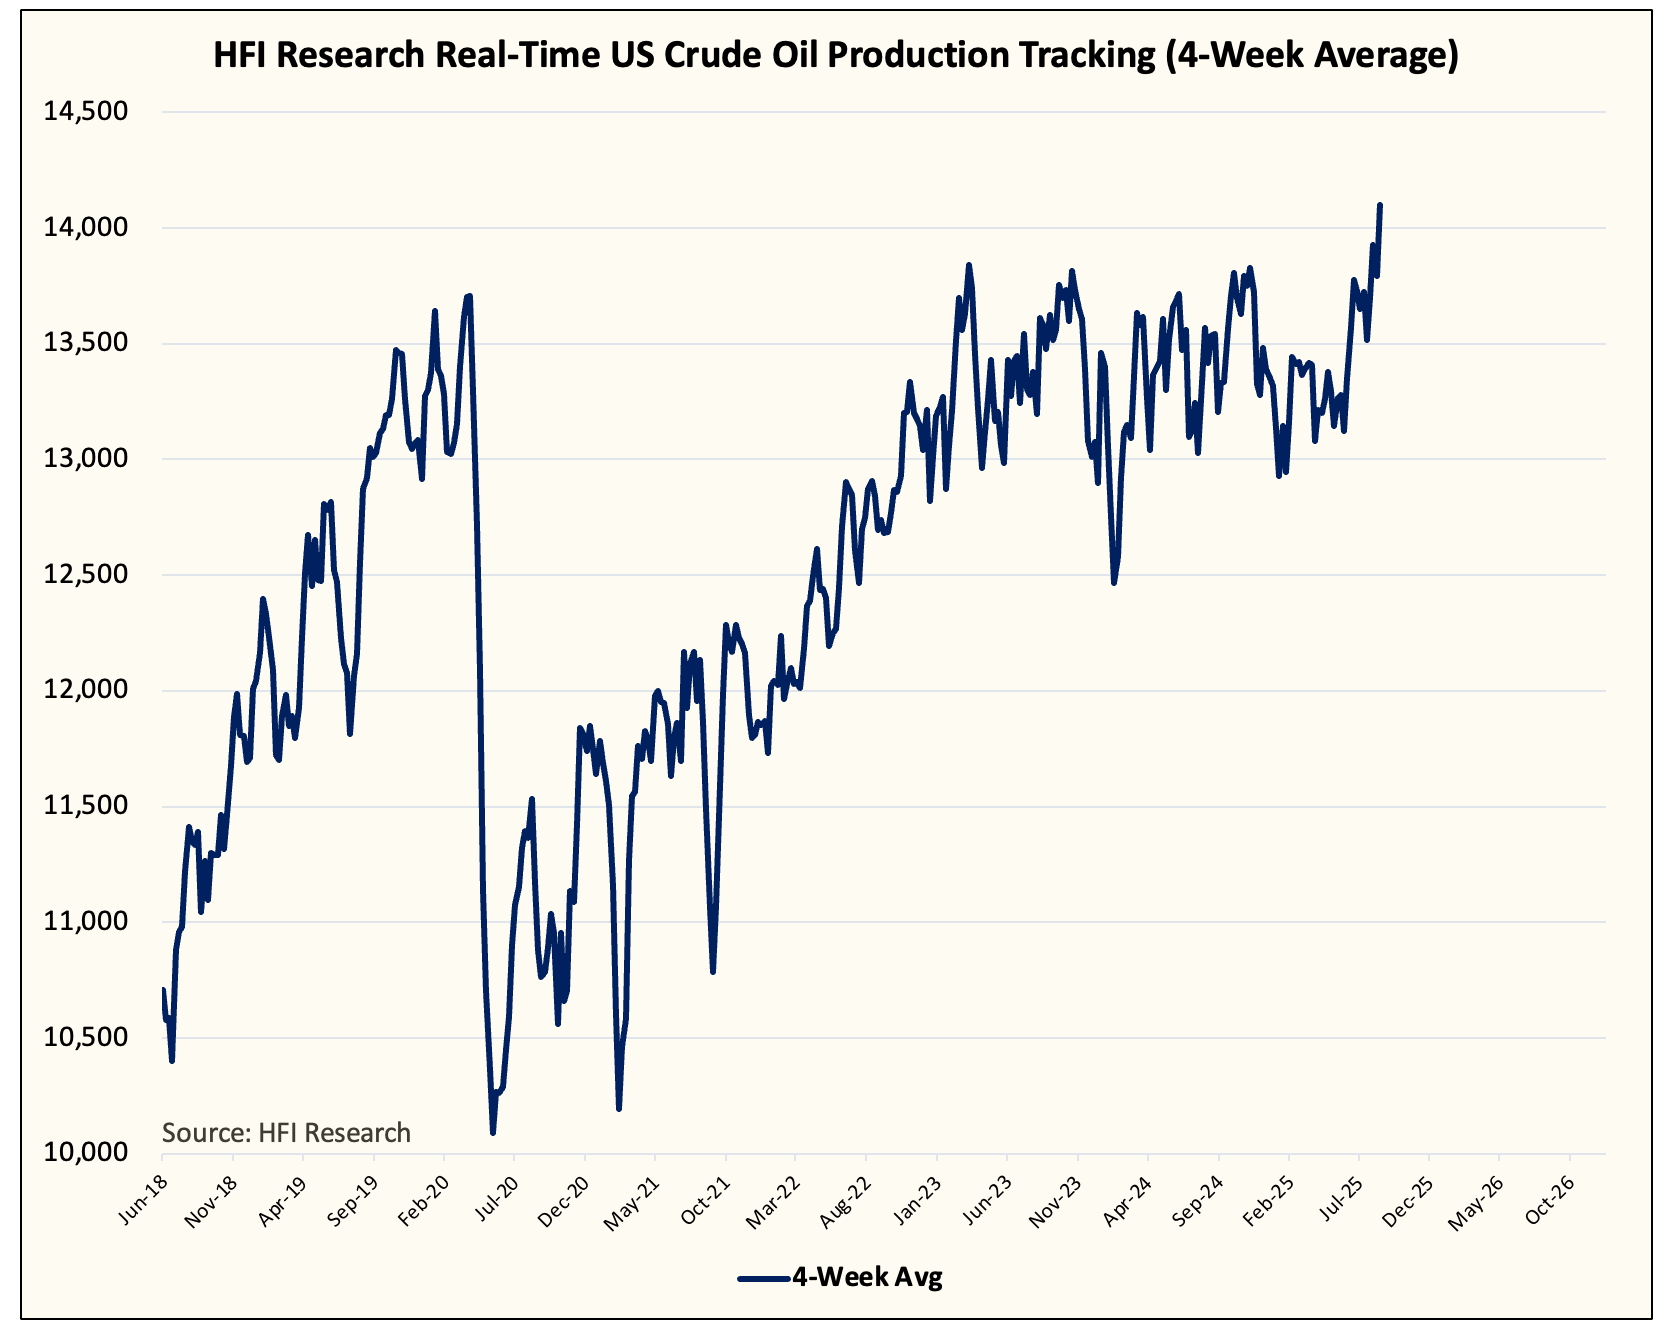
This is the first time since we started tracking real-time US crude oil production that the data is showing +14 million b/d on a 4-week moving average basis.
Now, keep in mind that out of the ~14 million b/d, at least ~300k b/d of that will be condensate. However, even if we take that out, US crude oil production is averaging ~13.7 to ~13.75 million b/d in August.
What’s really strange/interesting about the data is that you can see the material weakness (below chart) at the start of the year going into May 2025.
But this all changed in June. Following the price spike resulting from the Iran/Israel conflict, US crude oil production jumped from ~13 million b/d to ~13.7 to 13.75 million b/d (14 million b/d if you include condensate).
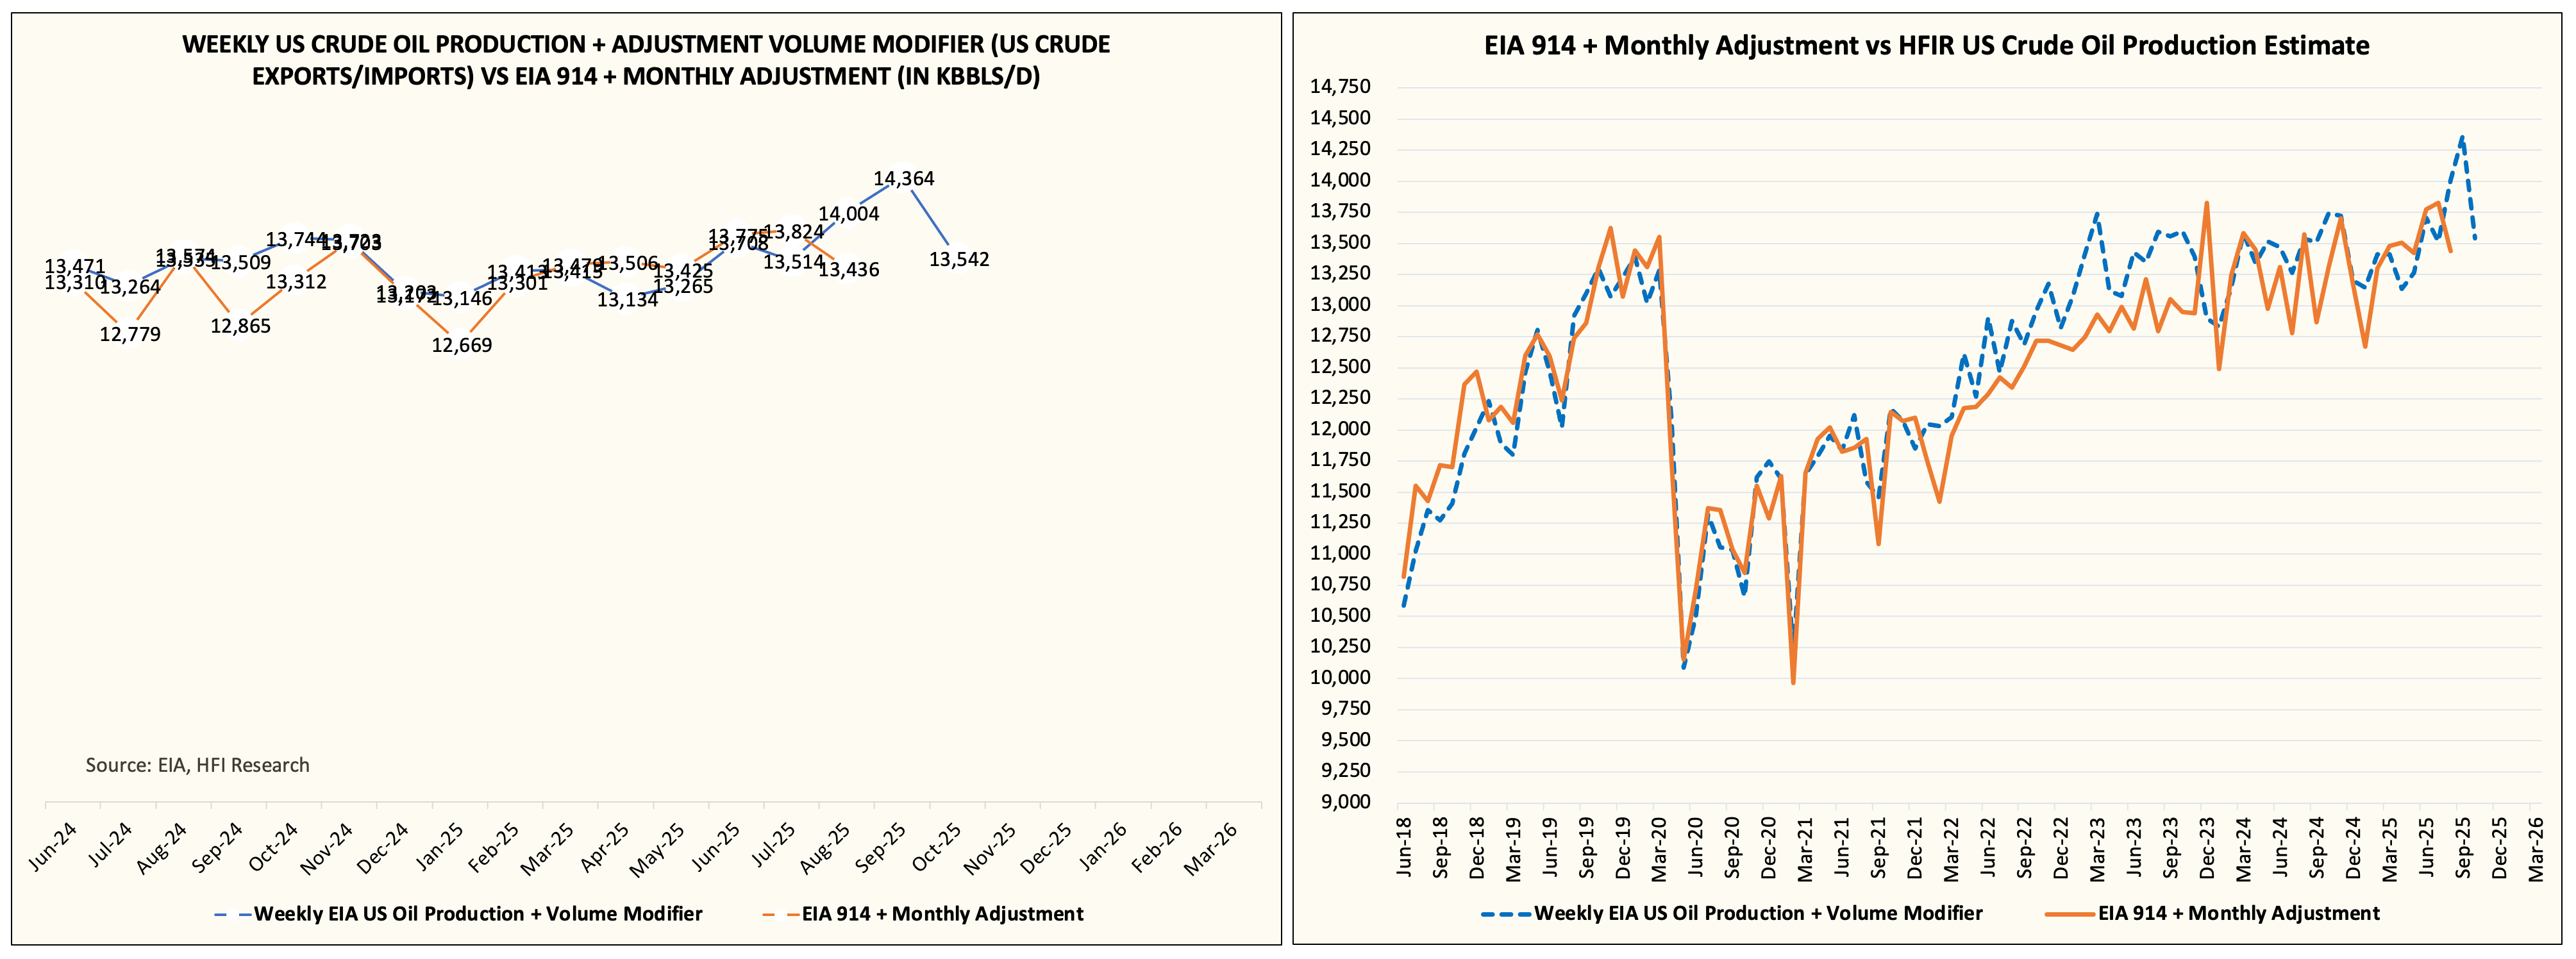
Fast-forwarding to last week, the EIA confirmed the production uptick we saw in August via the EIA 914 report. US crude oil production came in at ~13.794 million b/d or +430k b/d y-o-y. And according to our tracker, September US crude oil production will be higher than August, but it will be the peak.
For readers following our US crude oil production closely, it may feel like the data is noisy, but I can assure you that the surprise to the upside is real (validated by EIA 914) and the current surprise to the downside is equally real.