

Note: This article was first published to HFI Research paying subscribers on April 30.
Please read part 1 of the report.
EIA released its monthly US oil production figures for February, showing a material rebound. At 13.154 million b/d, US oil production increased by ~600k b/d m-o-m. The rebound was entirely expected as the drop in oil production in January was related to the weather.
In a report we published on April 1 titled, "US Oil Production Is A Lot Uglier Than You Think." We said:
First, it's important to remember that January experienced a very severe snowstorm that shut-in US oil production. We saw this in real-time in natural gas production data.
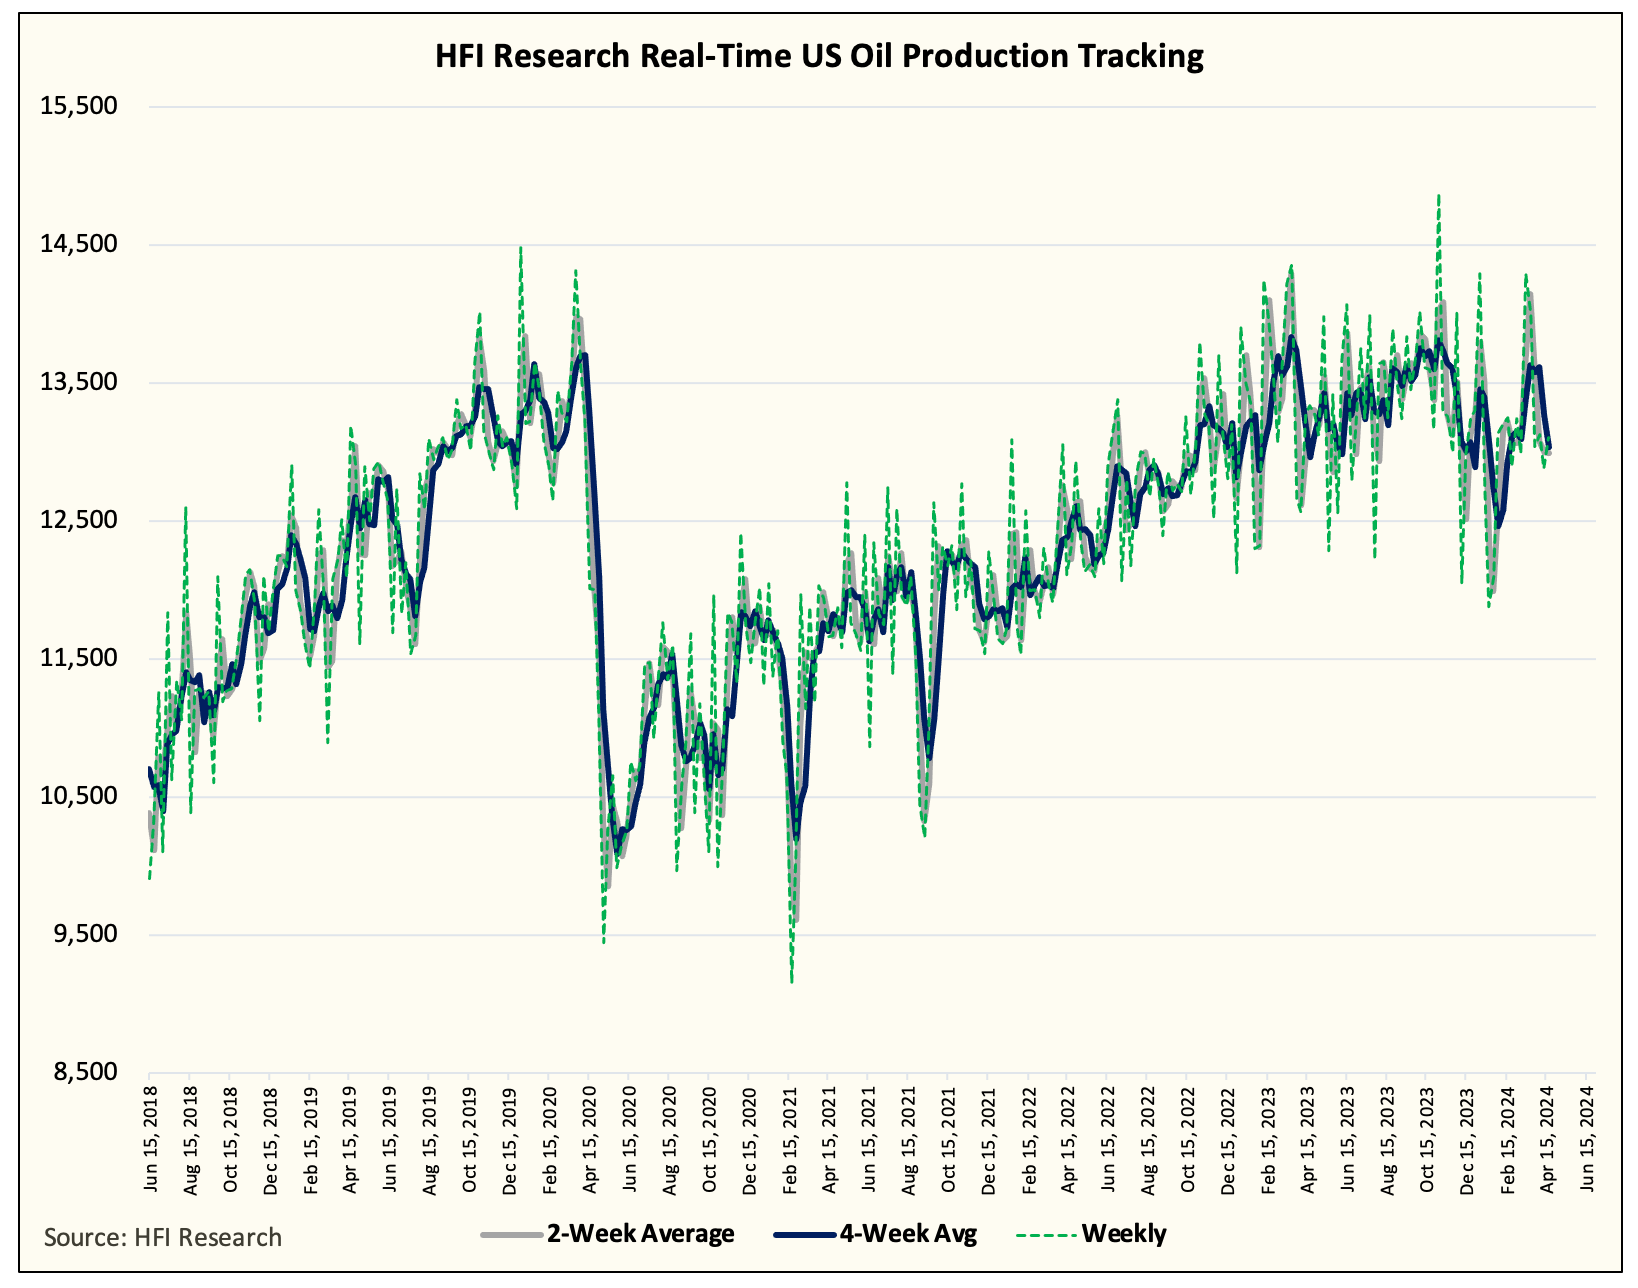
Since then, Lower 48 gas production has recovered and our real-time US oil production figure puts the average around ~13.148 million b/d for February.
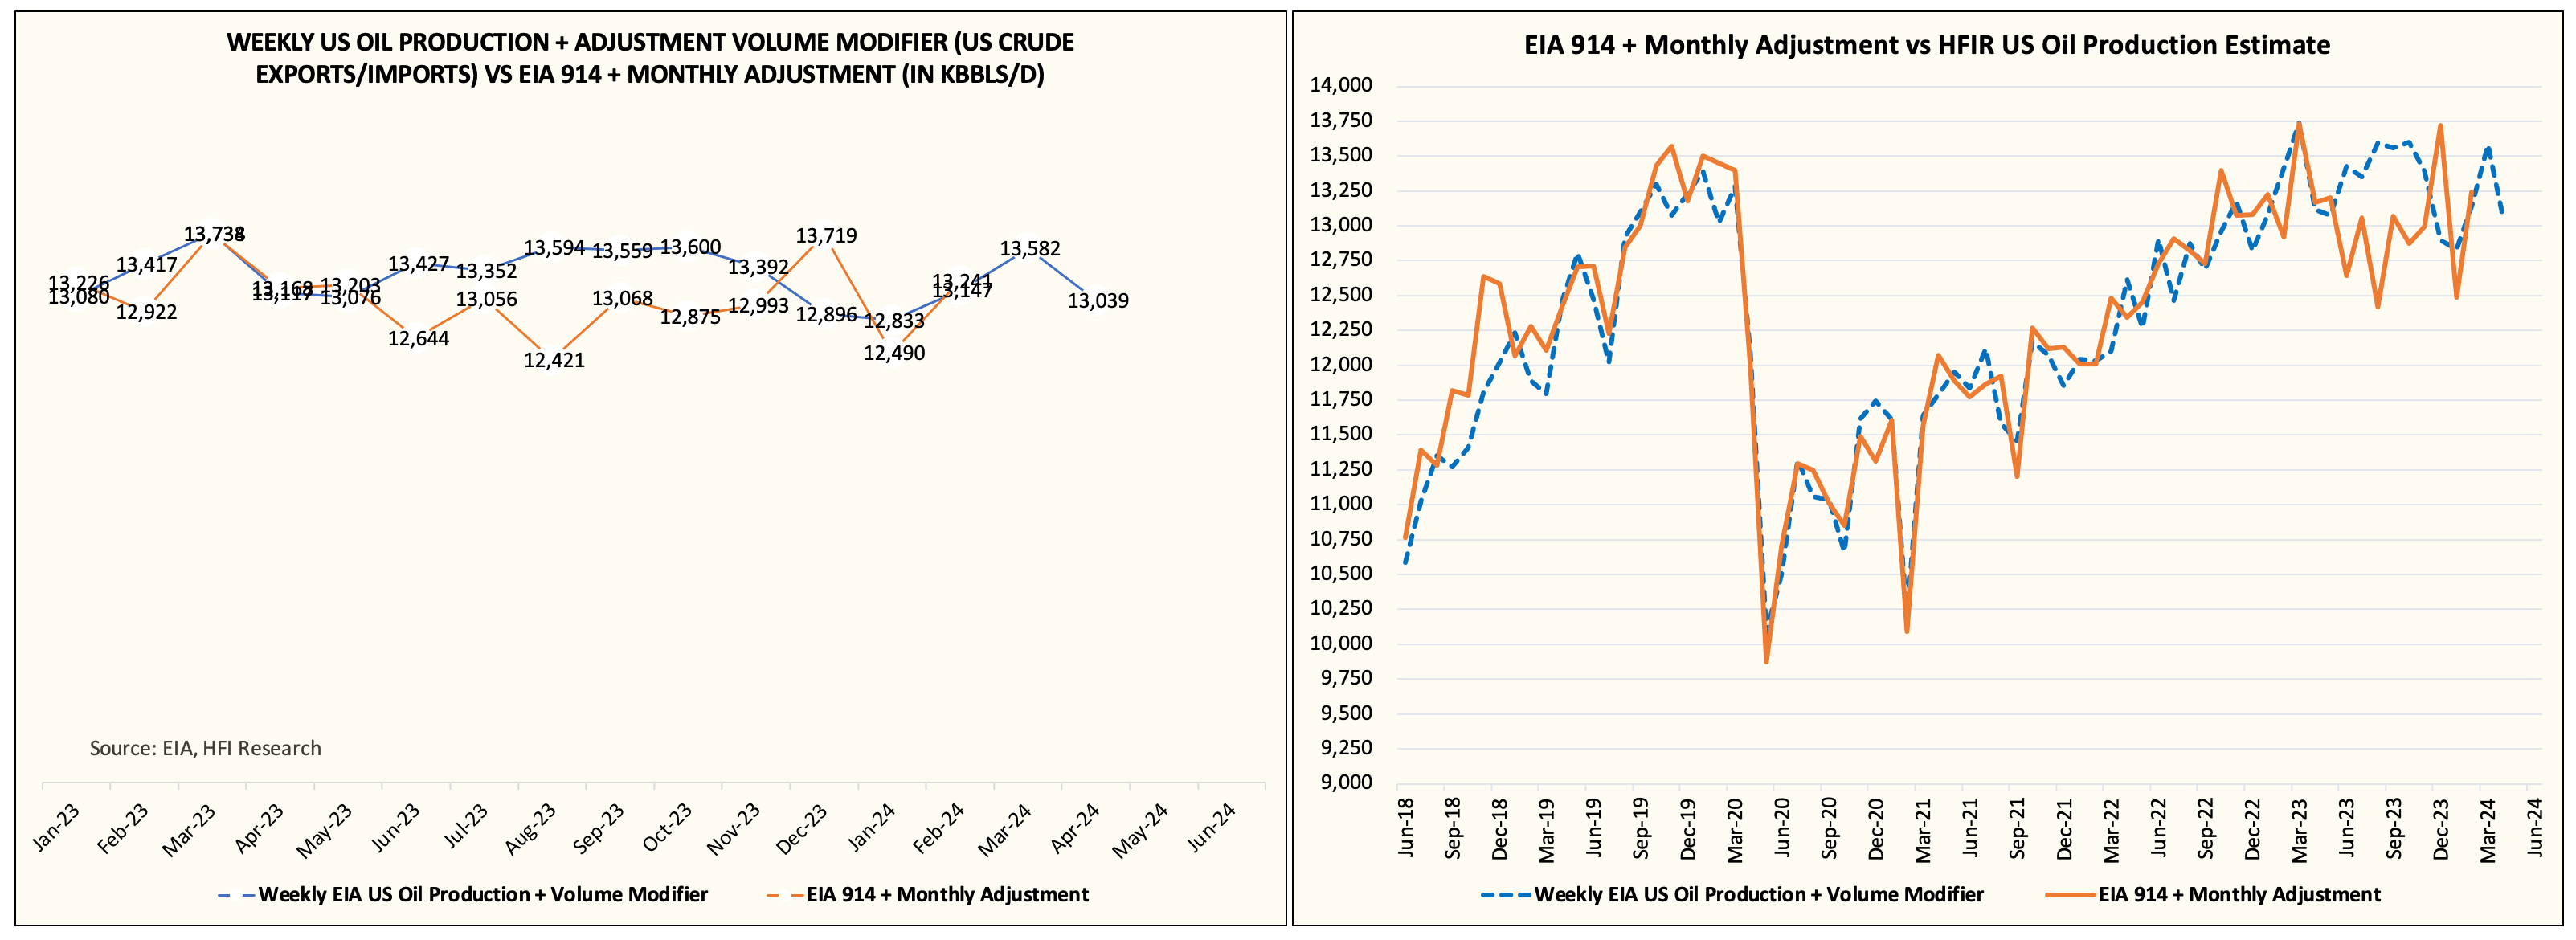
Factoring in the adjustment in the February PSM report, EIA's total US crude oil production came in at 13.241 million b/d versus our 13.147 million b/d.
Expectations...
Our expectation coming into this monthly production report was for a negative adjustment. This was to account for the overstated US oil production + adjustment reported in December 2023. However, EIA's report shows a positive adjustment of 87k b/d for February, which resulted in the 13.241 million b/d being reported.
As you can see in our estimate versus EIA 914 + adjustment, following the June 2023 introduction of "transfers to crude oil supply", the figures have been extremely volatile. For readers wondering how we are combating this volatility, we are simply averaging out the EIA 914 + adjustment on a 2-month rolling basis.
In this case, January was likely understated by ~300k b/d at ~12.5 million b/d versus our ~12.8 million b/d, while February was overstated by ~150k b/d. In aggregate, the average for January and February is 12.87 million b/d.
What to expect for March?
This is where things get tricky. According to our real-time US oil production tracker, implied US oil production jumped to ~13.5 million b/d. But we think a lot of that has to do with the destocking of inventory post the freeze-off in January. In our weekly US crude storage estimates, we saw EIA report 12 million bbls higher than our estimate, which equates to ~387k b/d. Taking this into account, we have US oil production for March coming in at 13.2 million b/d, or ~50k b/d higher than what was reported in February.
For April, we have US oil production falling back to ~12.9 to ~13 million b/d. So far, EIA weekly crude storage figures have surprised to the downside versus our estimate, and we expect that trend to continue.
An Alarming Trend
In our report from last week, we noted that there was an alarming trend developing in US shale oil production. In essence, we believe that US shale oil production is becoming gassier and more NGL-weighted. In this chart below, you will find an interesting narrative developing.
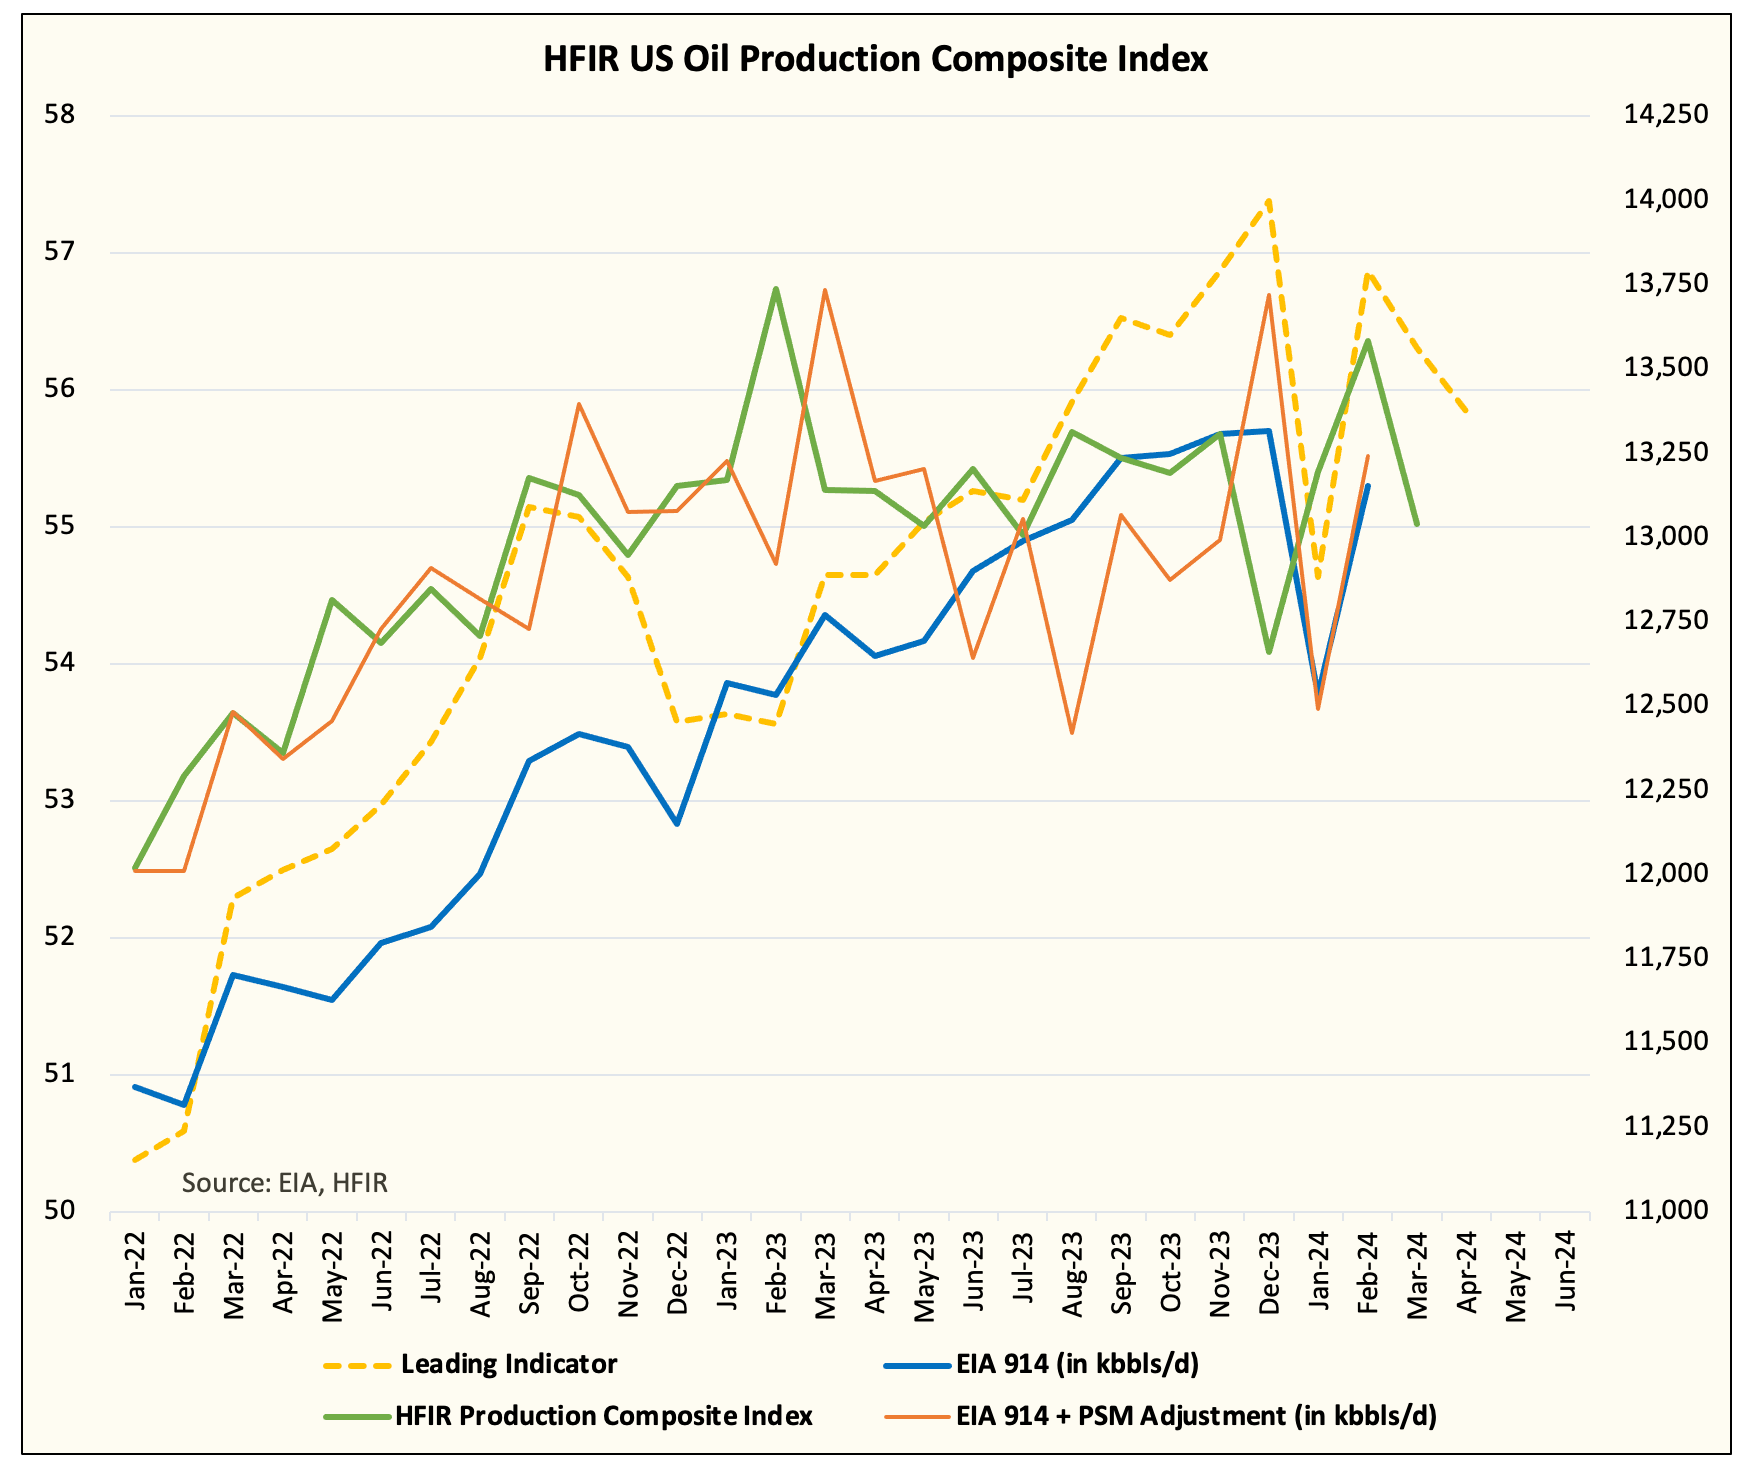
Since January 2022, reported US oil production (EIA 914) increased by 1.785 million b/d.
Associated gas production increased from ~50.5 Bcf/d to ~56 Bcf/d, or far outpacing the headline growth we saw out of the EIA.
But if you look at our US oil production composite index, real growth in US oil production is ~1 million b/d (April 2024 vs Jan 2022). Our production composite takes into account the adjustment factor.
On the surface, it appears that US oil production dramatically increased, while the reality is that the growth has decelerated materially. If you look at our comparison, the monthly increase in US oil production is +35.7k b/d.
And if you take the last 12 months, US oil production actually decreased from 13.117 million b/d to 13.039 million b/d.
This is not something you are going to find in most sell-side reports, because they do not track the data on a granular level like us. The result of this analysis wouldn't be possible unless we were able to track weekly US crude storage figures, so I am very thankful we have that tool in the bag.
Incredibly... dare I say it?
I am not going to jinx myself by saying this, but we are very much on track with our US oil production thesis. I fully expect US oil production to grow this year with us exiting around ~13.3 to ~13.4 million b/d, but at some point later this year, many of the sell-side analysts along with fund managers will come to the same conclusion we came to.
Not only was US oil production overstated exiting 2023, but the growth is turning into a decline by the 2nd half of 2024. Despite the oil majors all projecting an increase in US oil production, other smaller producers that did not find attractive offers from buyers will be forced into a disciplined position. This will put a tremendous drag on US oil production and likely offset the growth we see from the majors.
As the thesis that US oil production will not grow gains traction, more and more people will believe that we are headed for a structural supply deficit. This, of course, is based on the pretense that the global economy won't fall apart in the 2nd half of 2024. And looking at copper prices and various other economic indicators, we are good for now.
Pullback happening so wait for our signal...
As for energy stock positioning, the pullback we expected is still unfolding. For most energy stocks, I expect another 10% to 15% pullback. Many of the names we follow exhibited very overbought technical conditions and in junction with what we saw in the oil market (weakening refining margins), we felt that a pullback was coming.
Following this pullback, we will await for the oil market signals to turn before buying again. We will also be watching technical patterns to see that the names we want to own have found solid support.
So please be patient and wait for our signal. While what we wrote today is very bullish for oil in the medium to long-term, we must remember that the long-term is made up of short-term events.
Analyst's Disclosure: I/we have no stock, option or similar derivative position in any of the companies mentioned, and no plans to initiate any such positions within the next 72 hours.