


Editor’s Note: This article was first published to subscribers on Oct 1, 2024.
Please read Part 1, and Part 2 of this series.
We've been pounding the table all year on what we think is a very alarming trend developing in US shale oil production. For those of you who have not read part 1 or part 2 of this series, I highly encourage you to do so. But if you don't have time, here's the cliff note version:
US shale oil production growth in 2023 was overstated because EIA understated US oil production in 2022 and overstated production (after June) in 2023. The end result was an overstated growth rate that was then used by sell-side analysts in all of their models (2024 & 2025).
US oil production is flat y-o-y. The consensus expectation was for US oil production to reach ~13.5 million b/d by year-end.
Associated gas production from US shale oil basins is now far outpacing crude production growth. This is usually a sign of a maturing basin and the peak in the Permian is not far away.
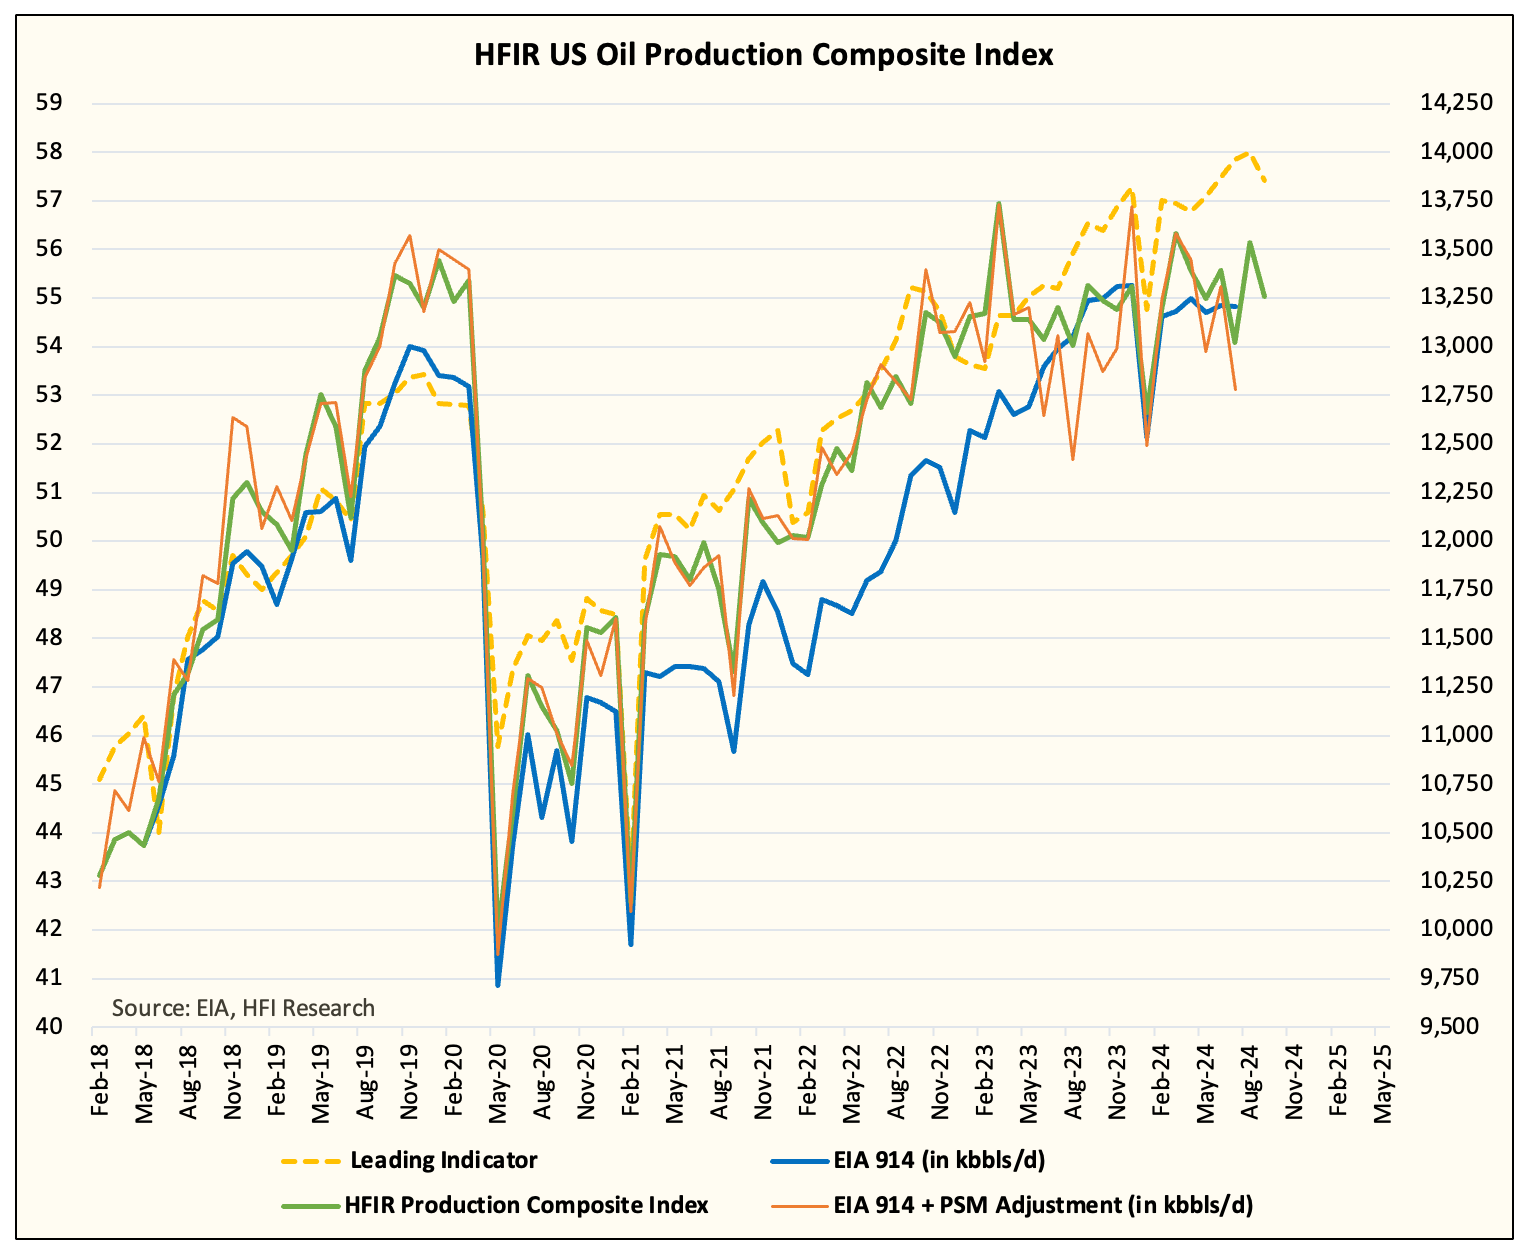
The trend is becoming clearer with EIA releasing US oil production data for July yesterday. According to the EIA, US crude production for July came in at 13.205 million b/d. While this is a small decrease m-o-m, the real indicator is in the adjustment factor (balancing item), which was -425k b/d.

Relative to our expectations, US crude production severely disappointed our implied production figures for July. How much disappointment? Here are the staggering figures for this year:
July US crude production:
12.78 million b/d (production vs adjustment) vs 13.264 million b/d (our method)
Last 3 months:
EIA 914 reported production - 13.199 million b/d
EIA 914 + adjustment - 13.021 million b/d
Year-to-date (production + adjustment):
2023 same time horizon - 13.136 million b/d
2024 YTD - 13.118 million b/d
HFIR Production Tracker - 13.307 million b/d
Do you notice anything in particular from this trend?
First, it should be obvious that US oil production year-to-date is marginally lower y-o-y. Production freeze-off in January explains a large part of the delta, but what's not commonly discussed is the fact that even if you exclude the freeze-off, production is only marginally higher y-o-y.
Second, our production tracker has been overstating US crude production, which is another sign that US oil production is far weaker than expected.

To give you some foresight, our production tracker actually shows US oil production stagnating further in August and September. Readers should note that there hasn't been any production growth since July.
Lastly, and I think the most alarming trend of them all is the disparity between associated gas production growth and crude production growth.

To illustrate how big of a disparity, since Jan 2023, Lower 48 natural gas production excluding Northeast and Southeast has increased from 53.63 Bcf/d to 57.84 Bcf/d, or an increase of 7.85%.
Similarly, over this time period, US crude production has grown ~5% using EIA's reported figures (914).
But if you use the production + adjustment method and a 3-month moving average (to smooth out the monthly swings), US crude production declined by 1.55%.
In my view, this is the most obvious trend that's developing in US shale oil production, and the disparity will only grow. US shale oil production will only get gassier over time, and with it, US crude production is peaking.

How to verify that we are right?
As always, I want to give you tools to validate that we are on the right track. The first tool is to keep watching our real-time US oil production tracker. This has been an excellent tool in figuring out where production is headed, and occasionally, we post our production matrix, which encompasses all the data points.
Second, Matterhorn is coming online, which should increase natural gas takeaway capacity in the Permian by 2.5 Bcf/d. We expect US crude production to increase by ~175k b/d as a result of this new pipeline. If, however, our real-time data fails to show an increase in implied US crude production, then it will be another signal that validates our theory here - US shale oil production is getting gassier.
Finally, EIA oil storage should continue to surprise to the upside versus our weekly estimates. As readers will know, we publish our weekly crude storage forecasts, and typically, our estimates are usually very close to EIA's results. The only times when our results differentiate materially is either when US oil production is disappointing to the downside or surprising to the upside. In either case, we will notify you of what we are seeing. You will also be able to see the development in our real-time US oil production tracker.
The end of an era...
We are seeing the final days of US shale oil production. When associated gas production starts to meaningfully outpace crude production, that's typically when the basin starts to peak. We are starting to see that now in the Permian. While we still expect minimal growth from US shale (+500k b/d from now to the end of 2025), that will be the bulk of the growth we see from the US.
Once the growth era of US shale finishes, we don't expect a steep drop-off in production. We expect producers to keep production flat for many years to come.
But as for the global oil markets, the lack of growth from US shale just as oil demand continues to inch higher will mean that higher oil prices will be needed to incentivize supplies from other sources. Without higher oil prices, we won't have supply growth like the ones we saw from 2014 to 2024.
Another Permian is not on the horizon to bail out the world. It's the end of an era.
Analyst's Disclosure: I/we have no stock, option or similar derivative position in any of the companies mentioned, and no plans to initiate any such positions within the next 72 hours.
What about Montney, guyana, namibia, gulf of mexico.....even china shale oil....