
(Public) Complete Reversal
The run-up in US crude oil production was real, but it's starting to turn.

Editor’s Note: This article was first published to paying subscribers on Nov 5, 2025. We gave a part 2 update since then. The data in the article below was from the original, charts and market data were not altered.
On September 5, we published our OMF piece titled, “US Crude Oil Production Hits An All-Time High And What To Expect Going Forward.” At the time, we went against the consensus and noted that US crude oil production was meaningfully surprising to the upside.
This is the first time since we started tracking real-time US crude oil production that the data is showing +14 million b/d on a 4-week moving average basis.
Now, keep in mind that out of the ~14 million b/d, at least ~300k b/d of that will be condensate. However, even if we take that out, US crude oil production is averaging ~13.7 to ~13.75 million b/d in August.
What’s really strange/interesting about the data is that you can see the material weakness (below chart) at the start of the year going into May 2025.
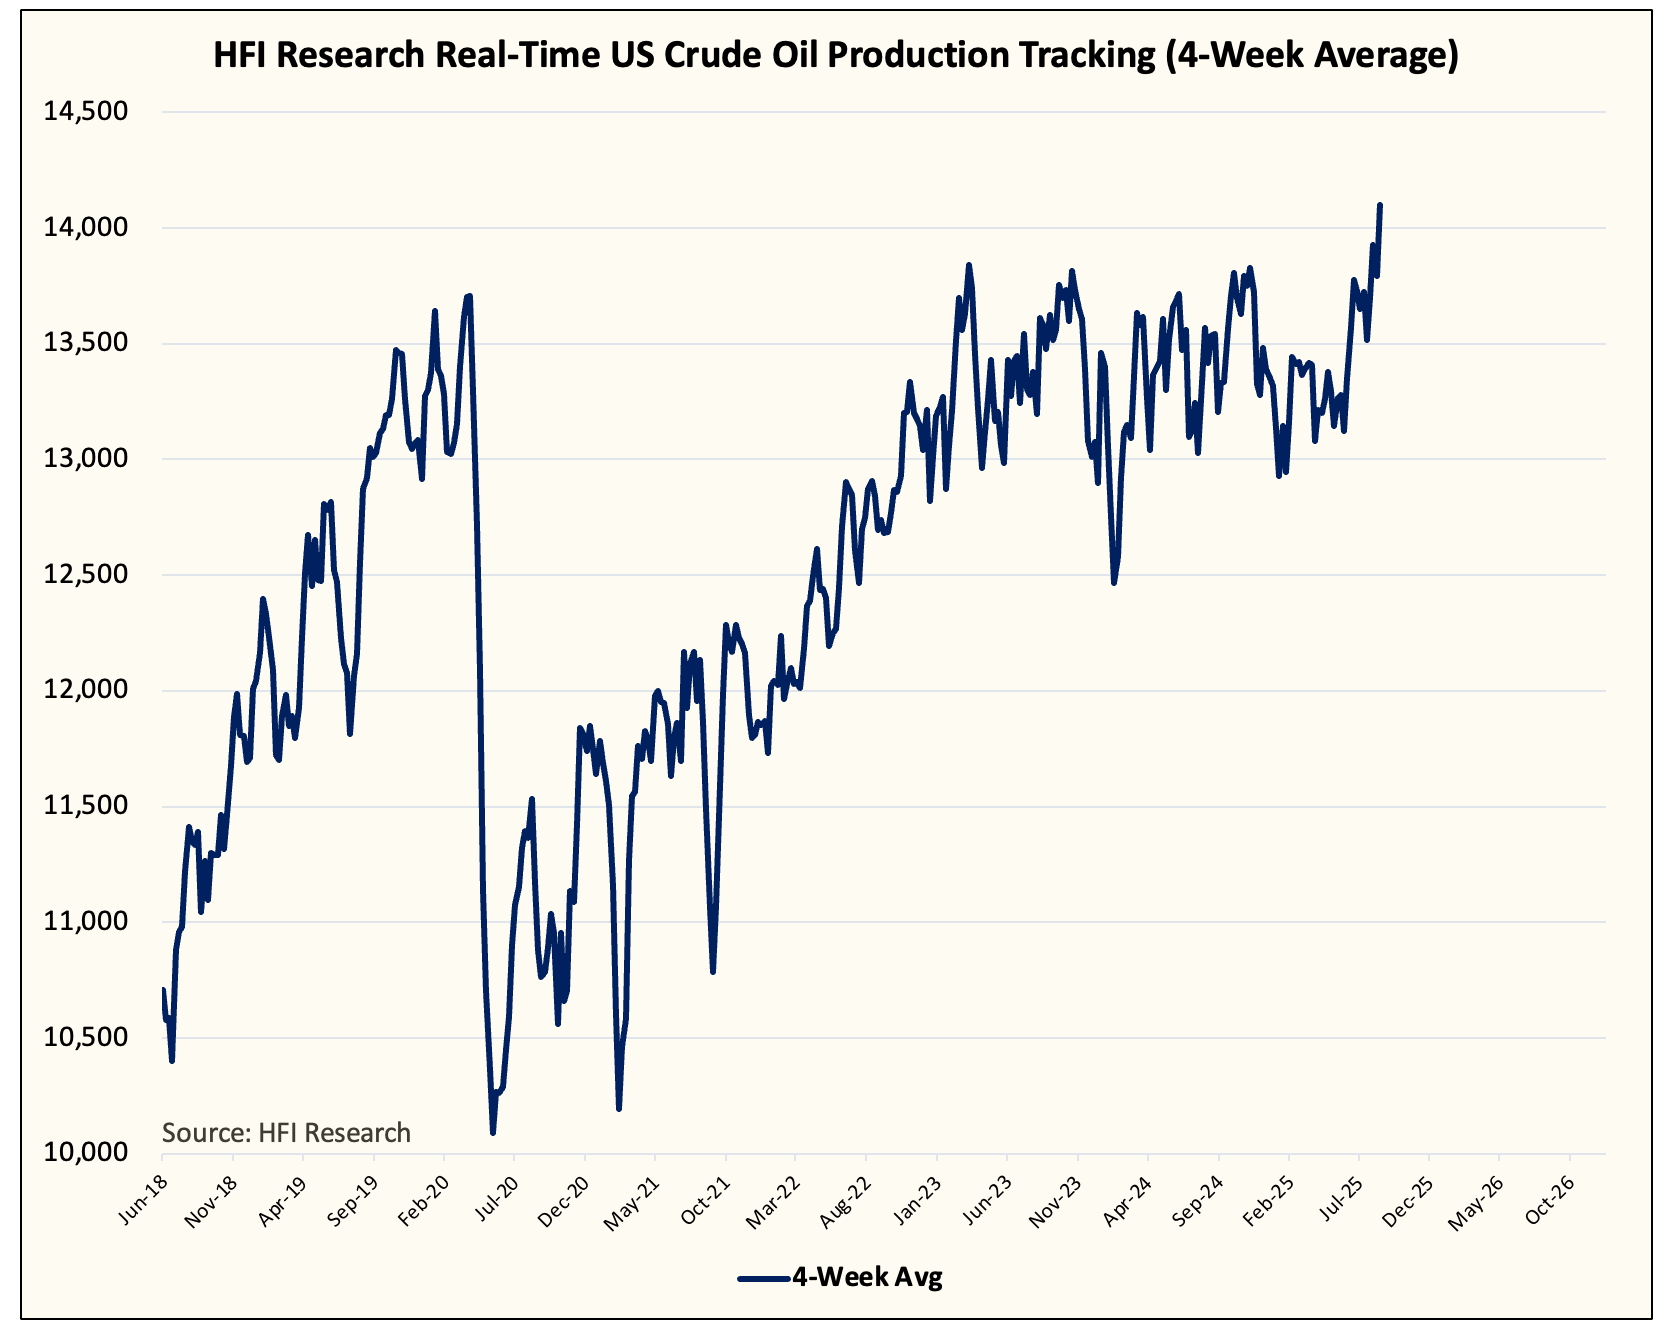
But this all changed in June. Following the price spike resulting from the Iran/Israel conflict, US crude oil production jumped from ~13 million b/d to ~13.7 to 13.75 million b/d (14 million b/d if you include condensate).
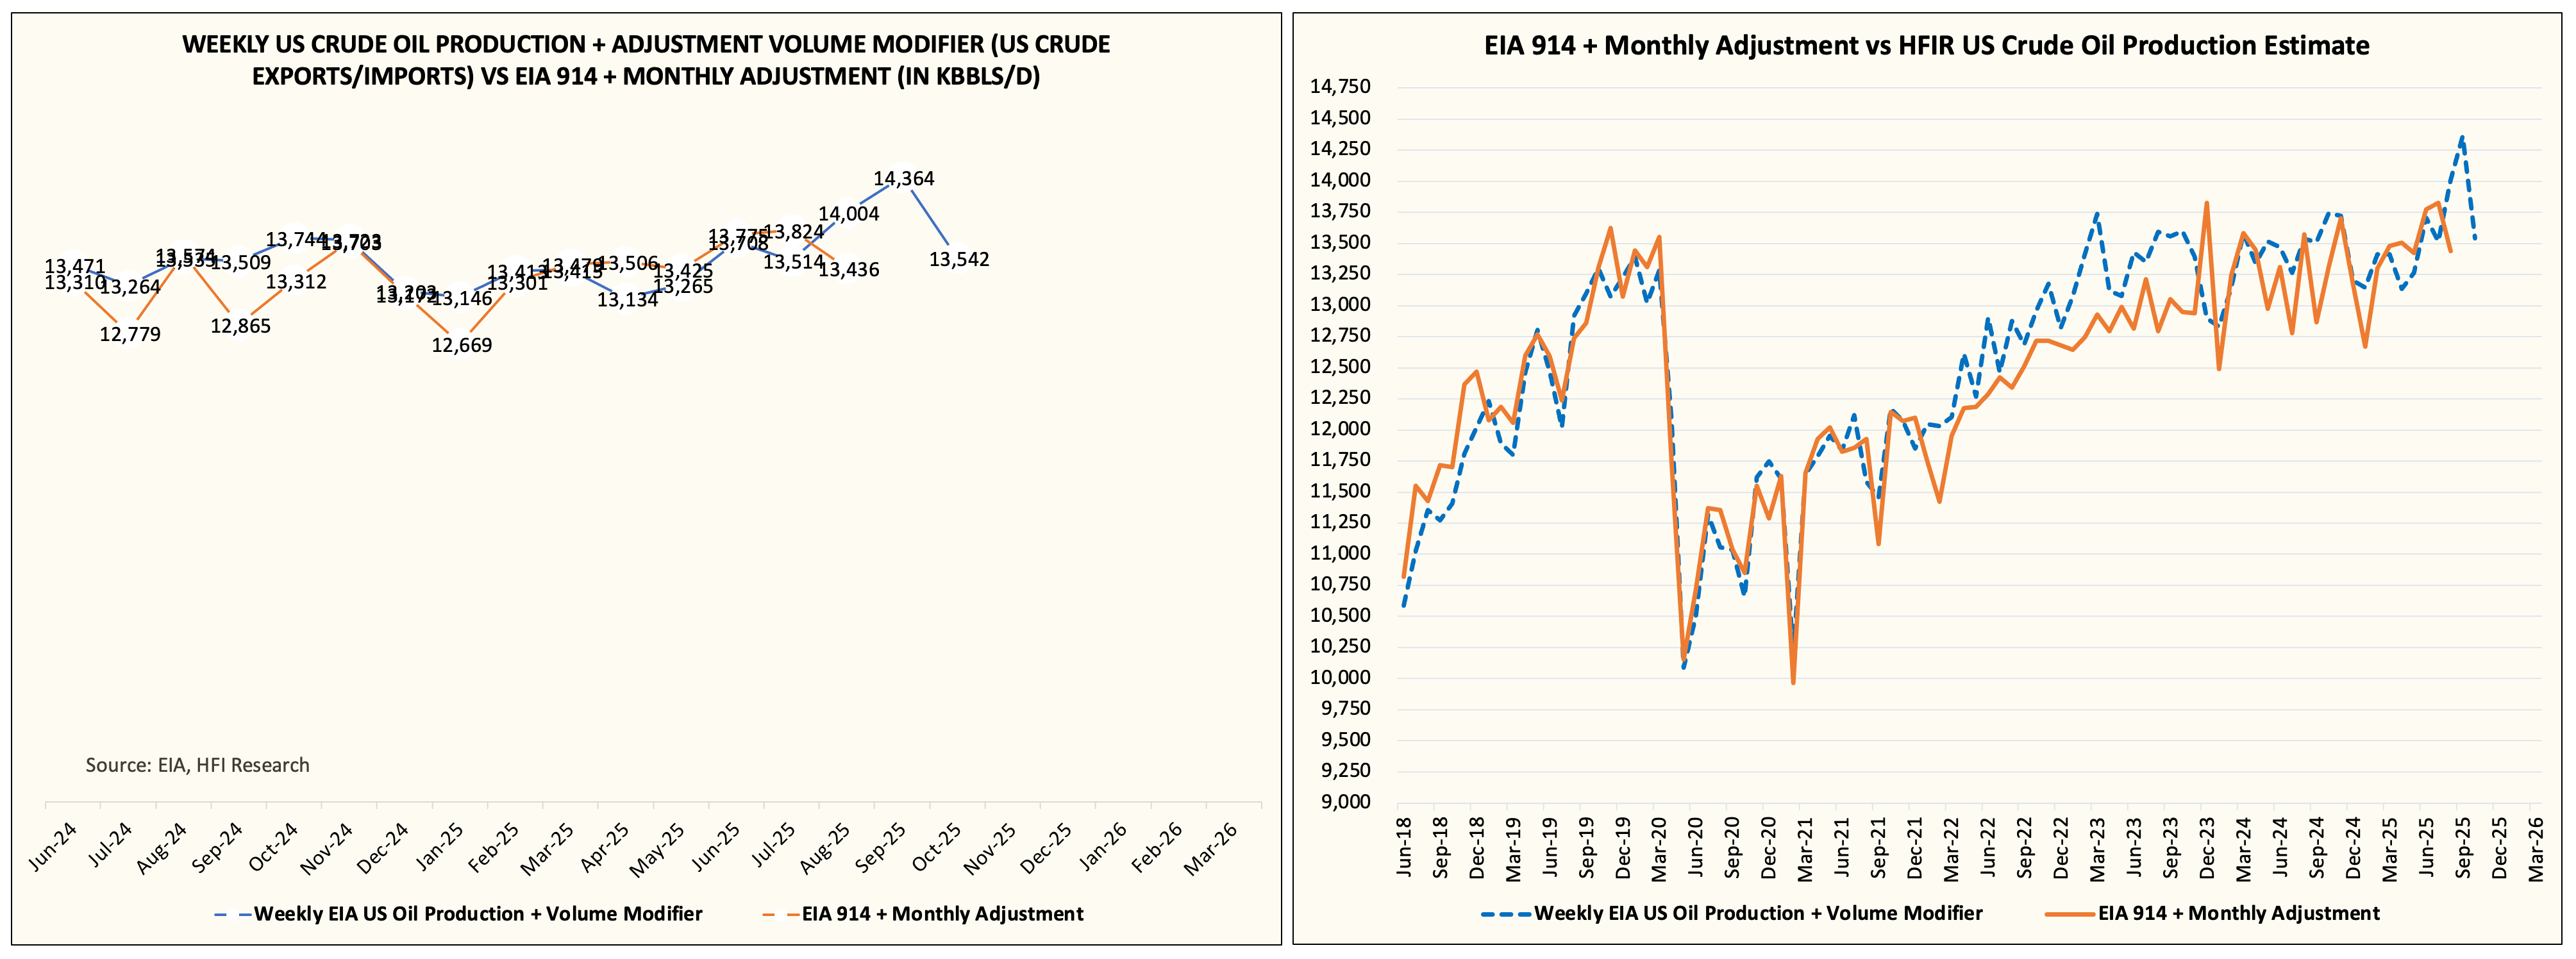
Here’s what we wrote:Fast-forwarding to last week, the EIA confirmed the production uptick we saw in August via the EIA 914 report. US crude oil production came in at ~13.794 million b/d or +430k b/d y-o-y. And according to our tracker, September US crude oil production will be higher than August, but it will be the peak.
For readers following our US crude oil production closely, it may feel like the data is noisy, but I can assure you that the surprise to the upside is real (validated by EIA 914) and the current surprise to the downside is equally real.
What does this mean for the oil market?
Intuitively, it was difficult to make the argument that US crude oil production would sustain near ~14 million b/d at today’s oil price. Oil producer CEOs I’ve discussed with in the past few months were in complete disbelief of the data, but following the EIA 914 report last week, some acknowledged that the increase did take place.
In addition, we saw in Exxon’s Q3 earnings report that Permian oil production increased by ~100k b/d quarter-over-quarter and +300k b/d y-o-y. Exxon has been the primary driver of production growth, and the drop we are seeing now is likely a combination of the drop-off in activity we started to see in Q2 2025 and the price decline we saw in October.
From what we know for certain, the Iran/Israel conflict in June allowed US shale producers to hedge production in the mid-$60s and to save their capex program for 2025. But with WTI back down to $60/bbl and the forward curve averaging ~$62/bbl, there’s no room to increase production.
Going forward, US shale producer capex programs for 2026 will be slashed relative to the 2025 program. Our rough estimate is ~15% reduction with very minimal declines in production. Public Permian producers have the ability to keep production flat with WTI at $60/bbl, while private producers will account for the bulk of the decrease.
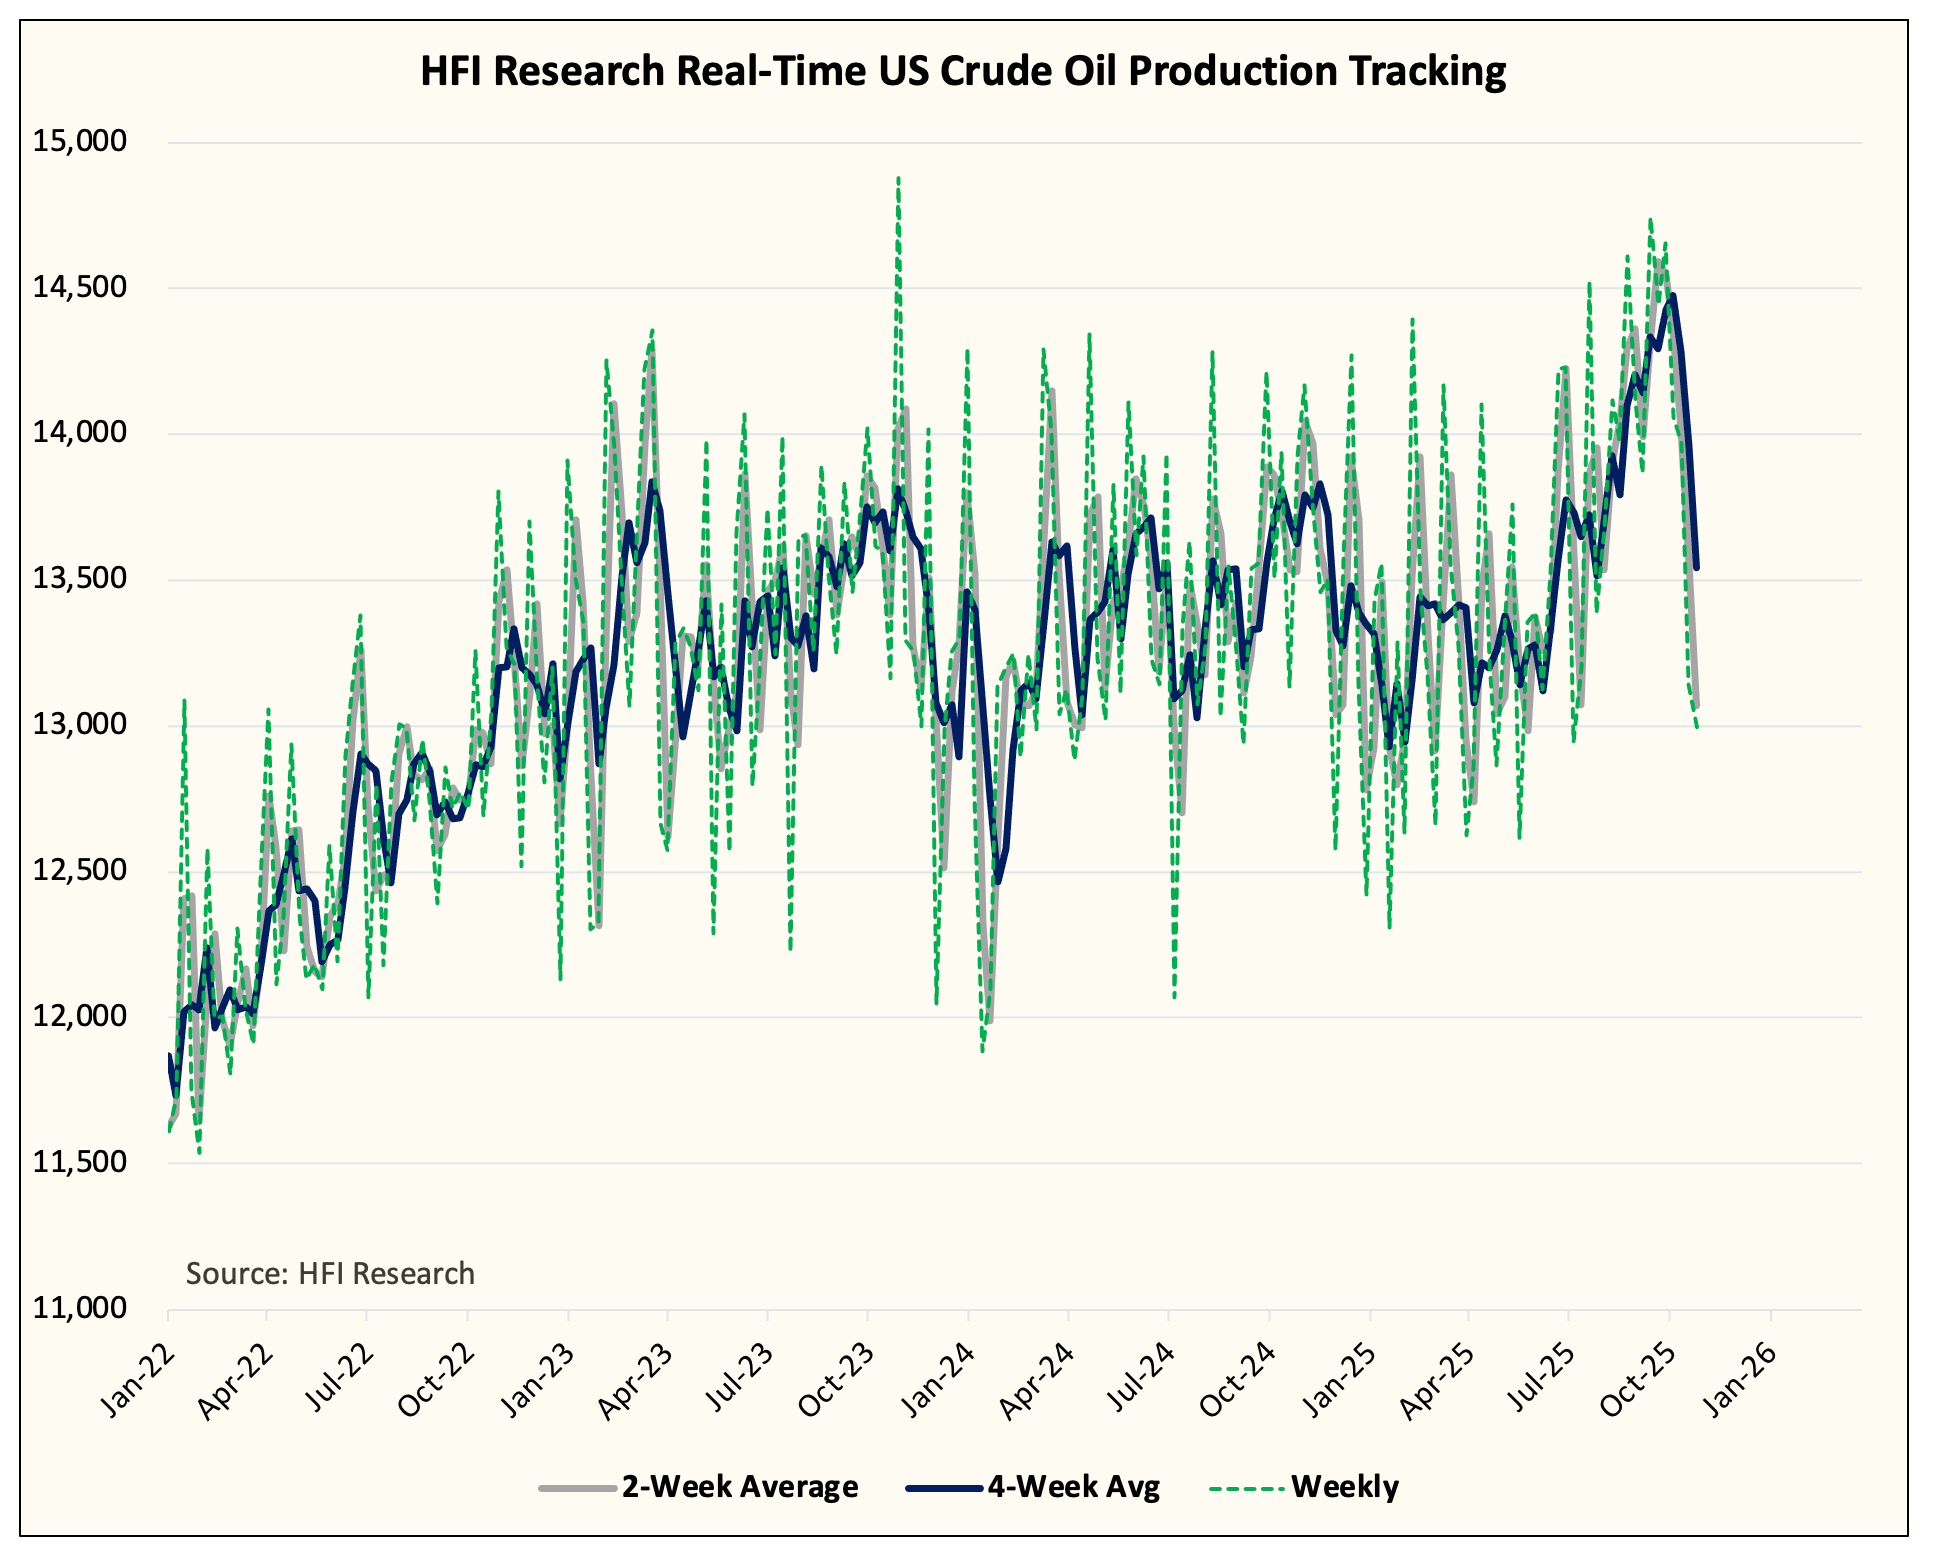
Our real-time data suggests a massive reversal in implied US crude oil production with the October average back to ~13.5 million b/d. My estimate for November is around ~13.4 million b/d, which is excellent news for those looking at 2026 balances.
But again, it’s important to caveat here that production would still be higher y-o-y despite the massive reversal we are seeing now. The oil market is far from being out of the woods as we need to see bullish data continue into November.
On the US commercial crude storage front, the drop in implied US crude oil production has dropped our estimate down to ~437 million bbls by year-end.
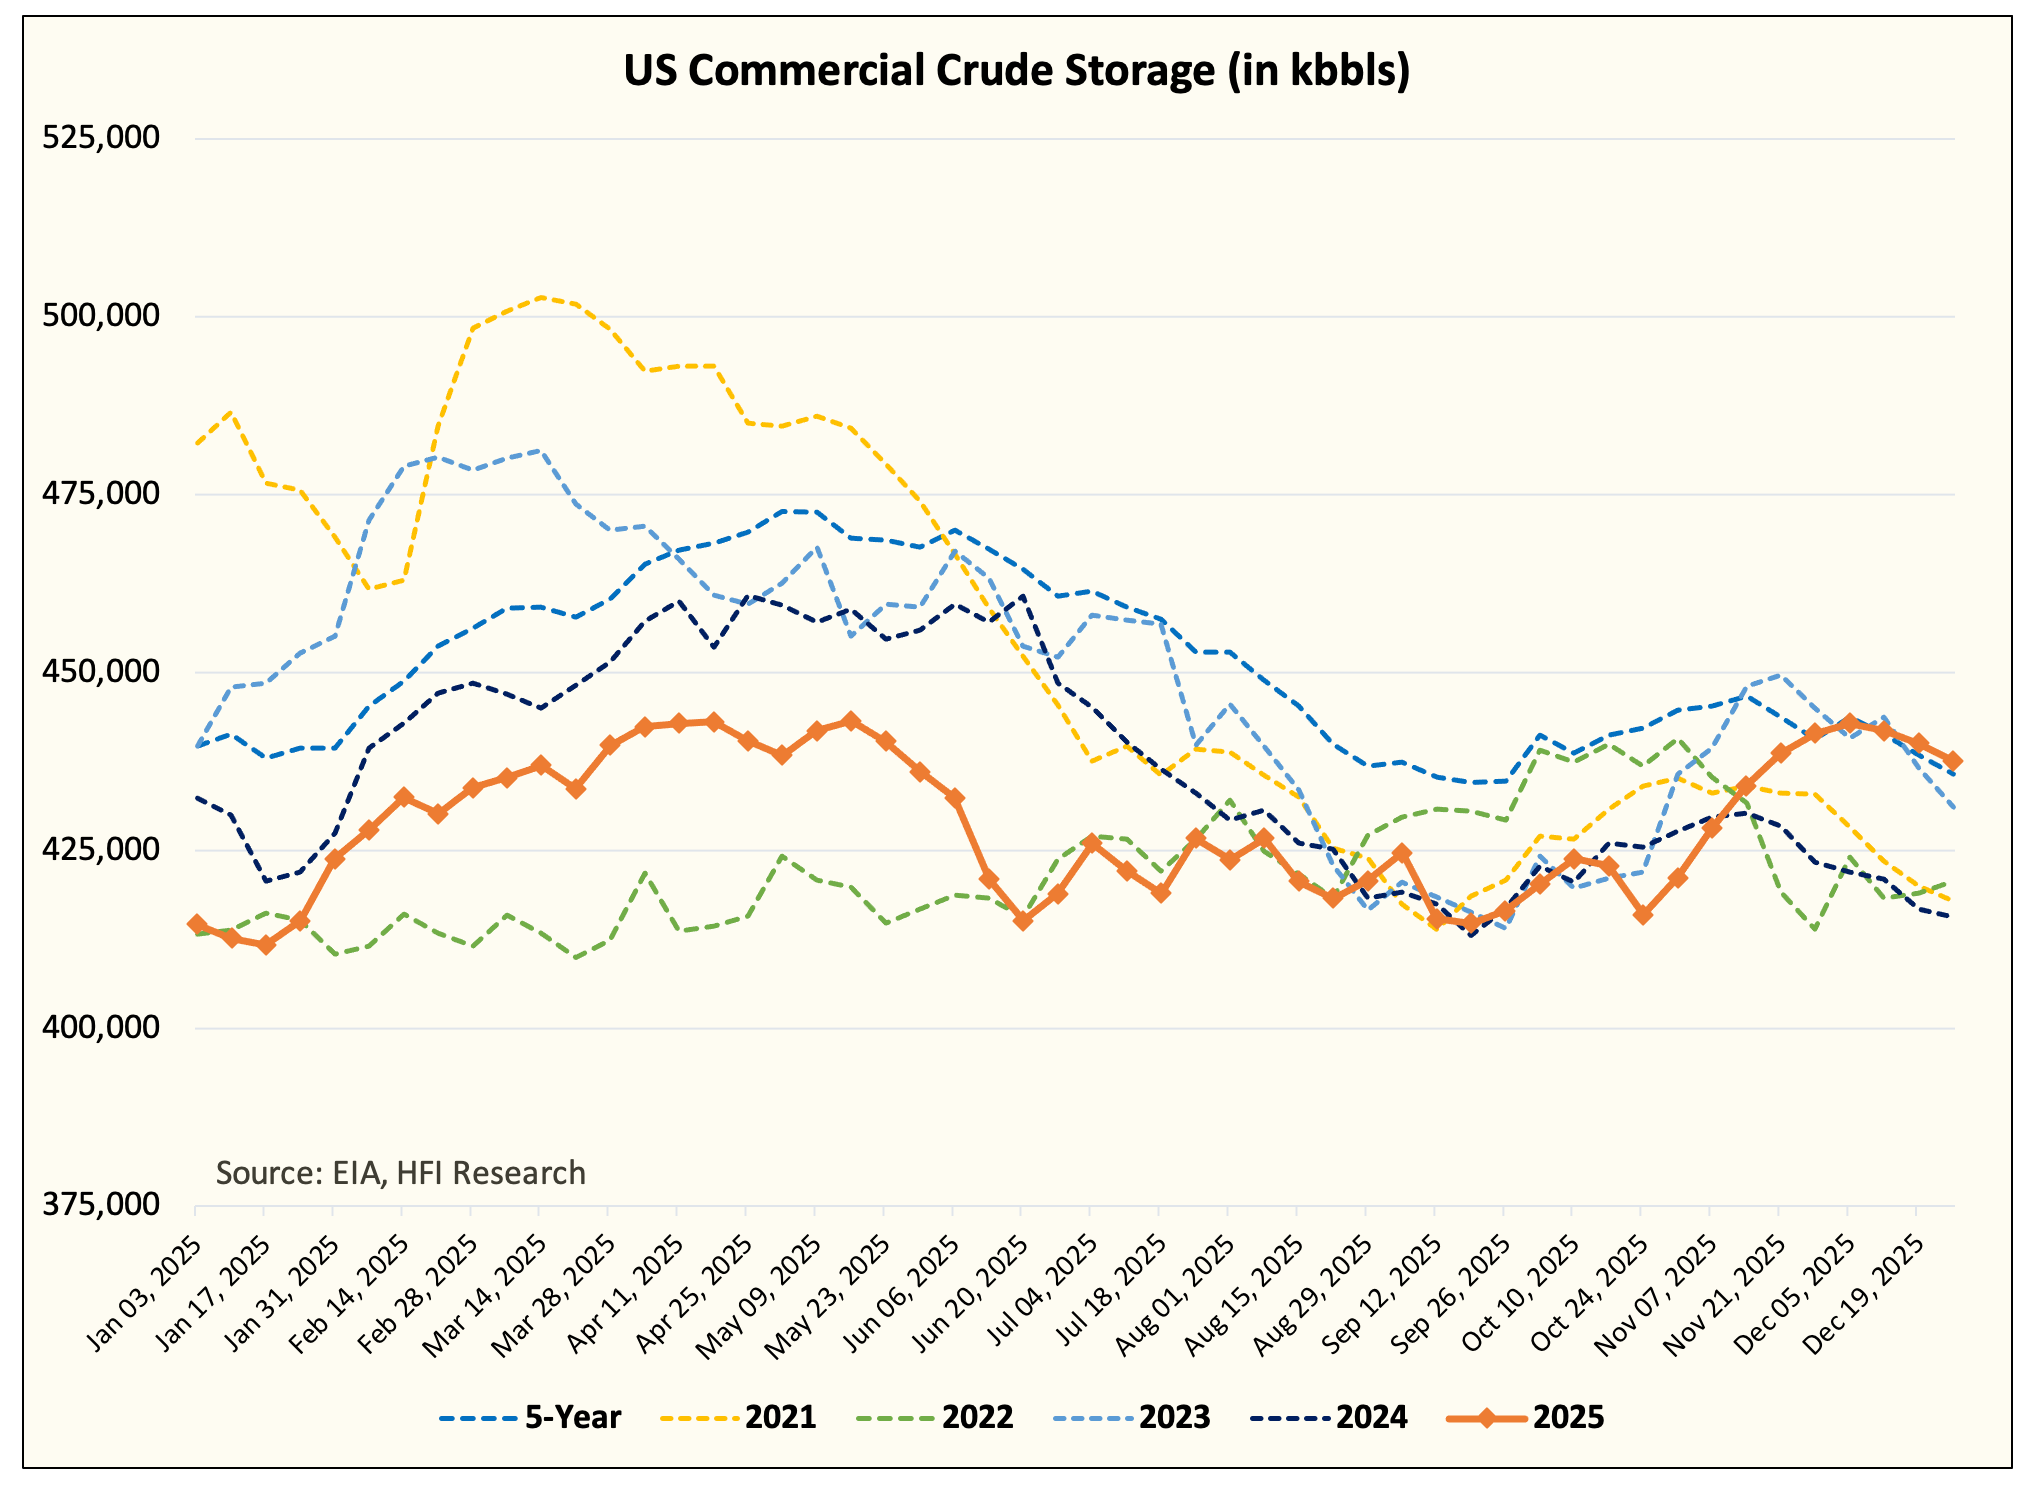
This would be in line with the 5-year average and higher than where we ended 2024.
On the global oil inventory side, the implied balance is very interesting. An oil trader we frequently talked to shared with us his implied balance data:
Global observable liquids excluding China, SPR, and oil-on-water: +0.2 million b/d in Q4 2025.
Oil-in-transit: +3.6 million b/d.
China: -0.3 million b/d.
The bulk of the surplus is on the way to hitting onshore storage soon and this is why I think crude timespreads are starting to meaningfully weaken:
Brent 1-2
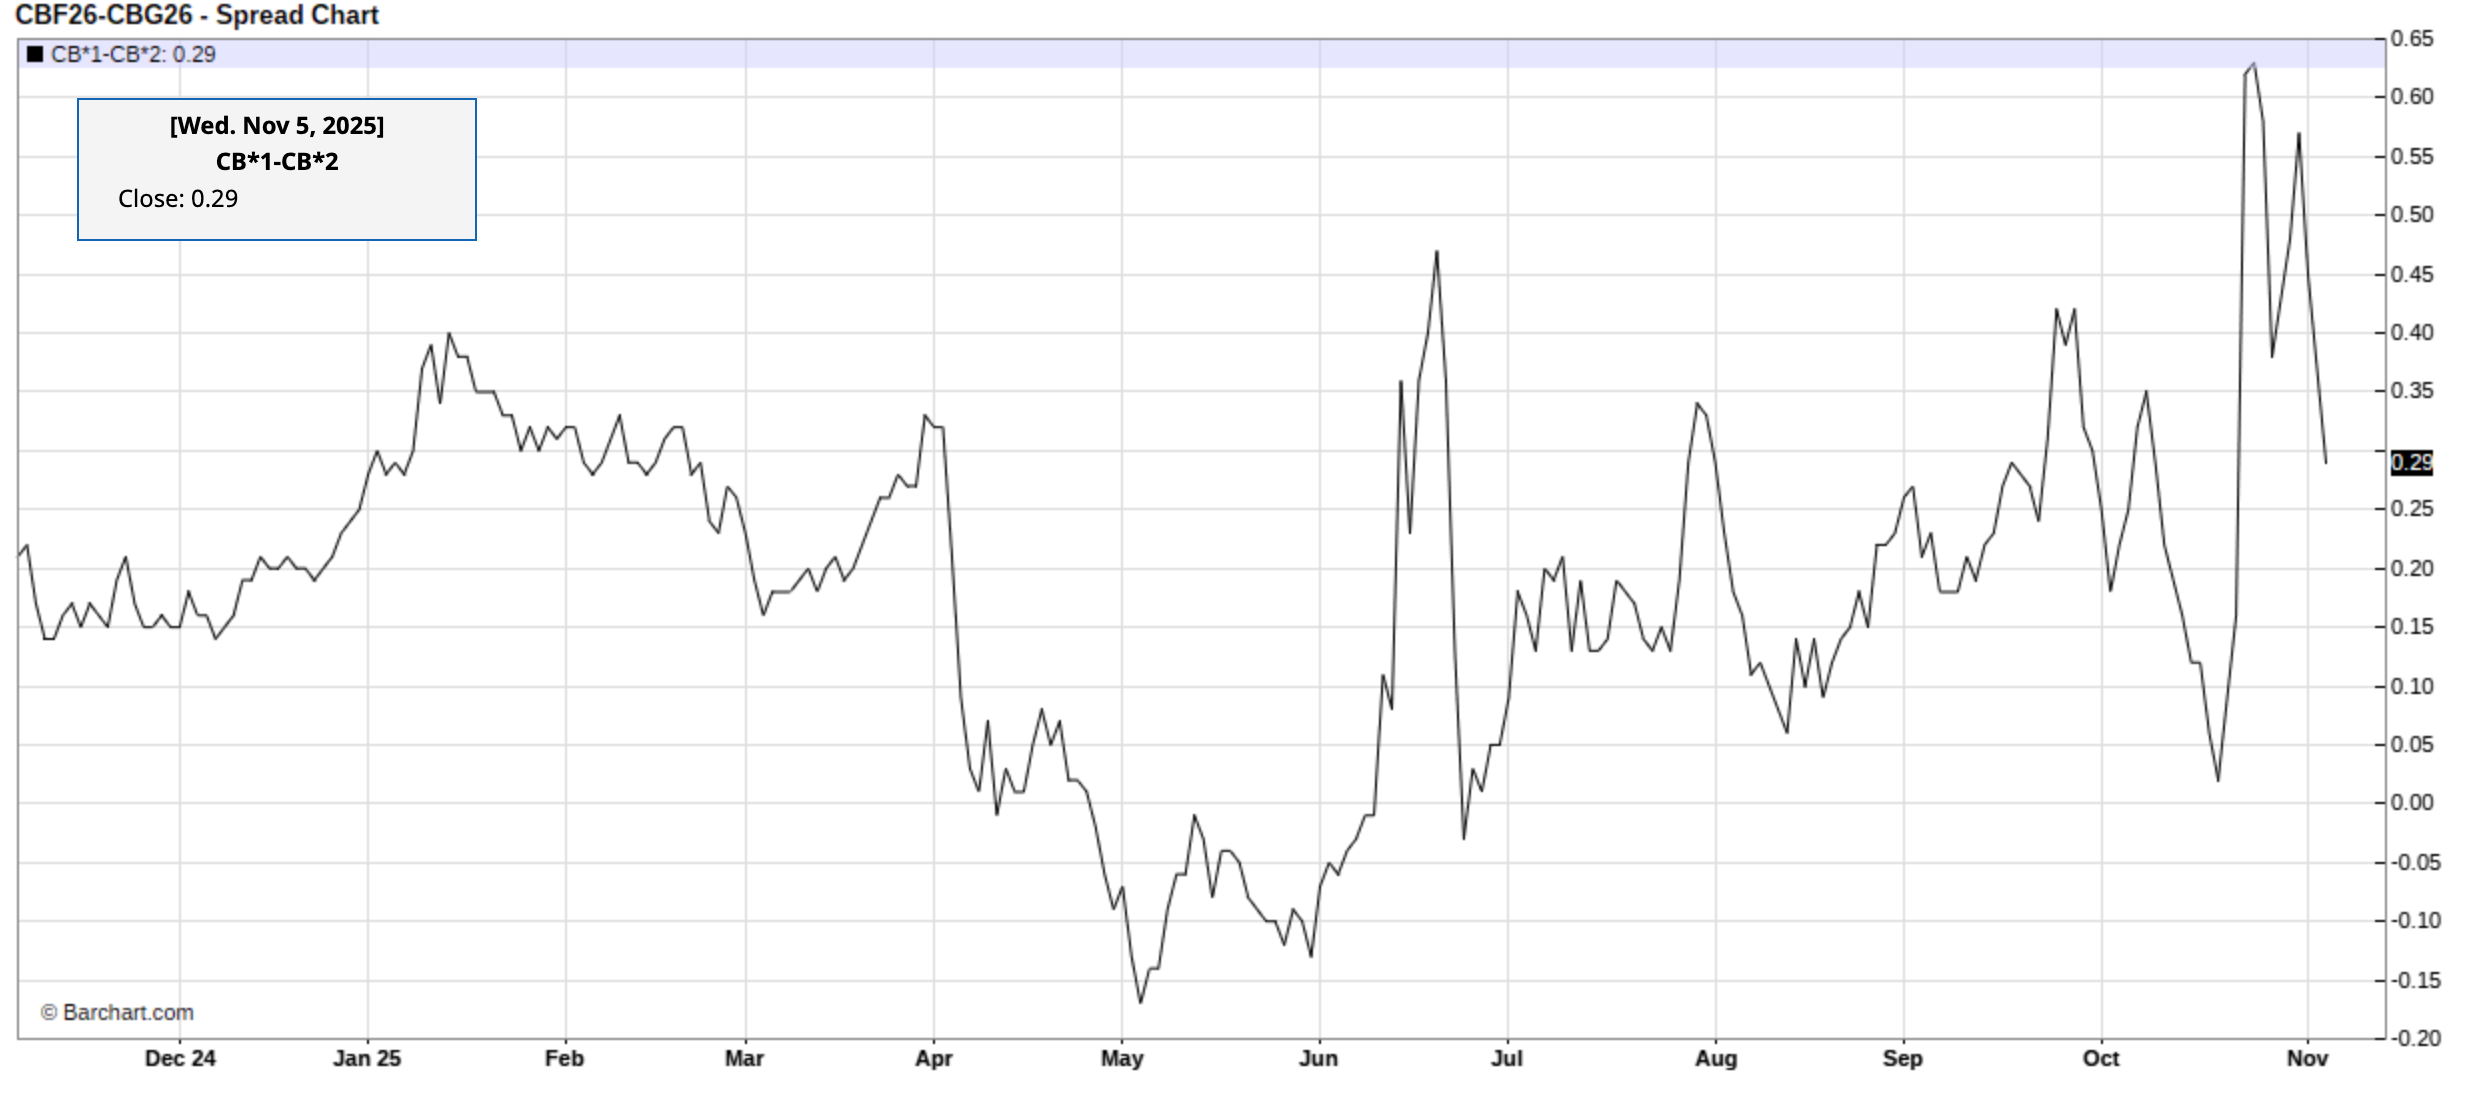
WTI 1-2
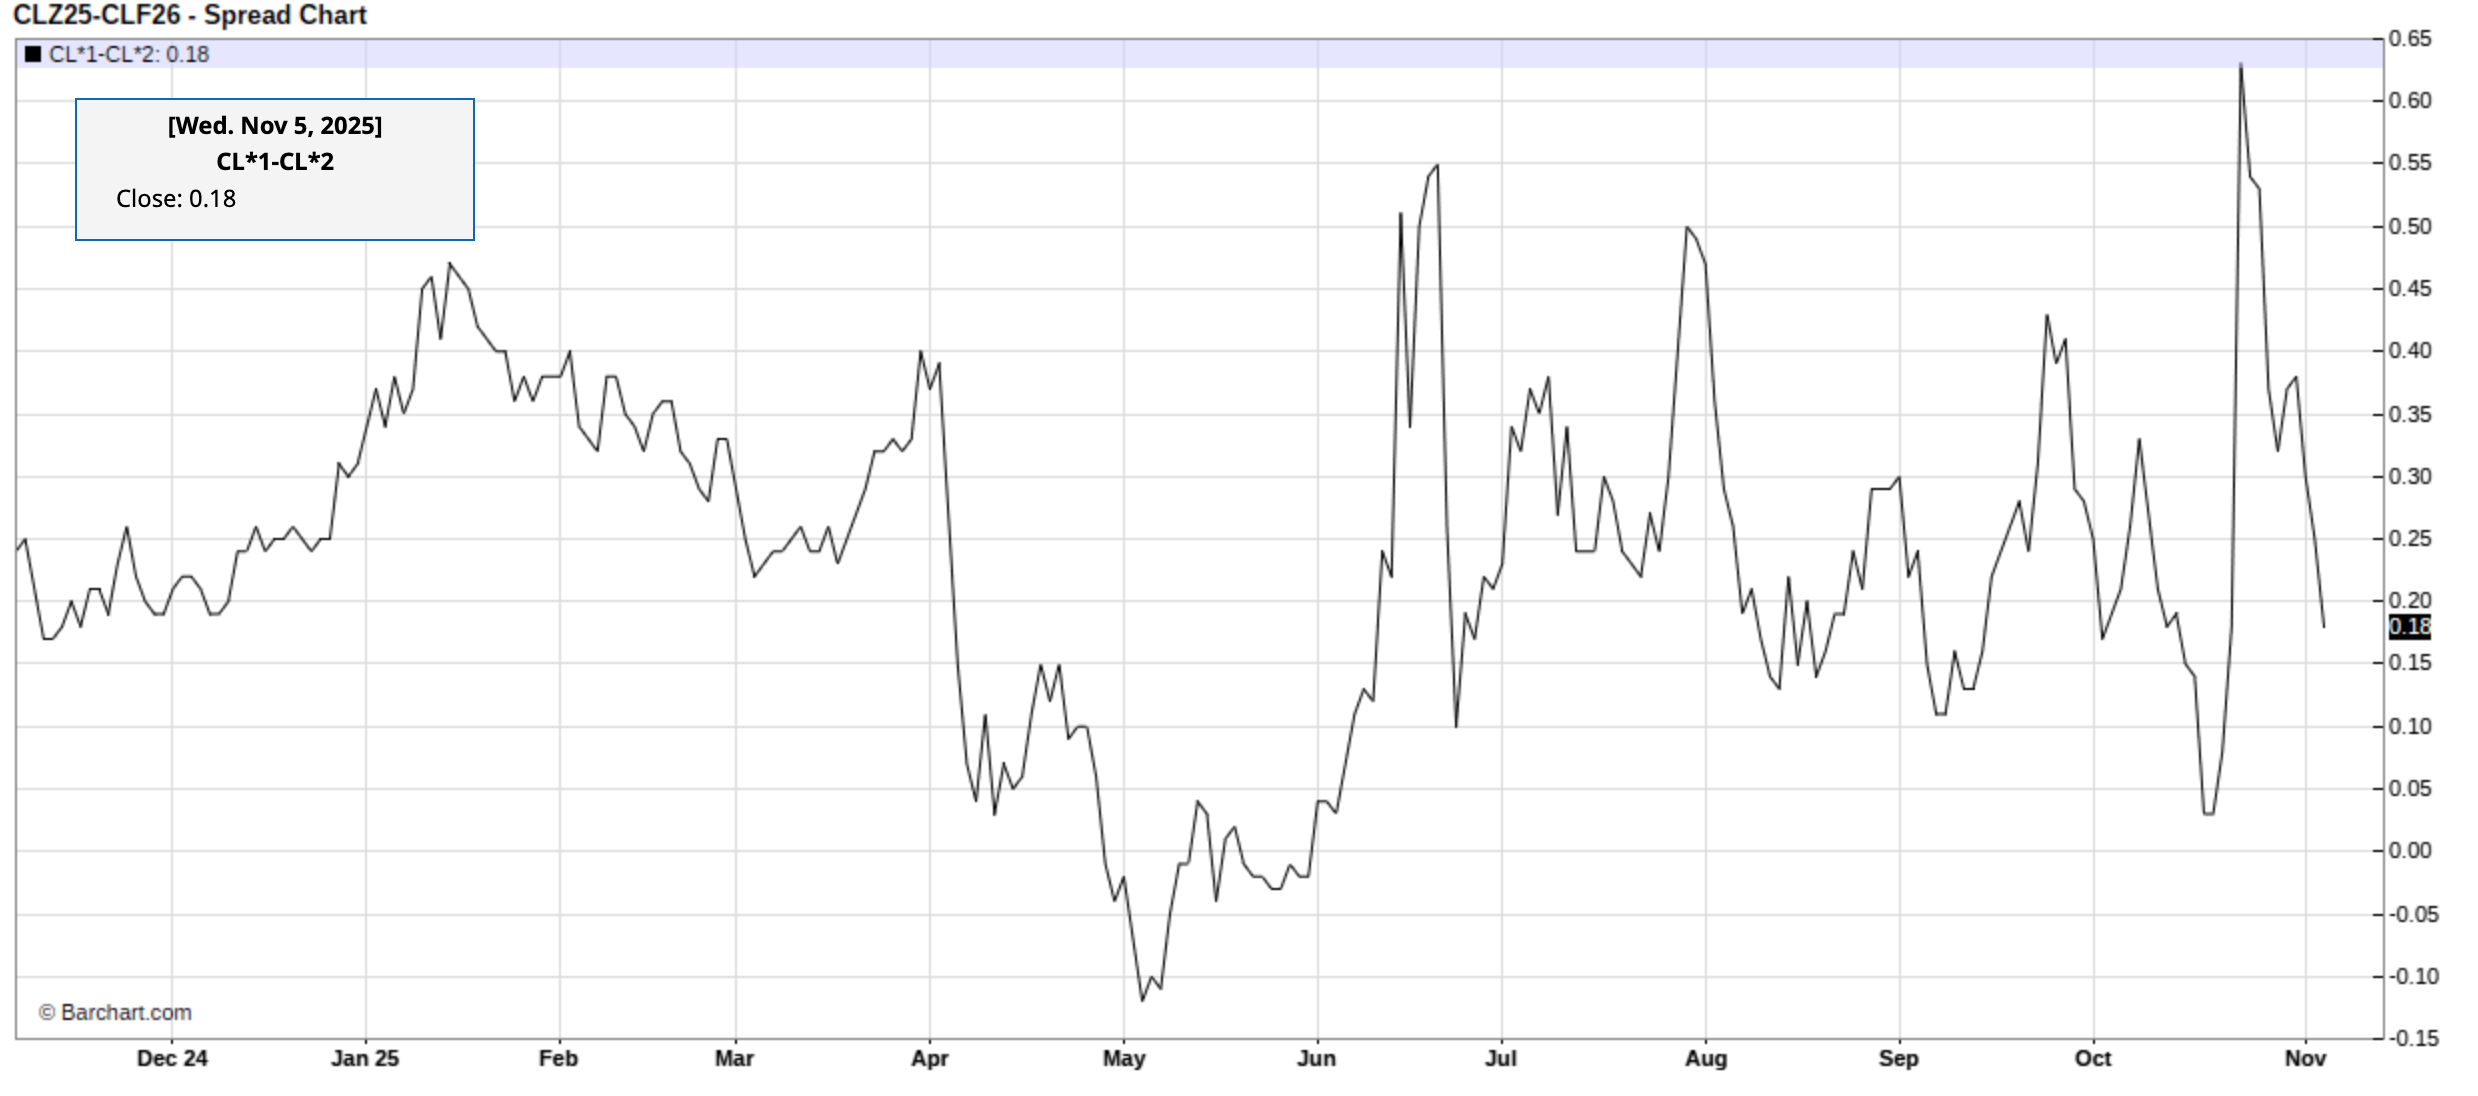
It’s very clear that the oil market is headed for contango, and when that occurs, you will see visible oil inventories pile up.
I think the US will be the last place that starts to build, so it will be a race against time. Can US crude oil production fall fast enough to keep up with the onslaught of crude that’s coming?
At this moment, I don’t think so.
Good Sign, Carry On
Let’s just say that I’m relieved. If US crude oil production really stayed at ~14 million b/d despite $60/bbl WTI, we would have been in an oil bear market for a long time. But real-time data pegged this week’s production at ~13 million b/d. There’s some data volatility involved here, but the good news is that the increase did not hold. As a result, we will need to see where US crude oil production bottoms out at and whether or not oil prices need to go lower to force even lower production.
And while what we are saying here is a “good sign”, it does not meaningfully change the fact that Q1 2026 will be oversupplied and that there’s a ton of crude on water today. Both factors will continue to pressure oil prices lower.
Analyst’s Disclosure: I/we have no stock, option or similar derivative position in any of the companies mentioned, and no plans to initiate any such positions within the next 72 hours.